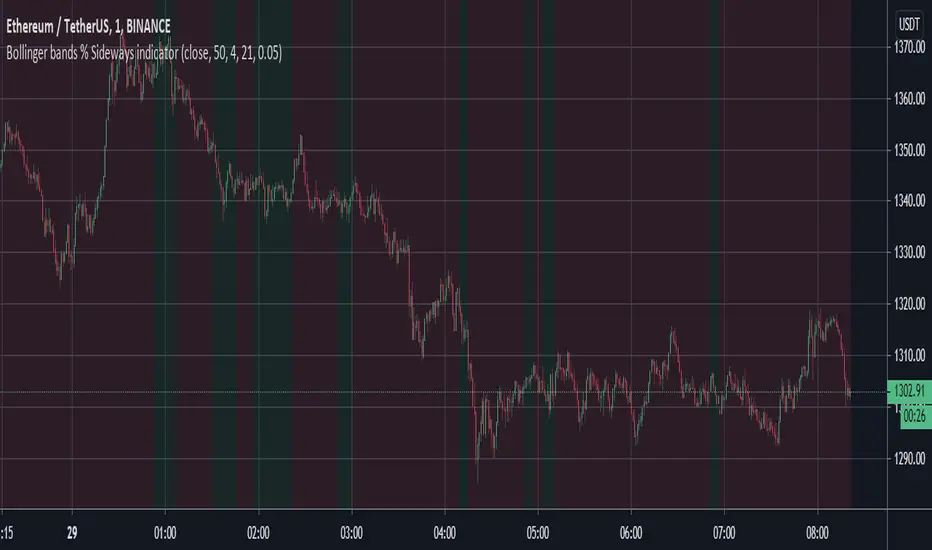
Bollinger bands % Sideways indicatorDetect sideways markets (green background) vs. trending markets (red background) with this indicator. It makes use of the Bollinger bands % as its base.
在腳本中搜尋"bollingerband"
Relative Channel BandwidthThis indicator uses different volatility channels - Bollinger Band, Donchian Channel and Keltner Channel width to measure volatility.
Indicator plots channel bandwidth percentage with respect to close price.
This is not same as Bollinger Percent B - which is measure of where price is with respect to band. Instead this indicator is similar to ATR Percent indicator published here:
Plotting is color coded to indicate volatility zone:
Red : Extreme volatility
Orange : High volatility
Lime : Low volatility
Green : Extreme low volatility
These levels are again derived by long period bollinger bands

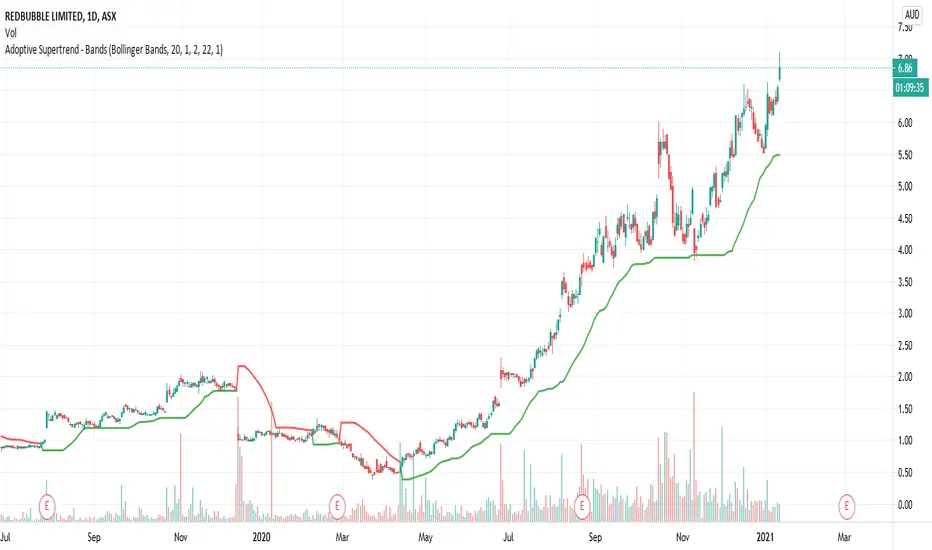
Adoptive Supertrend - BandsAnother adoption of supertrend. This time based on different channels - Bollinger Band, Keltner Channel, Donchian Channel and Pivot point based Donchian channel.
When price hits top of bands, it is considered as start or continuation of uptrend. When price hits bottom of the band it is considered as start or continuation of downtrend. Hence, supertrend is drawn based on these calculations. Use ATR Periods and ATR Multiplier to create stops certain ATR away from band's top and bottom.
Other supertrend adoptions published are here:
Pivot point based donchian channel is published here:
Donchian DipThe Donchian Dip
This strategy is designed to look for good "Buy the Dip" entries on stocks that are clearly in a strong 1-year upward trend. If you do not know how to identify those stocks on your own please do not use this system or continue your education until you do. The Donchian Dip strategy was designed on the daily time frame but works amazingly well on both daily and weekly timeframes. It does still work on intraday charts also if the current trend on the daily chart is in a strong uptrend.
Chart Setup:
3-period Donchian Channel with a 1-period offset (hide basis)
Bollinger Bands with the default settings of 20/2 (display basis)
Entry Signals:
There are 3 different entry signals that will be printed on the chart that have similar underlying criteria but are ranked based on skill level just like ski slope skill levels! I recommend only taking green entries until you are familiar with the system and the stocks you are trading.
Green Easy Entry:
This is the safest buy the dip entry that is normally found at or near a large retracement bottom. You might get one or two bad entries but be persistent and eventually, a great entry will present itself!
These are the specifics for the conditions that trigger a Green entry if you want to know what they are:
1. The current bar is an up bar (green or white bar) and closed above the lower Donchian channel
2. Previous bar or 2 bars back closed below the lower Donchian channel
3. Previous bar or 2 bars back closed below the Bollinger Band Basis (20 SMA )
4. The low of the previous bar or 2 bars back was below the lower Bollinger Band
Blue Intermediate Entry:
This is a decent entry if you missed the green entry, want to add to an existing position, or are not sure it will pull back far enough to even give a green entry. I would suggest only trade these entries to add to an existing pyramid position or get back into a trade that you were recently stopped out of. However, on high-flying stocks like TSLA these signals and the Black Diamond entry signals might be the only ones you get for a long time. Also, on the weekly chart, Blue or Black entries are sometimes all you will get for a year or more.
These are the specifics for the conditions that trigger a Blue entry if you want to know what they are:
1. The current bar is an up bar (green or white bar) and closed above the lower Donchian channel
2. Previous bar or 2 bars back closed below the lower Donchian channel
3. Previous bar or 2 bars back closed below the Bollinger Band Basis (20 SMA )
Black Diamond Advanced Rule:
This is normally just a small pullback re-entry signal on a strong trending stock like TSLA ...trade with extreme caution!!! You have been warned but daredevils feel free to give it a shot. I sometimes do trade these entries if the market and sector of the stock I am trading are extremely bullish or if I am looking to add to a position but I use a conservative stop.
These are the specifics for the conditions that trigger a Black entry if you want to know what they are:
1. The current bar is an up bar (green or white bar) and closed above the lower Donchian channel
2. Previous bar or 2 bars back closed below the lower Donchian channel
3. Previous bar or 2 bars back closed above the Bollinger Band Basis (20 SMA )
Exit Criteria:
The goal of this strategy is to buy the dip and hold as long as possible...let's practice some Paytience and exercise those holding muscles! RLT!!!
So, we don't want to exit early but we also want to protect our profits somehow. We do this by using the built-in trailing stops that are defined by dots of three different shades of purple on the chart (feel free to change these in the settings). Simply move your trailing stop to the highest current dot price level. Do not move the trailing stop down ever even if a lower dot is printed later. These are simply the suggested trailing stops and definitely use your own judgment for exits but if you backtest this strategy enough you will most likely discover that in the long run, these trailing stops work really well.
I hope this strategy helps you to identify good "Buy the Dip" entries on stocks you love as well as trains you to hold your winners longer for bigger gains.
***HOW TO ADD TO YOUR CHARTS***
1) Click the "Add to Favorite Scripts" button
2) Go to a stock chart and click the "Indicators" icon at the top
3) Next, on the left, click the "Favorites" and then click the "Naked Put - Growth Indicator v2"
4) It should appear on your charts, and you can click the "gear" icon on the study to edit a few settings.
5) Read the release notes above so you understand how it works.

BB+K strategyApplying Bollinger Bands and K-bar strategies
Suitable for long time periods
Suitable for forex trading, when the forex deviation is too large, the Fed will intervene and thus correct
Strategy: Enter when the price hits the upper or lower BB track and there is a reversal of the strong signal, and exit when it hits the other track and there is a reversal signal.

(JS) VWAP BandsThis is a pretty simple script here - I took the VWAP and combined it with Bollinger Bands.
The bands can vary a lot based on chart resolution, so I wanted to make sure the resolution could be modified so you can use the resolution you're most comfortable with, or find the most success with.
Length:
Length of bars used to calculate the bands.
Standard Deviation Band 1-3:
There's three bands all together, this option allows you to modify the number of standard deviations per band.
VWAP Period:
This modifies when you want the VWAP to begin (Session, Week, Month, Year).
Offset:
This moves the VWAP and the bands the amount of bars you select, default is of course set to zero.
Source:
This selects the source of calculation, HLC/3 is the default VWAP calculation.
This is a pretty self explanatory script, I thought being able to see the standard deviations of the VWAP could prove to be useful - hope you all like it!

Exponential Deviation Bands Width [ChuckBanger]This indicator is a compliment to Exponential Deviation Bands . It is the difference between the upper and the lower bands divided by the middle band. It is an easy way to visualize consolidation before price movements or periods of higher volatility.
How it works
During a period of high volatility, the distance between the two bands will widen and Exponential Deviation Bands width will increase. And the opposite occurs during a period of low volatility, the distance between the two bands will contract and Exponential Deviation Bands width will decrease. Meaning there is a tendency for bands to alternate between expansion and contraction.
When the bands are relatively far apart, that is often is a sign that the current trend is ending. When the distance between the two bands is relatively narrow that often is a sign that the market is about to initiate a bigger move in either direction.

Spread Entry Balance of PowerThis is a bar chart showing the strength of a potential option spread entry using 8 conditions for each side of a trade, bull or bear.
In theory, if the SE Strength (Spread Entry Strength) is at one of the extremes of the Bear or Bull side, then a spread is prime for entry.
To calculate this, the 8 conditions receive a 1 or zero dependent on whether the condition is true (1) or false (0), and then all of those are summed. The primary gist of the strength comes from Nishant's book, or my interpretation thereof, with some additives that limits what I need to review (such as condition 8 below.)
The 8 Bull Conditions are:
1) Bollinger Bands are outside of the Keltner Channels
2) ADX is trending up
3) RSI is trending up
4) -DI is trending down
5) RSI is under 30
6) Price is below the lower Keltner Channel
7) Price is between the lower Bollinger Band and the Bollinger basis.
8) Price at one point within the last 5 bars was below the lower Bollinger Band
The 8 Bear Conditions are the inverse conditions (except the first), and the conditions are given a negative disposition (meaning they sum to -8 :)):
1) Bollinger Bands are outside of the Keltner Channels
2) ADX is trending down
3) RSI is trending down
4) +DI is trending up
5) RSI is over 70
6) Price is above the upper Keltner Channel
7) Price is between the upper Bollinger Band and the Bollinger basis.
8) Price at one point within the last 5 bars was above the upper Bollinger Band

Double BB & Double EMA by IKINThis is the combination of code to detect the cross over between EMA 7 & EMA 21.
By using the double Bollinger Bands will help traders to make the decision by exit the counter just incase buy at the highest price.
Create for FREE TRADING VIEW USER

Bollinger Band Crossover SignalI'm a little surprised I couldn't find a BB crossover script on here since I've always used it on other charting software. So of course I had to write one in for TradingView.
Essentially what this script signifies are price breakouts when price crosses over the upper BB band. So what it shows is that market conditions are entering overbought territory.
Length is set to 20 and Standard Deviation is set to 2. These are the default settings.
The way I use the script is to identify breakouts in price, as well as a signal to start scaling out of a position if I am already in one.

Equivolume Overlay - Bollinger BandsA bollinger band overlay for Equivolume Bars .
To use it you must move it to the same existing pane as the Equivolume Bars pane and set it to the same scale (usually A).
Please ensure if you have modified the equivolume bars script's settings that you modify them in this script accordingly or they will not line up correctly.
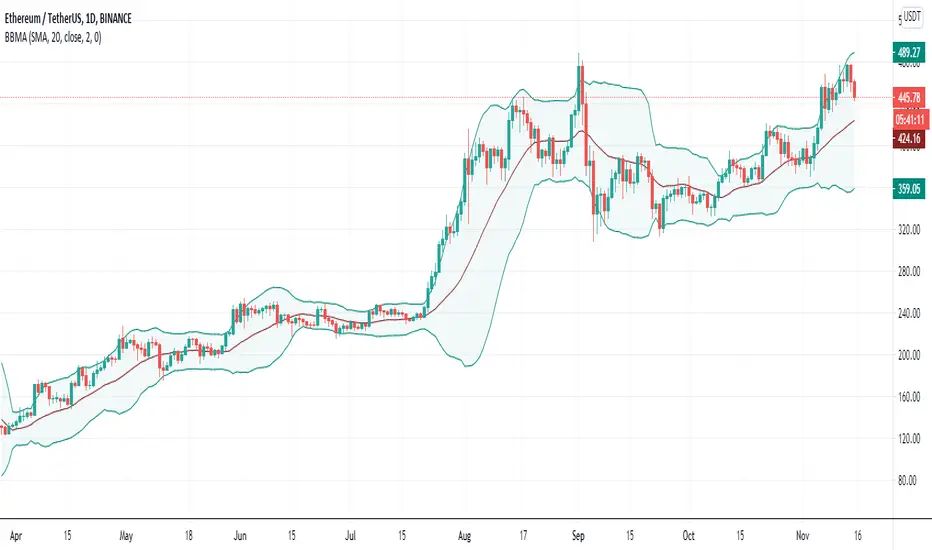
Bollinger Bands with Moving Averages and MTFBollinger Bands basically use SMA, here I revised it for use with many moving averages. Moving average types I have added: "EMA", "RMA", "SMA", "WMA", "VWMA", "WWMA", "TMA", "VAR", "ZLEMA", "TSF".
There is also an MTF option to view different time zones.
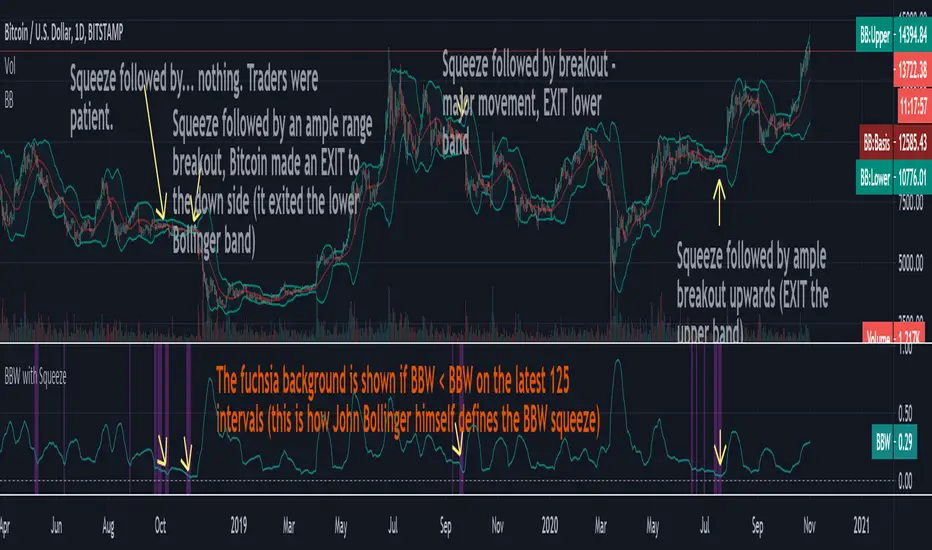
Bollinger Bands Width with Squeeze AlertThis is the standard Bollinger Bands Width (BBW) indicator with the added capability of detecting the "Bollinger Bands Squeeze" as defined by John Bollinger:
The BBW squeeze happens when BBW < all BBWs of the past 125 intervals.
Whenever a BBW squeeze occurs, this means there is low volatility.
A low volatility period is almost always followed by high volatility: a large breakout (with price performing ample movement and exiting the BBW bands) may suddenly occur.
The breakout may be preceded by a fakeout, during which price moves in the opposite direction.
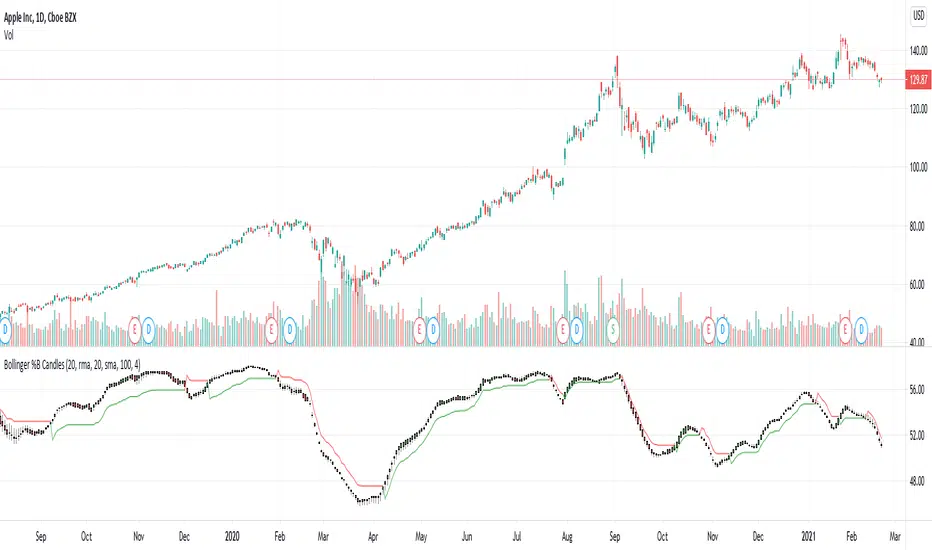
Bollinger %B Candles StrategyStrategy built based on earlier published indicator:
Looks to be doing good for short term swing trades. But, I am not sure if there is repainting. I tried to avoid buy/sell trades on same day - but wasn't successful.
So far back-tested on following:
COINBASE:BTCUSD - works on both long and short
CURRENCYCOM:GOLD and equities - long only.
Some of the failures: ASX:WPL , ASX:WHC , ASX:NHC
As usual for back-testing - using 1000 as initial capital with 100% invested on each trade and no compounding so that it will be easy to compare with buy and hold. Trade with caution :)

Bollinger %B CandlesCandlesticks made from Bollinger %B of high, low, open and close.
Input parameters are explained below:
BBLength : Bollinger band periods. Standard deviation is hardcoded as percent B scale does not change with standard deviation.
UseMovingAverage : Candles are formed on moving average of Bollinger Percent B instead of absolute values.
Moving Average Type : Type of moving average to apply on Bollinger %B values
Lookback Period : Moving Average periods.
ColorByPreviousClose : Color candles based on previous close.
Improved On balance volume with BB channel and double MAThis is an improved version of the on balance volume indicator.
I made it inside a bollinger band channel, so we can define better the zones. At the same time I applied 2 moving averages on OBV, to get a better idea of the trend and at same time that change direction of the trend.
Green - > uptrend - > we look for buy positions
Red - > downtrend -> we look for sell positions.
At the same time we have to be aware of crosses on bollinger bands, which can indicate a change in the trend .

Volume Weighted Bollinger Bands 出来高加重ボリンジャーバンドIt is a volume-weighted index of Bollinger Bands.
The central line is vwma so it's quite responsive
The standard deviation is also volume weighted
Charts without volume are not weighted with volume as 1.
It seems that the usage in trading is the same as the Bollinger band
ボリンジャーバンドを出来高加重した指標です
中央線はvwma出来高加重移動平均なのでかなり反応が良いです
標準偏差も出来高加重してしています
出来高の無いチャートは出来高を1として加重しないようにしています
トレードでの使い方はボリンジャーバンドと同じで良いと思われます

Stochastics and RSI HybridThis is an interesting study. We know bollinger bands can be a useful tool for price action, but what if we applied them to other indicators?
The top chart is the Stochastics and bottom chart represents RSI. We can see a relationship between the two indicators, where the signal line bounces of the bollinger bands.
The strategy is simple, when the signal lines bounce of their bollinger bands together, review price action and then take the trade. If you see one indicator going in the opposite direction to the other, or opposite to price action, then you may be observing divergence in which case a big move is about to happen.
If you wish to have this indicator further customised, please do not hesitate to contact me.

[M2J] Indicator | Turtle Atom Duck Signal Turtle Atom Duck shows potential buy and sell
It consist of 3 indicators
Turtle - Donchian Channel
- bullish when price close above previous 1 bar high
- bearish when price close below previous 1 bar low
Atom - Bollinger Band
- bullish when price close above upper band
- bearish when price close below lower band
Duck - Moving Average (Default 50-period EMA)
- bullish when price close above moving average
- bearish when price close below moving average
When all 3 are bullish, buy signal appears
When all 3 are bearish, sell signal appears
Screener Turtle Atom Duck
Example:
FBMKLCI
Technology Sector
Health Sector
TOPGLOV
BINTAI
XOX
PRLEXUS
JCY
EURUSD
XAUUSD

VWAP and BB strategy [EEMANI]This strategy combines VWAP and BB indicators
BUY RULE
1. EMA50 > EMA 200
2. if current close > vwap session value
3. check if price dipped BB lower band for any of last 10 candles
EXIT RULE
1. price closes above BB upper band
STOP LOSS EXIT
1. As configured --- default is set to 5%
warning: for the use of educational purposes only

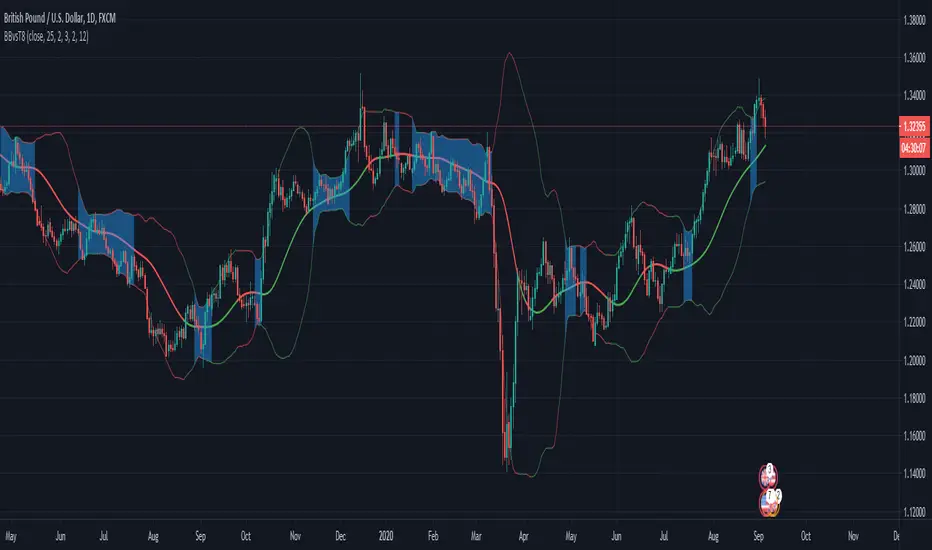
Bollinger Bands combined with Telson T8Indicator idea based on classic Bollinger bands and Telson T8 moving average.
The indicator detects Bollinger bands narrowing which should predict a move to a direction.
NOTE: You need to define in the indicator settings (Narrow percentage) the percentage between the upper and lower bands that would be highlighted.
For example: if you set 5%, the indicator will highlight the parts that the upper and lower bands are less than 5% compare the current price (usually close price, but you can define otherwise)
Use the Telson T8 to determinate the trend/direction of the move.
Price Volume Strength ComparatorBollinger bands says whether price or any source is relatively high or low at any particular point of time. We can apply Bollinger bands on RSI and volume indicator Price Volume Trend to identify if RSI movement or PVT movement is relatively high or low.
By calculating Bollinger %B, we can define the variation in a range between 0 to 1. By applying Bollinger %B on price, volume and strength, we are trying to compare how much they differ relative to each other.
For example, if Bollinger %B of volume is higher than Bollinger %B of price, which may mean, we can still expect continuation of upward movement. If volume %B is lesser, we can interpret this as price has moved more than the volume and may retrace back.
Note: I tried adding multiple volume/strength indicators as input choice. But, if condition did not work with simple string. Have no idea why. I will try adding that later if more people show interest.

GM All-purposeThis script plots multiple EMA's also it shows you when a particular EMA crosses up or below another EMA. You can customize the EMA's based on your setups or preferences.
This script basically will help you easily identify when a particular EMA has crossed over or crossed under another EMA at one glance.
Particularly useful when there is a lot of entanglement of the EMA's
There is also dual Bollinger Bands & Donchian Channels that are available to check the volatility of that particular scrip, which will help you stay in the trade or exit based on your criteria.
