CBG Swing HighLow MAThis indicator will show the swing high and lows for the number of bars back. It's very easy to use and shows good support and resistance levels.
I then took it a step further and added a moving average with all the standard types in my indicators:
SMA
EMA
Weighted
Hull
Symmetrical
Volume Weighted
Wilder
Linear Regression
I then added Bollinger Bands to show the standard deviation from the midline.
Finally, I added a simple bar coloring scheme: green if above the upper BB, Red if below and orange if in the middle.
I am just testing this out so please use with caution. If anyone in the community wants to run some backtests, that would be great and we would all appreciate it.
Of course you can keep it all simple and turn off all the moving averages and bollinger bands.
Enjoy! :-)
在腳本中搜尋"bollingerband"

Gap driven intraday trade (better in 15 Min chart)// Based on yesterday's High, Low, today's open, and Bollinger Band (20) in current minute chart,
// Defined intraday Trading opportunity: Stop, Entry, T0, Target (S.E.T.T)
// Back test in 60, 30, 15, 5 Min charts with SPY, QQQ, XOP, AAPL, TSLA, NVDA, UAL
// In 60 and 30 min chart, the stop and target are too big. 5 min is too small.
// 15 min Chart is the best time frame for this strategy;
// -------------------------------------------------------------------------------
// There will be Four lines in this study:
// 1. Entry Line,
// 1.1 Green Color line to Buy, If today's open price above Yesterday's High, and current price below BB upper line.
// 1.2 Red Color line to Short, if today's open price below Yesterday's Low, and current above BB Lower line.
//
// 2. Black line to show initial stop, one ATR in current min chart;
//
// 3. Blue Line (T0) to show where trader can move stop to make even, one ATR in current min chart;
//
// 4. Orange Line to show initial target, Three ATR in current min chart;
//
// Trading opportunity:
// If Entry line is green color, Set stop buy order at today's Open;
// Whenever price is below the green line, Prepare to buy;
//
// If Entry line is Red color, Set Stop short at today's Open;
// Whenever price is above the red line, Prepare to short;
//
// Initial Stop: One ATR in min chart;
// Initial T0: One ATR in min chart;
// Initial Target: Three ATR in min chart;
// Initial RRR: Reward Risk Ratio = 3:1;
//
// Maintain: Once the position moves to T0, Move stop to "Make even + Lunch (such as, Entry + $0.10)";
// Allow to move target bigger, such as, next demand/supply zone;
// When near target or demand/supply zone or near Market close, move stop tightly;
//
// Close position: Limit order filled, or near Market Close, or trendline break;
//
// Key Step: Move stop to "Make even" after T0, Do not turn winner to loser;
// Willing to "in and out" many times in one day, and trade the same direction, same price again and again.
//
// Basic trading platform requests:
// To use this strategy, user needs to:
// 1. Scan Stocks Before market open:
// Prepare a watch list for top 10 ETF and Top 90 stocks which are most actively traded.
// Stock might be limited by price range, Beta, optionable, ...
// Before market open, Run a scan for these stocks, find which has GAP and inside BB;
// create watch list for that day.
//
// 2. Attach OSO and OCO orders:
// User needs to Send Entry, Stop (loss), and limit (target) orders at one time;
// Order Send order ( OSO ): Entry order sends Stop order and limit order;
// Order Cancel order ( OCO ): Stop order and limit order, when one is filled, it will cancel the other instantly;

(NKC) MTF Squeeze Pro MultiTimeframe Squeeze Momentum Pro
Dots indicate squeeze
Fills indicate momentum


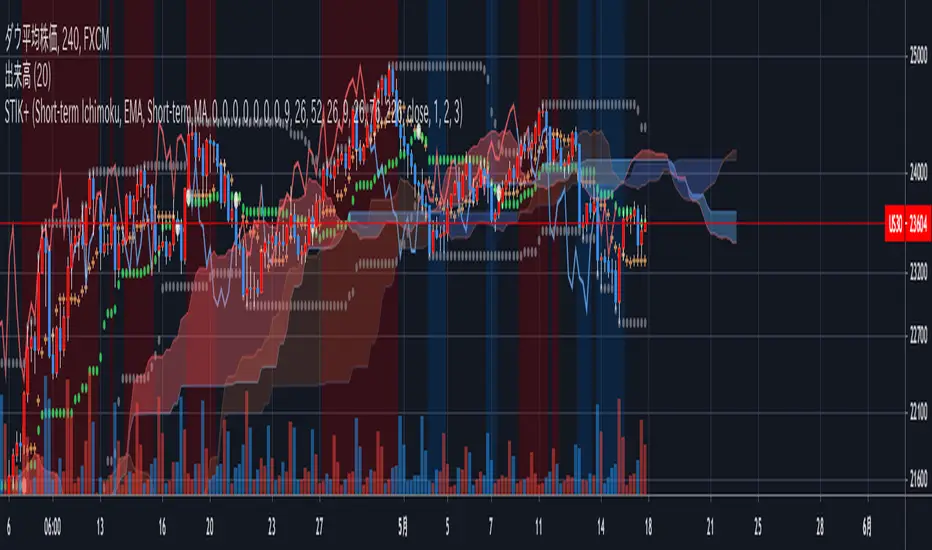
Short-Term Ichimoku Kinko-hyo+This Ichimoku Kinko-Hyo is an indicator which has been changed for short-term trading and, It has a “target price theory(one of three theory of Ichimoku Kinko-Hyo) function.”
Also, In this indicator, It can be plotting the “Span model”, “Super Bollinger Bands” which has Invented by a Japanese currency dealer Toshihiko Masaki, And Moving Average.
In addition, you can select setting only “clouds” and “Lagging span” or displaying Default Ichimoku Kinko-Hyo.
This indicator is modified original Ichimoku Kinko-Hyo, but It made based on the true usage of Ichimoku Kinko-Hyo.
For the evidence, I referred to the book supervised by Ichimoku-Sanjin the third generation.
Describe below about features↓↓↓.
- 2nd Cloud to check relation two Lead Lines and Lagging span.
- Background-color for discovering “Three Roles Improvement (In Japanese: 三役好転)” and “Three Roles Reversal (In Japanese: 三役逆転)”.
- Signal of Crossing Base Line and Conversion Line.
- mode selection of Ichimoku Kinko Hyo.
- Calculation feature for Target Price theory.
- A switch to replace Base Line and Conversion Line with 3 Moving Average lines.
- And others...
JSE Top 40 Comparative Relative StrengthThis code adapts the code by vitvlkv to be appropriate for comparison of JSE stocks with the Top 40 index. It also includes moving averages and Bollinger Bands to identify extreme conditions. You can change the colours and deselect moving averages to make the plot less cluttered. You can also change the selection to compare the stock against to JSE:J201 if you want to compare it to the All Share Index.

Better Bollinger BandsIt is a highly configurable Bollinger Bands implementation.
You can choose different moving averages: EMA, SMA, WMA, VWMA, RMA (Wilder's EMA), ZLEMA, HMA (Hull MA), ALMA
Select between standard or mean deviation
You can use "High" or "Low" for upper and lower bands, which makes them much better for dynamic support-resistance
You can shift (offset) right the bands to use it as support and resistance in the future

Bollinger Bands Fibonacci Ratios (Automatic Timeframe)A Fibonacci Bollinger Bands indicator with automatic timeframe detection.
The timeframe reverts to the value specified in settings when viewing Daily, Monthly or seconds-based charts.
Based on: Bollinger Bands Fibonacci ratios by Shizaru (/script/bCy9urOG-Bollinger-Bands-Fibonacci-ratios/)

PS3X BB CompanionTo be used as a visual tool alongside "Profit Sniper 3.0" Indicator to allow you to identify suitable exit points for trades relating to price crossing Bollinger Bands, example use is on the 30 minute chart to identify bullish or bearish trends to guide lower timeframe trading plays.
Send me a PM to get access.

PS3X BB CompanionPS3X BB Companion indicator to use ideally on higher timeframes (HTF) to alert on trend changes and potential trade exits.
To be used as a visual tool alongside "Profit Sniper 3.0" Indicator to allow you to identify suitable exit points for trades relating to price crossing Bollinger Bands, example use is on the 30 minute chart to identify bullish or bearish trends to guide lower timeframe trading plays.
Send me a PM to get access.

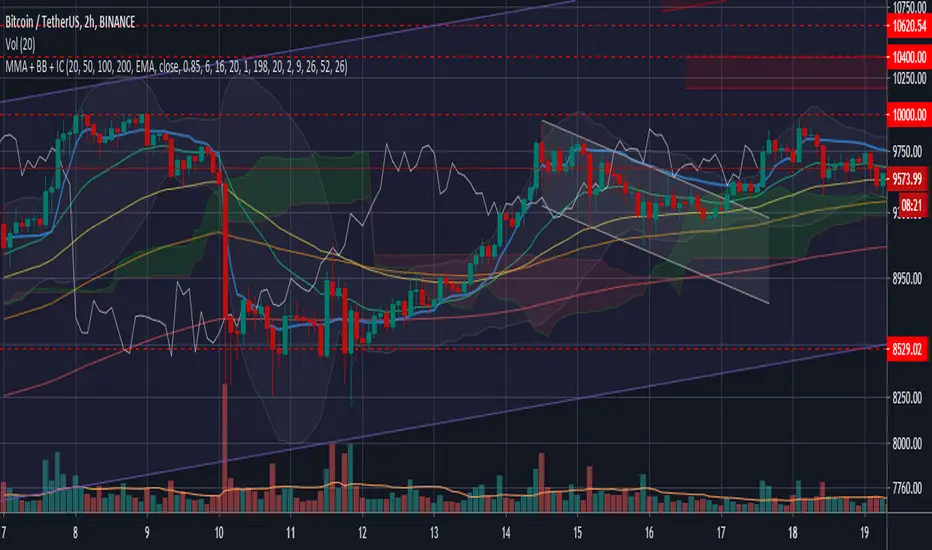
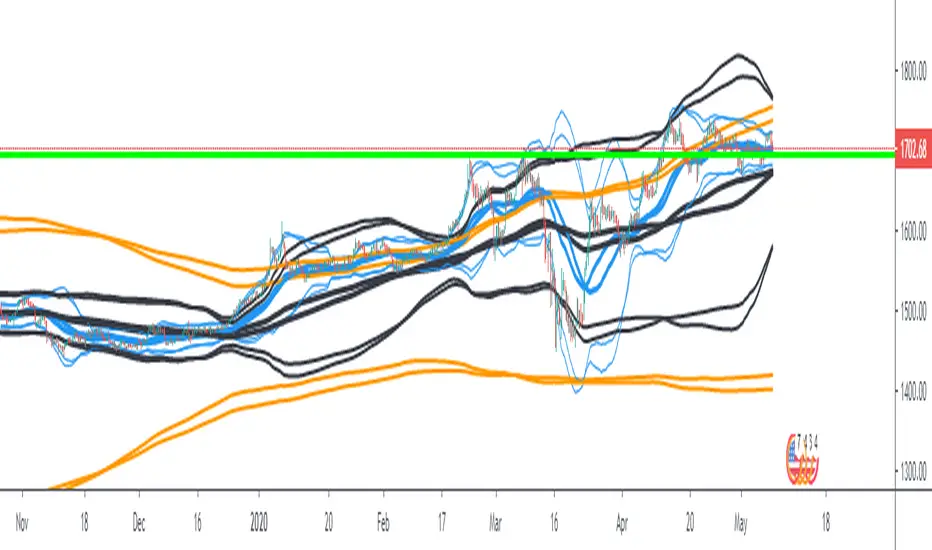
Multiple MA + Bollinger bands + Ichimoku cloudThis is an extension of my previous script 'Multiple MA', now featuring also an Ichimoku Cloud and Bollinger bands.
More, I added more functionality to the integrated Bollinger bands script, that by default use only Standard Moving Average to plot the bands. With this script you can plot Bollinger bands using the MA you prefer from the ones included in the 'Multiple MA' script (SMA, EMA, WMA, VWMA and Hull MA), allowing you to better fit your preferences.
About Ichimoku cloud I choose to enable by default only the cloud and the lagged price, which I consider the most useful components of this indicator, however you can enable each component from the settings.
I tried to make 3 indicators fit well with each other using some graphical customization (It works quite well with dark background). However keep in mind that i made this script as much customizable as possible, letting you enable and disable each one of the components from the plot. So you can take advantage of the whole indicators, and in case, clean the plot when you feel it's too much full of drawings and lines.
Please show me your support if you like the script, and find it useful, thanks!
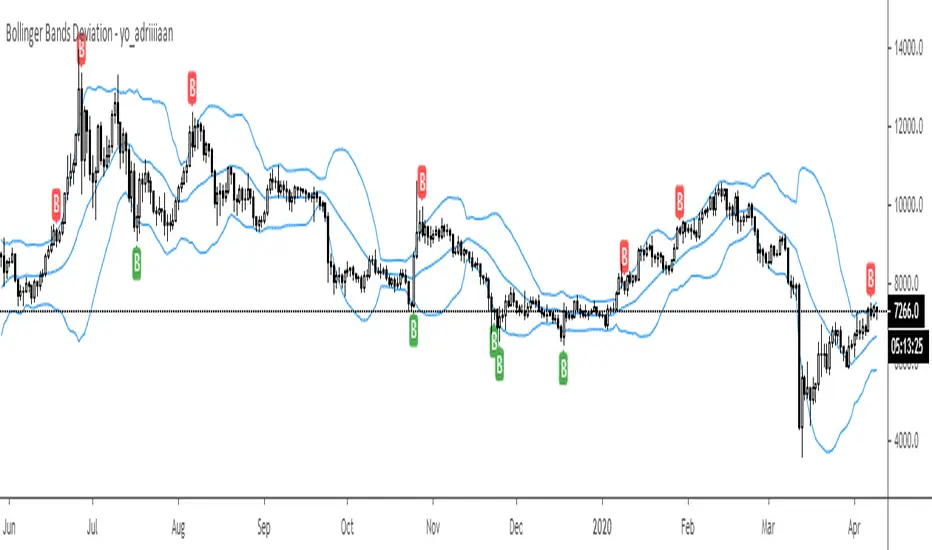
Bollinger Bands Deviation - yo_adriiiiaanBollinger Band Deviations
In theory price trades within 2 standard deviations 95% of the time. This is an attempt to capture that 5% that deviates from the bands.
Useful for taking profit or signaling a reversal.
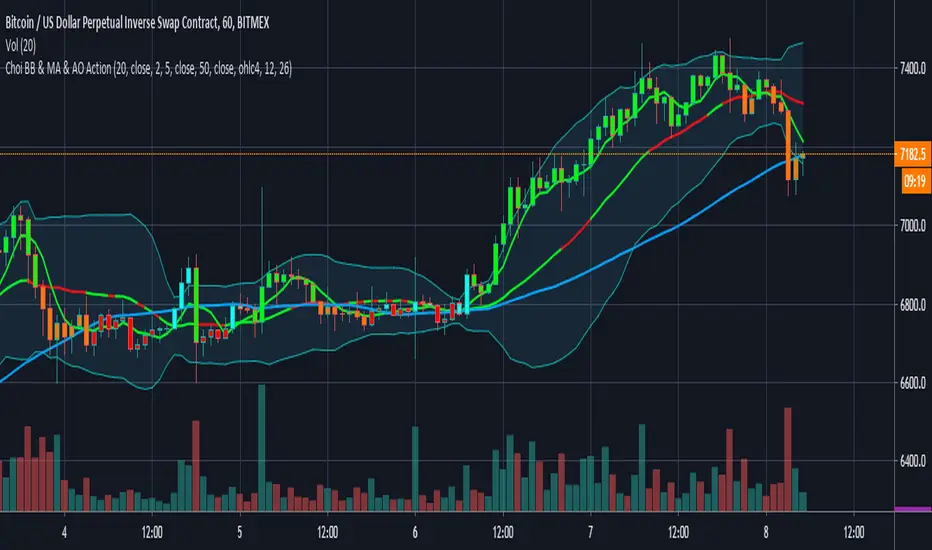
Choi Bollinger Band, Moving average, Awesome Oscillator Action Combine Bollinger Band signal with Awesome Oscillator signal by changing the baseline of signal Bollinger Band as well to show trading status.
This also includes 5-day and 50-day Moving average signals and the color change of candles To show trading status.
Multi-TimeFrame Bollinger BandsScript which plot multi-timeframe bollinger bands, up to 3 different timeframes. It is intended to show higher timeframe bands on a smaller timeframe. Default options are 1m, 5m and 15m and used on a 1m chart for crypto-currencies.
It can be used to get a better overview of the current trend.
Bollinger Bands Plus [xdecow]Bollinger bands with the option to use different types of moving averages.
-SMA
-EMA
-RMA
-WMA
-VWMA
-SWMA
-DEMA
-HMA
-SMMA
-T3
-TEMA

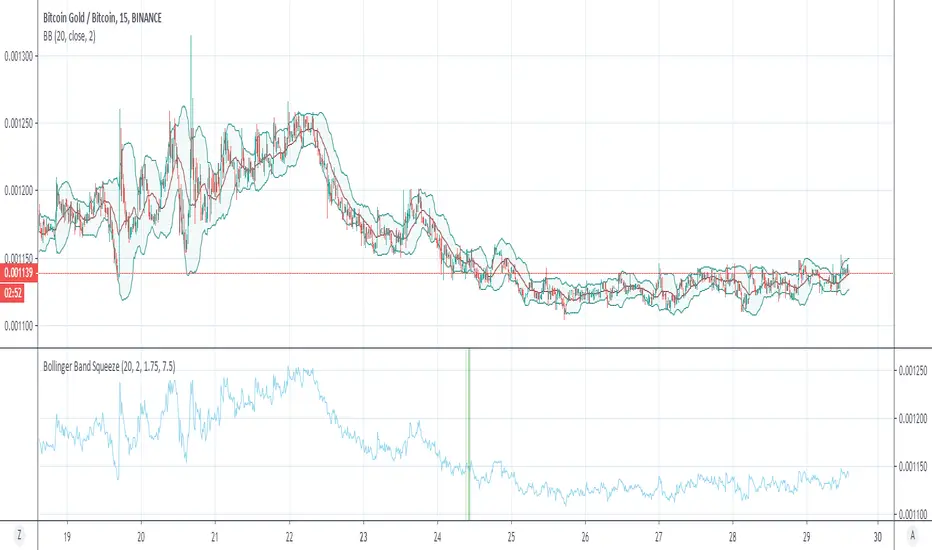
Bollinger Band SqueezeThe Bollinger Band Squeeze is calculated according to the ATR. With the default settings. If the BB width is smaller than the ATR * 2 the background is painted green. If the BB width is larger than the ATR * 5 the background is painted red
Keltner | Bollinger | SqueezePercent B (%B), it's derivation Percent K (%K) and squeeze indicator combined in one.
blue line = bollinger %
orange line = keltner %
red background = squeeze*
squeeze = bollinger bands are inside (encapsulated by) keltner channel

Bollinger Bands Ema 50,200,800EMAs converted to Bollinger Bands The bands are 50, 200 and 800 period, forming a strategy and having clear trends and stronger supports and resistances (when the lines converge the area is stronger).
OBV w/BB+EMAOBV plotted with Bollinger Bands to show whether the volume is breaking out from its normal deviation (both up or down). The OBV changes color depending on the macro trend which is set using a 100 EMA.

Commander IndicatorCommander Multi Indicator
included:
Pioneer EMA
Commander 3MA with MAs cross signal
Double Ichimoku - Kijun Base-Line (26) and Kijun Commander Moving (103)
Parabolic Sar
Bollinger Band
3-Stroke Movings

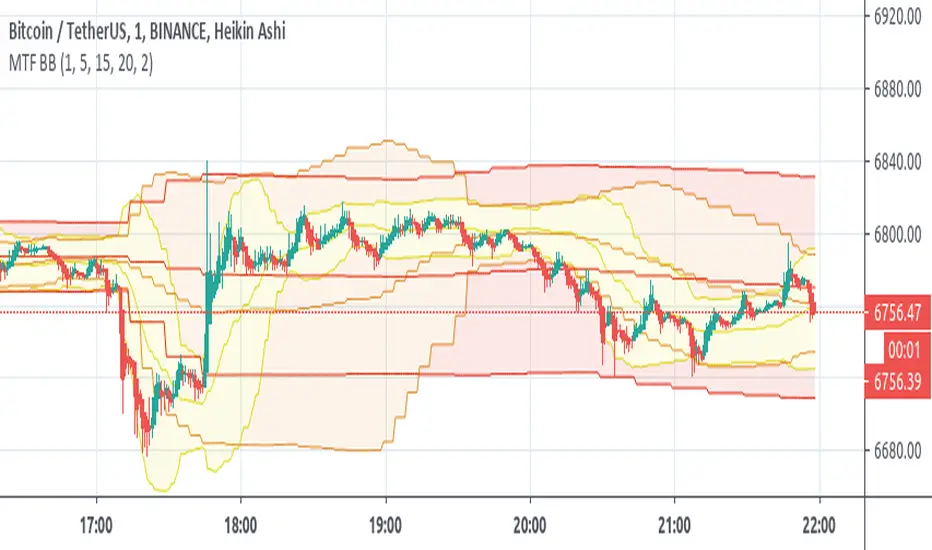
[fikira] Bollinger Bands + Higher Time FramesHere is my take on BB and MTF, based on the most excellent work of
"PineCoders" (MTF Selection Framework functions)!
The big advantage is that on 1 image you can easily see where
price is compared to 5 or less BB Bands (each of different Time Frames).
This gives a lot of Support and Resistance area's!
Includes:
- 1 Bollinger Bands (can be enabled/disabled - "Bollinger Bands"
- 4 Bollinger Bands (each can be enabled/disabled - "HTF Selection 1-4")
Each BB has its colour (can be changed)
- Labels (Timeframe and price) can be enabled/disabled
- Labels position and size can be changed
...

MA&ICH&BBCan be used in any time frame, any market (crypto,stock and FX) and any symbol. Values changeable and turntable on/off.
Include's :
- EMA/MA/WMA
- BB
- ICHIMOKU Kinko Hyo inspired by Kıvanç Özbilgiç

Pivot Boss 4 EMA + BB + Parabolic SAR + IchimokuA combination of a few of my favorite indicators.
1) Pivot Boss 4 EMA
2) Bollinger Bands
3) Parabolic SAR
4) Ichimoku Cloud
All credit to original authors.
