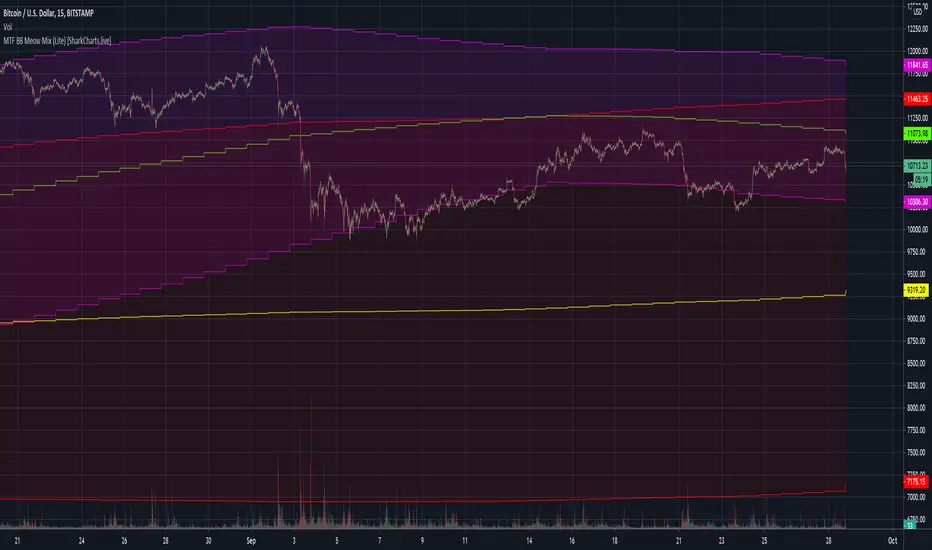
MTF BB Meow Mix (Lite) [acatwithcharts]This script adds multi-timeframe support to BB Meow Mix (Lite).
There is a tradeoff in that there is, to the best of my knowledge, no way to support both MTF and the default band settings menu in the same script, because the security() function in Pinescipt doesn't support variable lookback lengths and trying to plot everything independently instead maxes out the number of plots allowed per script. So, this version of the script doesn't include a menu of defaults.
My volatility indicators are available by subscription in several packages through SharkCharts.live.
Current pricing and subscription details will be kept up-to-date on SharkCharts.live
在腳本中搜尋"bollingerband"
4 Ichimoku Clouds 2 BB by Theo ParkYou can use 4 Ichimoku Clouds and 2 Bollinger Bands with this indicator

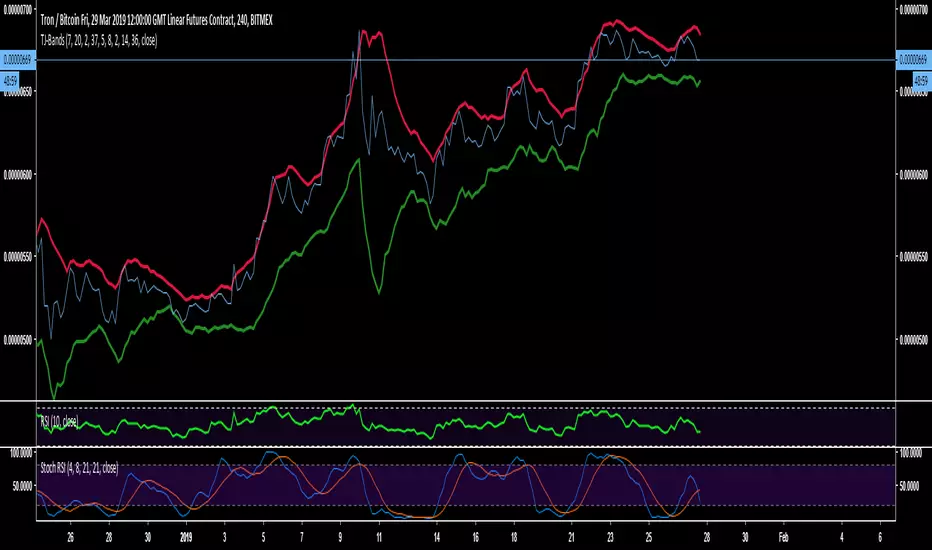
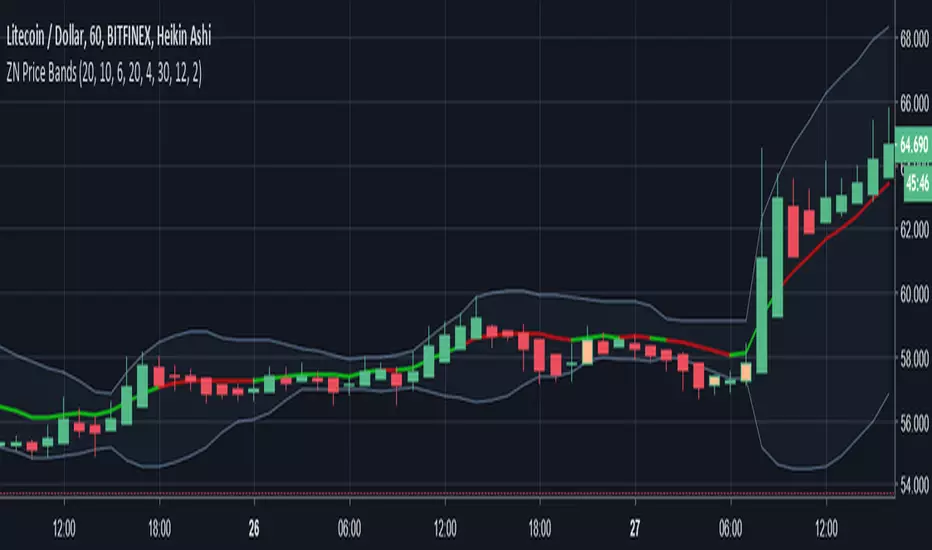
TJ-BandsDo you want to know
This indicator is a modified form of Bollinger Bands.
It works in a similar way like BB does. If you take a look at the "line" chart, you will clearly see, that a close outside these bands is very unlikely and works very well as a rejection line for the chart.
Since, the chart is likely to get rejected at the bands those have been indicated red at the top and green at the bottom.
The use is very simple, add it to your chart and there is nothing more to modify or change.
Like and Follow me and you will find this page interesting because I am a TA expert and professional day trader in crypto since 2012 that does daily updates and new posts about the hottest and most discussed coins.
Cheers, TJ
Bollinger Bands MTF [LonesomeTheBlue]With this script you can follow Bollinger Bands for current and higher time frame together. Higher time frame is calculated by script.
if current period
1m => higher period=5m
3m => higher period=5m
5m => higher period=15m
15m => higher period=1h
30m => higher period=1h
45m => higher period=1h
1h => higher period=4h
2h => higher period=4h
3h => higher period=4h
4h => higher period=1day
1day => higher period=1week


21EMA & Bollinger BandsSimple scalping strategy
Buy/sell on confirmation of price crossing the centre EMA line, price bouncing off the outer bands, or both.

Quad Bollinger BandsSimple quad bollinger band indicator, allowing people without pro subscriptions to apply multiple bb's under one indicator.
Quad Moving Avarage-Ichimoku Cloud-ALMA-Bollinger BandsAll-in-One
Ingradients:
* Ichimoku Cloud,
* 2 Simple Moving Avarage (SMA),
* 2 Exponential Moving Avarage (EMA),
* 2 Arnoud Legoux Moving Avarage (ALMA),
* Bollinger Bands and
* Volume Based Colored Bars (developed by KIVANÇ fr3762).
Compiled for limitations. Thank you.

Chaos Fibonacci Bollinger Bands by ZekisBollinger Bands calculated with a Simple Moving Average and offsets with Fibonacci Retracement values (0.236; 0.382; 0.5; 0.618; 0.784 and 1) for a better support and resistance view, moves and a lot of TA (support and resistance, pivot points, reverse, breakouts...etc)
I colored each part of Fib. to see them clearly
Standard deviation and lenght of BB can be adjusted
Enjoy!
@Zekis

CryptologicxThis script includes the following indicators:
Bollinger Bands
SMA 5 10 20 50 100 200
EMA 14 50 55 100 200
HMA 20 / 50
Ichimoku Cloud
The MA have fixed inputs, if you wish to see different you can contact me.

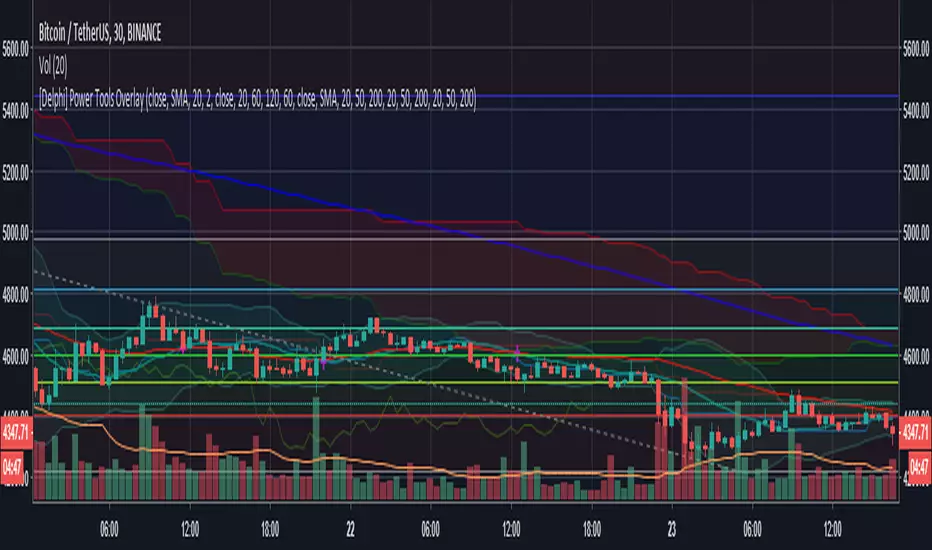
[Delphi] Power Tools OverlayFEATURE
3EMA 3MA 3WMA 3MA-3EMA 3EMA-3WMA 3WMA-3MA
Bollinger Bands
Ichimoku Cloud
//******************************************************************************
// Power Tools Overlay
// Inner Version 1.0 21/11/2018
// Developer: iDelphi
// Developer: astropark (Ichimoku Cloud)
//------------------------------------------------------------------------------
// 21/11/2018 Added EMA MA WMA
// 21/11/2018 Added MA-EMA EMA-WMA WMA-MA (Thanks to mariobros1 for the idea of the Simultaneous MA)
// 21/11/2018 Added Bollinger Bands
// 21/11/2018 Added Ichimoku Cloud (Thanks to astropark for all the code of the Ichimoku Cloud)
//******************************************************************************
SITEKONG ENTRYthis is an indicator to take the position of an entry on this indicator you can choose at a 15 minute time frame for more optimal results. happy trading
Feature
1. Bollinger Band Multiple
2. Auto Support Resistance
3. Trend Analisys With EMA
4. Macd

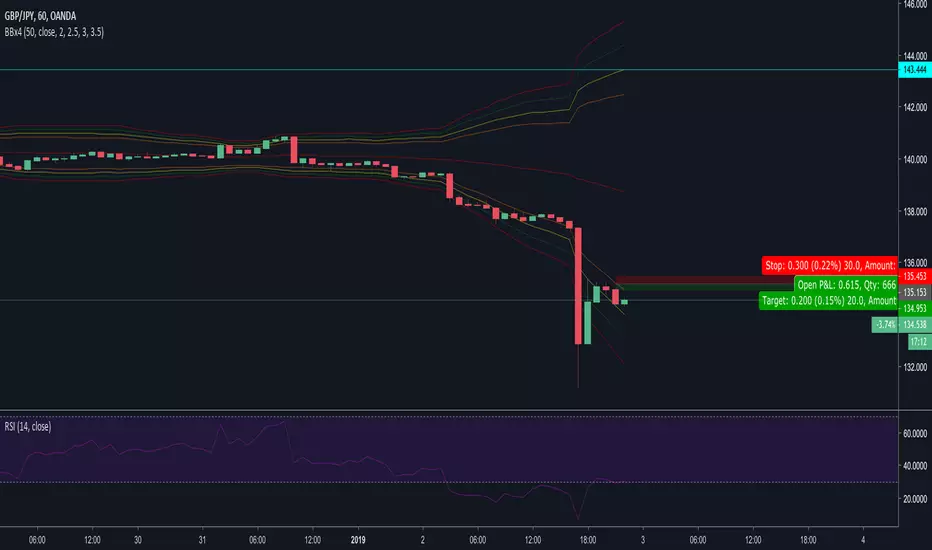
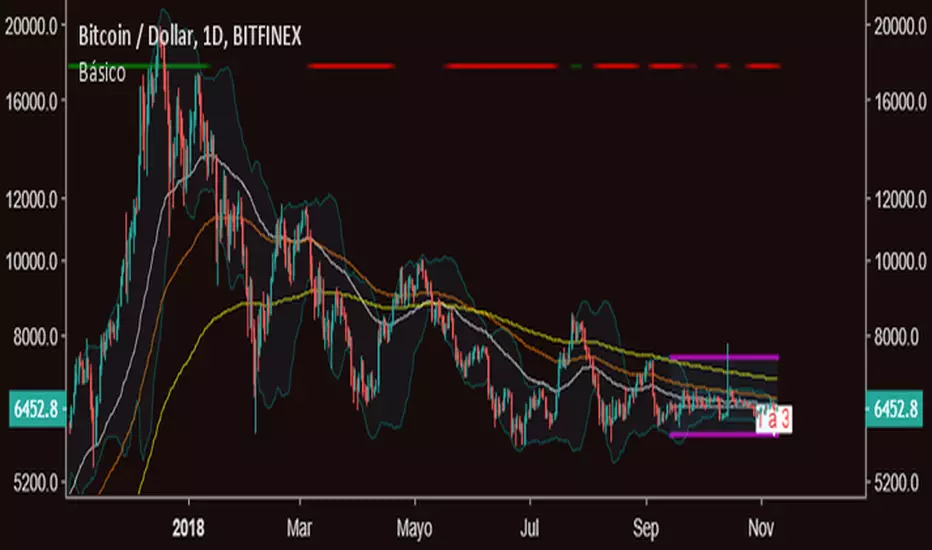
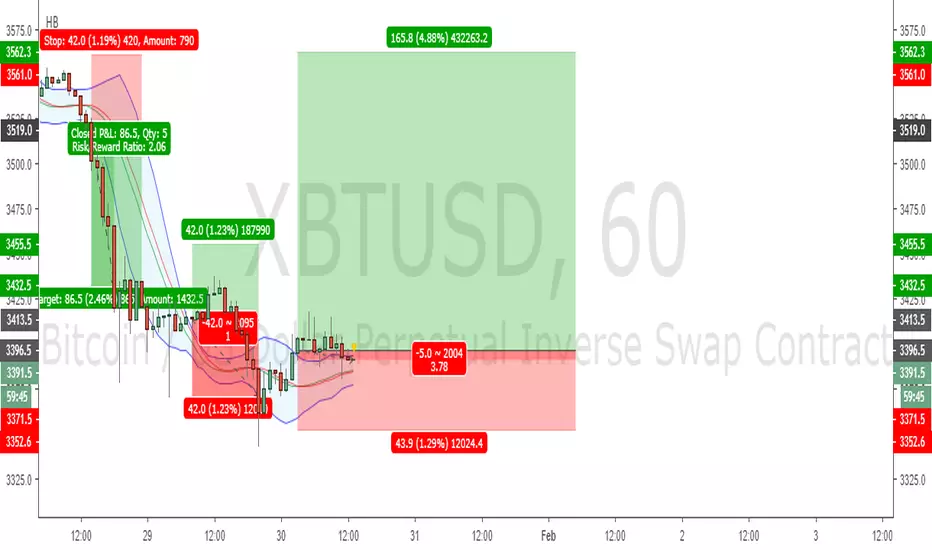
3 in one (BB, 3 MA +) // 3 en 1 (BB, 3 medias moviles, y mas)Version 2 of my previous published script. It allows bollinger bands, 3 moving averages and also it allows to draw entry point, sl and take profit of a single trade in order to track it.
***********************************
Evolución del script anteriormente publicado. Se añaden Bollinger bands y la posibilidad de dibujar los niveles de stop loss, take profit y entrada para una operación en curso. Todas las funciones pueden ser desactivadas. Leer el script para mas información.
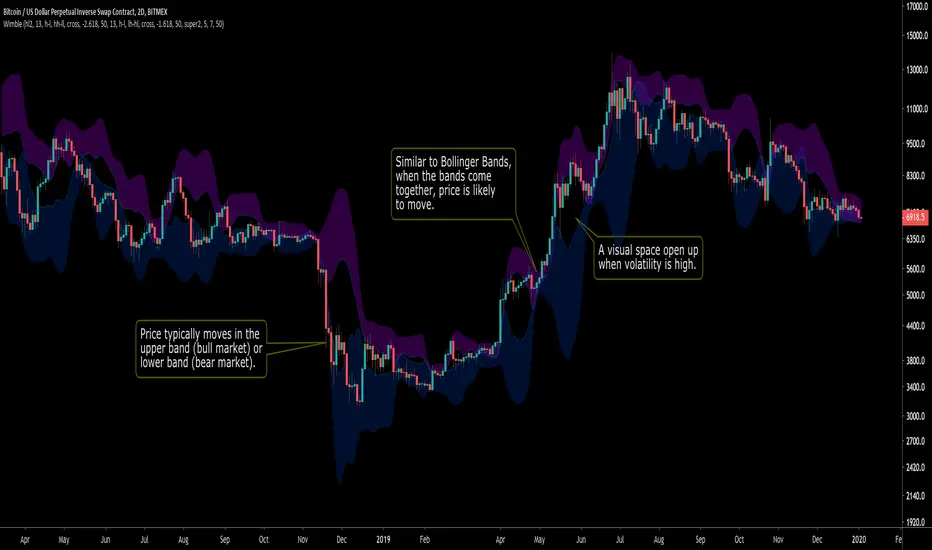
WimbleA standard deviation toolbox. Highly configurable.
Inspired by Bollinger Bands, Wimble creates two bands (from standard deviation) for visually clarity of price movement.
See the comments at the beginning of the script for a complete description.
LeoA451: BBW Double Confirmation v.03 (Signal BBW=black(5/5))This script displays BBW from two periods: a signal period (for which I like to use 5 minutes) and the current period of selected time frame.
- Black BBW - BBW for signal period (5 min/ 5 length/ std_dev 2)
- Blue BBW - for current period (current/ 20 length/ std_dev 2)
You can customise periods and length in the settings option.
Enjoy!
Leave any comments and/or press like button (if you do).

Librehash MV BandThis indicator does not need much of a description, although its utility is very obvious from first glance.
What this indicator is, is essentially a recreation of the Bollinger Bands (w a diff standard deviation calculation for the band formation) that also comes integrated with its own buy and sell signal as well.
This is one of the more valuable indicators out there for any and all traders that are looking to perform a Bollinger's like analysis in a more helpful, compact, and informative manner.
If you are looking to access this indicator, please shoot me a private message on here. This is an invite-only script, so there is a cost associated with the use of this indicator. Price and payment information will be relayed through our chat conversation.
Again, please reach out to me directly through a private message (not via comment to this post) if you have any questions about accessing this indicator.
Thank you.
Ichimoku & 3 BB & Multi MA by Theo Park V1.1.00Ichimoku Cloud
3 Bollinger Bands
Multi Moving Averages
[ProfitTrailer] Bollinger Bands HIGHBB/LOWBB StudyBollinger Bands study for ProfitTrailer.
Supports buy/sell parameters configuration for both LOWBB/HIGHBB strategies.
Highlights regions where trailing is most likely to be fulfilled and buy/sell order placed.

bollingerATR system i mix some codes and made this (some are mine, some i collected in trading view while ago)
I hope you like it
two buy point (big and small green arrow)
3 exit (big and small red and orange arrow
bolinger band and ATR plus bolinger resistance and support level
have fun

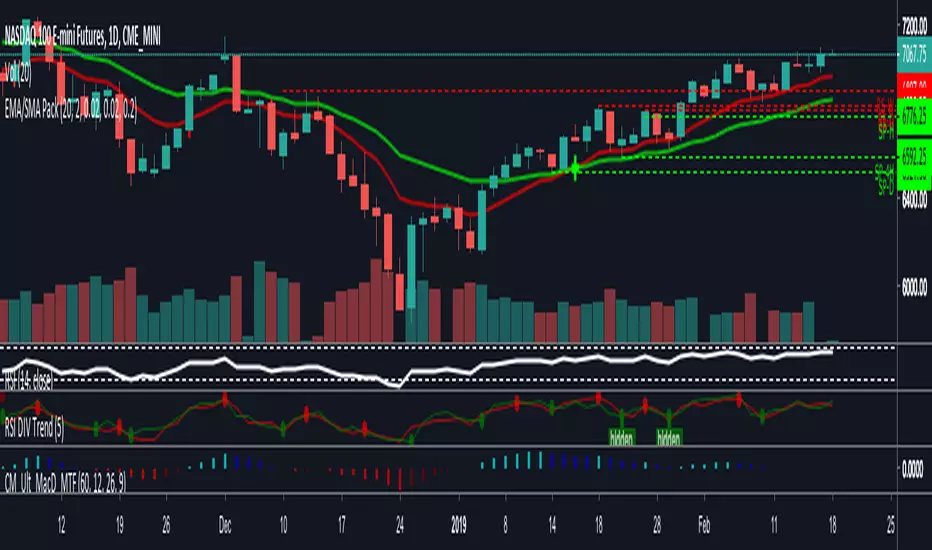
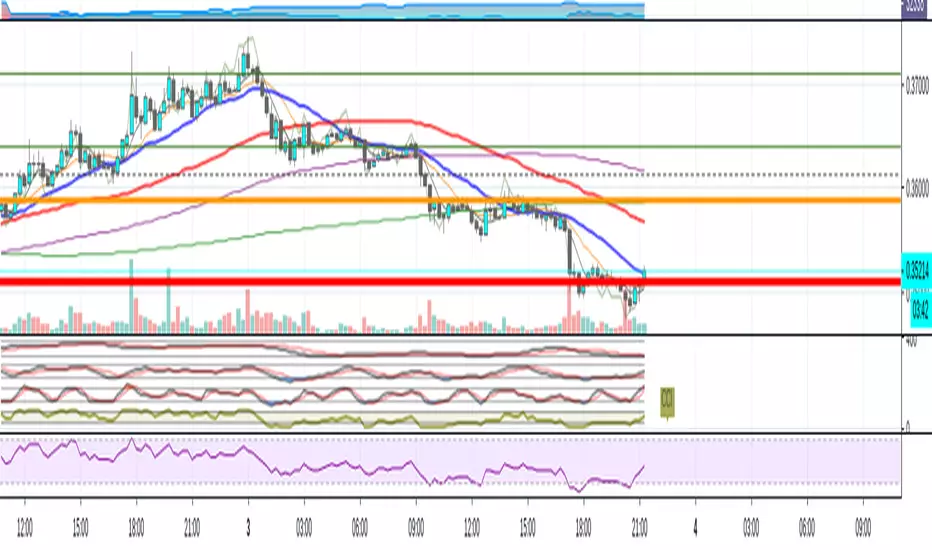
Crypto Day/Swing Trade ComboI've been having some (educational) fun with Pine lately, and wanted to improve the Trading Combo script, so here is my Crypto Day/Swing Trade script.
It's a combination of several indicators, included are:
Bollinger Bands (with 3 bands/StdDev, 2 enabled by default)
(Enhanced) Ichimoku Cloud
Automatic Fibonacci S/R levels
6 Moving Averages
3 Hull Moving Averages
Price Action Bars
Price Divergence Detector
Since Pine is limited to 64 plots, this is all i could get in.
Shout out goes to ChrisMoody, Albert Callisto, 100kiwi, LazyBear, RicardoSantos & JustUncleL for their ideas and (part of) the source code
The script is fully configurable. Use the Inputs tab to enable or disable indicators and use the Styles tab to enable/disable (or configure) specific parts of each indicator.
Happy Trading!
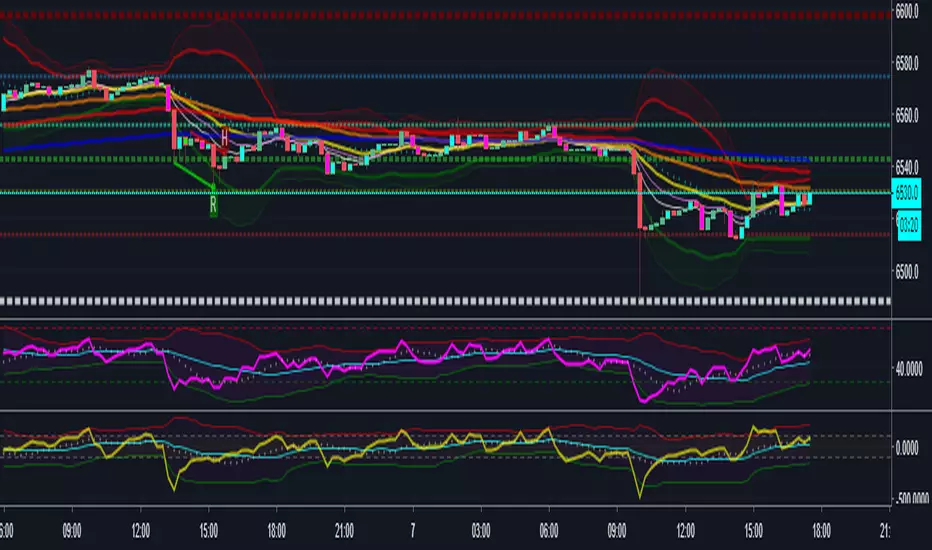
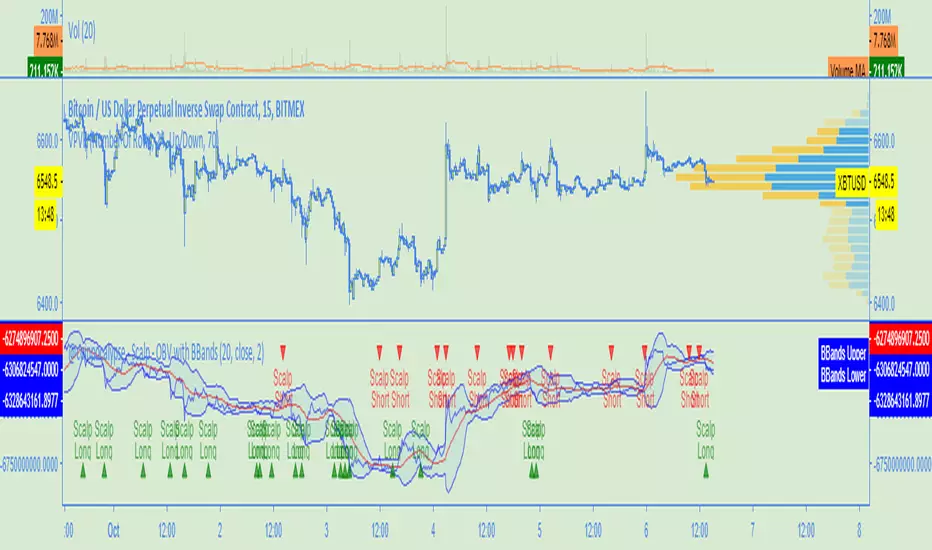
@coinpocalypse - Scalp Script - OBV with BBandsThis is a scalp script for the M15, tested on XBTUSD with good results.
Still some work to do, but easy to use.