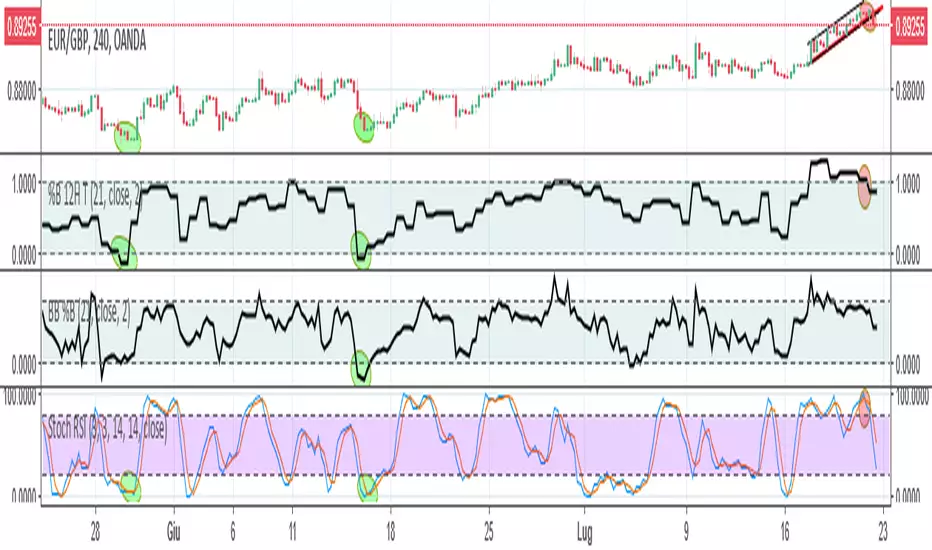
%B 12H THello everyone , I want to share with the comunity my work for look BB %B in a different timeframe without having to change it every time.
I had done to look and study different or multi timeframe a BB %B
I have programmed the script so that it is completely identical to the default one of tradingwiew to simplify its use at all.
I hope this work can be useful to someone else who likes the concept of standard deviation at the base of the bands conceived by Bollinger, but seen as multi timeframe.
在腳本中搜尋"bollingerband"
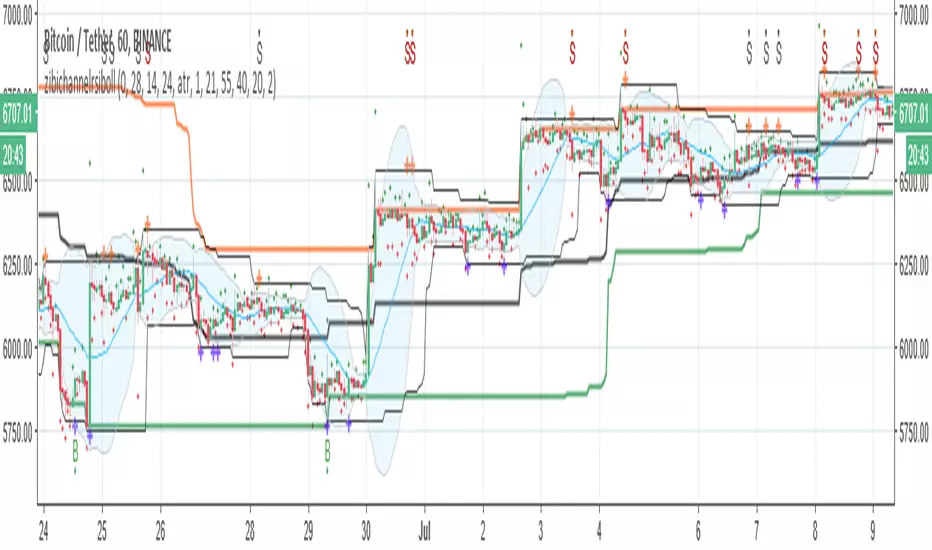
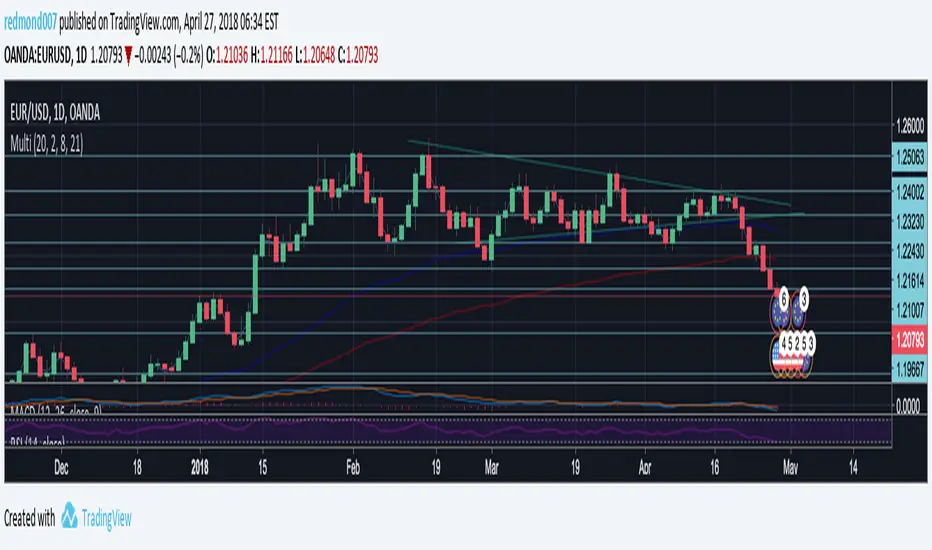
zibichannelrsibollthis version has ATR and RSI and boll combination with zibichannel
the buy point are agreement of ATR Bollinger and RSI (B)
two exit point (red S=agreement of ATR Bollinger and RSI , black S =agreement of ATR Bollinger
alerts inside
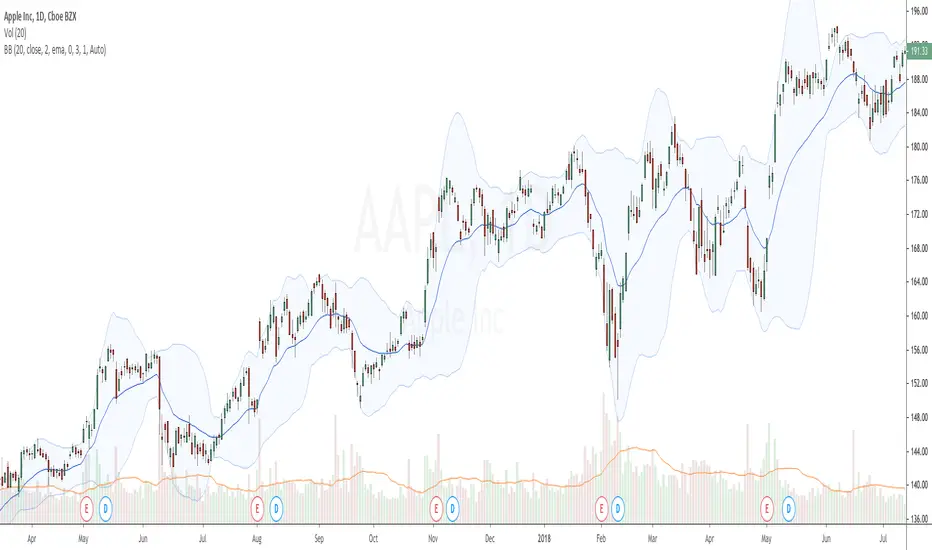
Advanced Bollinger BandsThis is a more advanced version of the standard Bollinger Bands indicator. It allows you to change the type of the moving average (Simple, Exponential, Weighted, Volume-weighted, Triple EMA or a moving average that uses RSI ). The indicator also allows you to volume weight the indicator (turned on by default). If you want to weight the oscillator against the true range instead of volume this is also possible. By default, this will be done automatically for assets that do not support volume .
zibi fib3This is major update to Zibifi2 with addition of vwma fibs in order to remove issue that can happen with regular daily fibs (they sometime send bad signals)
in this version the addition will help to eliminate that effect
major buy points in green and red
minor buy and sell points are in lime and orange
have fun

BAHbO - multi indicators and signals SMA,BB,RSI,Engulfing,Signal4 SMAs - 9,21,55,200
Bollinger Bands - 21
Engulfing patterns
Fractal Support Resistance
Bullish and Bearish Engulfing signals
Engulfing Candles
Bollinger Bands + RSI combined indicator with signals


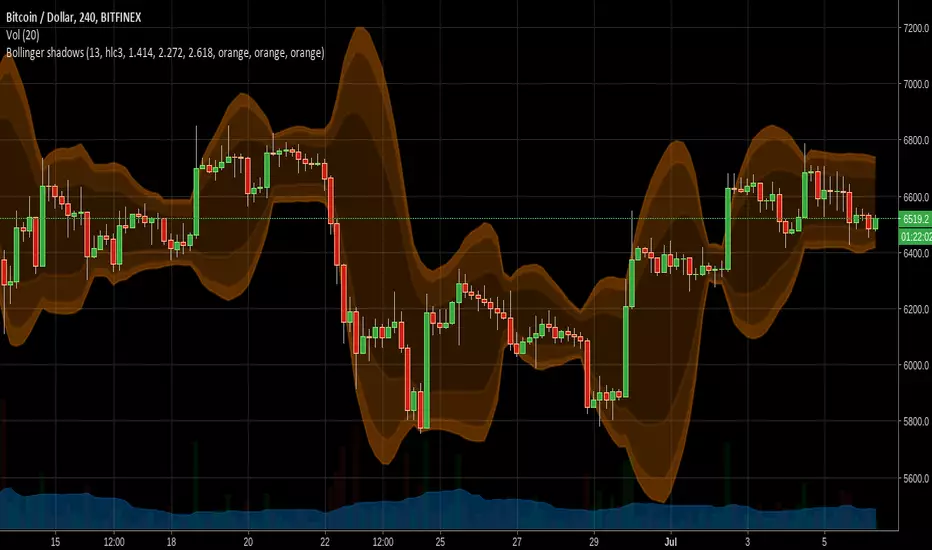
Cooltoyz : Bollinger ShadowsFinally, another gadget for the cooltoyz series :)
this is a simple tool to allow vizualizing bollinger bands with several values/levels. usually boll bands have the levels at 1.5, 2, 3, for multiplier of standadrd deviations. but, just changing those values, we can apply fibbonnaci levels to the bands.
The inputs on this indicator come with fib levels by default, but the values are part of input fields, so it's easy to change to whatever you prefer, back to the calssic std.deviation values, for example. also, the colors are set to make a visual slope, so it's more instinctive to see how strong the candles are moving.
just play with it, and like it. or not :)
here is another example, where the colors are reversed, to create a more classic "shadowy" effect.
i just like to have the edge level set stronger, it's easier to see when stuff is "on fire" :)
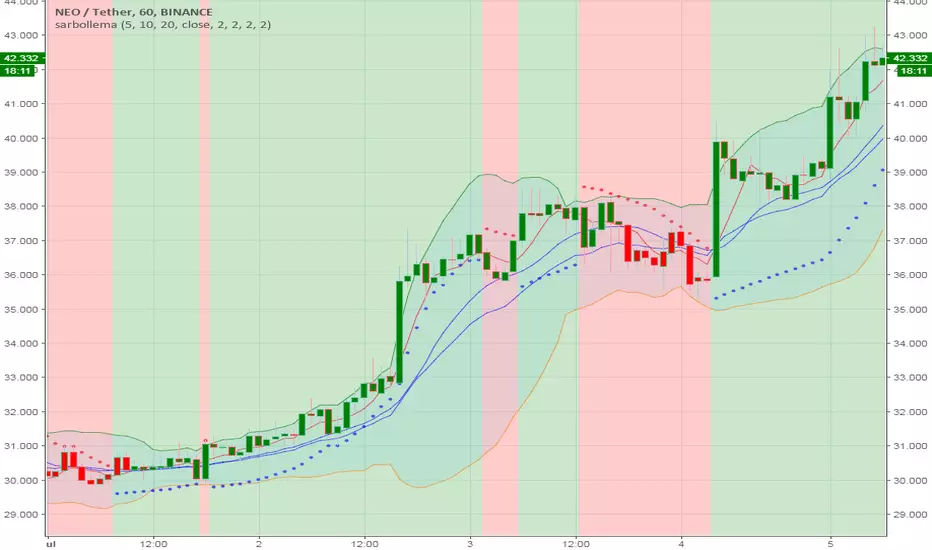
sarbollemaThere is two buy points one based on ema cross MA= long short alert
sar up or down= long1 short1
color change by change of sar
and bollinger to have fun
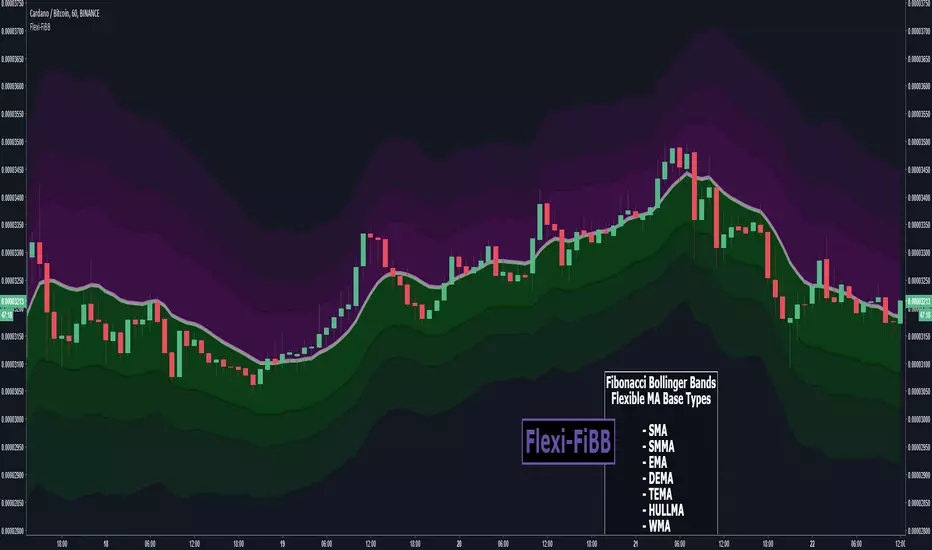
Flexi-FiBBFlexible Fibonacci Bollinger Bands
Colorful 3d Bands displaying Support and Resistance areas based off of Fibonacci Ratios in a customization Bollinger Band.
Choose from vary types of moving average types to get the perfect fit for your trade style.
MA Types Available
- SMA
- SMMA
- EMA
- DEMA
- TEMA
- HULL-MA
- WMA
- VWMA
You can purchase access to this indicator via CryptoProTools
Other recent indicators proving popular among members lately :
[f(x)] Bollinger Donchian RemixThis is my version of a mixture of Bollinger and Donchian (BB/DC Remix)
It is a modified fork of Dolchian/Bollinger Hybrid by Ricardo Santos ( DBH.V0)
this is the two pictures comparing it.
Made this Fork because Santos' code starts getting chopping with my type of settings.
His time input is 24, but mine varies between 13 and 21.
You really notice in scalping and sometimes intraday timeframes with my settings.
His also differ from mine based on the trendline, where he modifies his Simple Moving Average, which is default color is black, and I use the the default one, which the default color is red.
Also you can change the trendline type input (open,close,hl2,etc...) to tailor your preference.
Note: Default is close, Santos use hl2, I use ohlc4.

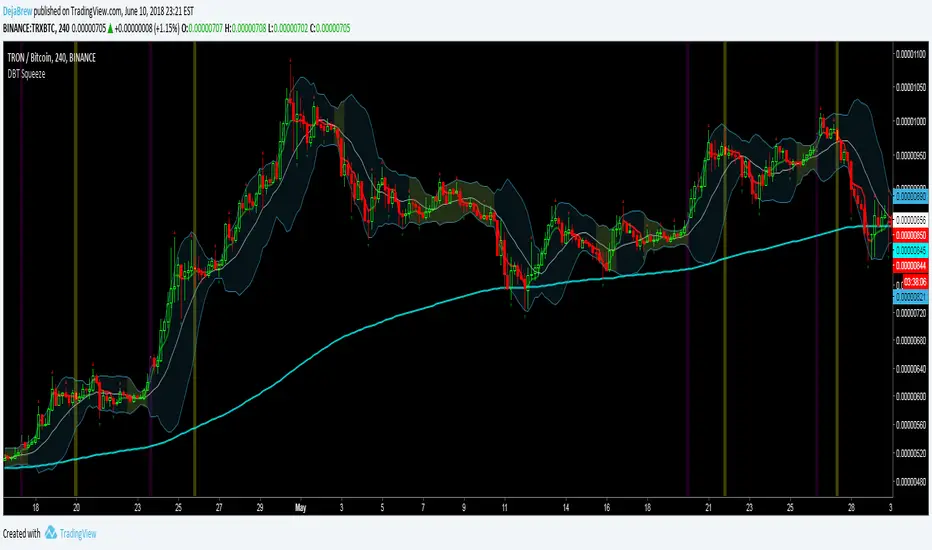
DBT SqueezeThe DejaBrew Trading Squeeze is an indicator designed over years of trading volatility. It uses Bollinger Bands to determine areas of low volatility, signified by the yellow shading of the squeeze. Then it takes into account CCI values to determine a breakout incoming. This indicator also has VWAP, 200 ema, and Williams Fractals built in.
To use this indicator first determine a time frame that does not give a large amount of signals (it was designed to work best on the 5min but has been tested and works great on all time frames above 5min). Once a time frame is determined then look for Bollinger Band squeezes signified by yellow shading. Once the squeeze is determined wait for a purple or blue buy candle to signal (purple are stronger signals). Once a buy candle has signaled evaluate price action, if bullish and supported by other indicators then either take an aggressive entry on the buy candle or wait for a pullback no greater than 50% of the buy candle. Once your position has been established place a stop loss at 1% or below the 200ema and VWAP if possible, no greater than 3% is recommended. Target a 3% gain or wait for the Yellow Sell Candle to close most or all of your position.
Do not take buy candles in extremely bearish markets. Purple Buy Candles are much stronger than blue because they are above the 200ema signifying a bullish trend. Do not take every buy candle if market is choppy and giving a lot of signals. Pair this indicator with a Commodity Channel Index (50) for the best signals. When the CCI is stable and not choppy the buy candles will be much more accurate. Do not take buy candles if the CCI is very choppy.
Use at your own risk. This is not financial advise and this indicator is not guaranteed to make you profits. Please message me if you have any questions or feedback. Enjoy.
DO NOT ASK FOR ACCESS. THIS INDICATOR WILL BE AVAILABLE ON MY WEBSITE ONCE IT RELEASES.
Projecting From Stability & Low RSIStable periods that are projected can be found using Bollinger Band Percent Width Crossing historically low RSI.

Projecting From StabilityStable periods that are projected can be found using Bollinger Band Percent Width Crossing RSI
The projected periods are paying most attention to the drop in % BBand width.


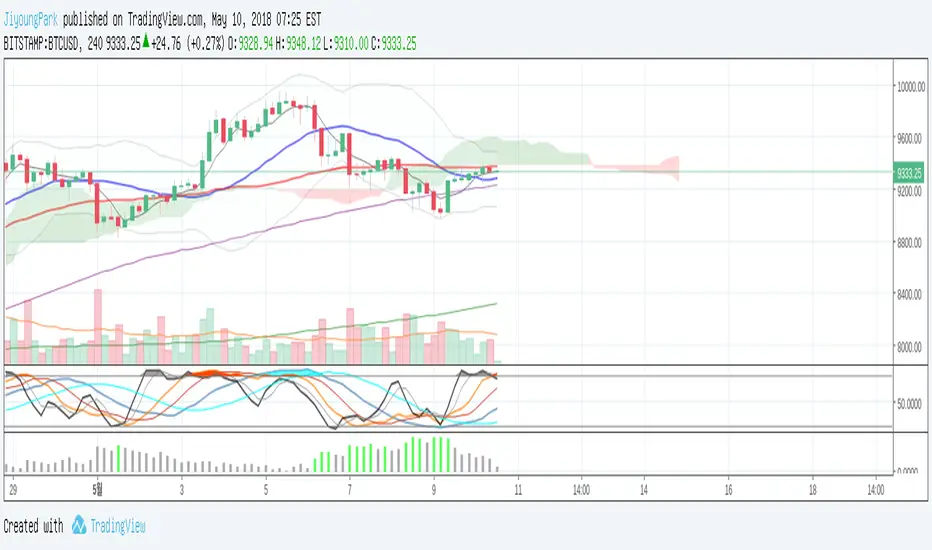
Moving Averagies & Ichimoku & Bollinger Band by Theo ParkThis indicator has
- 5 Moving Averagies (5, 20, 60, 120, 240)
- Ichimoku Cloud
- Bollinger Band

CM_MA_BBA combination of ChrisMoody's CM_Ultimate_MA_MTF_V2 and Bollinger Bands put together by request.
CM:

Stash AlertsUses Bollinger Bands and RSI.
Can be used with AutoView.
Get Access here: www.patreon.com

BB %B + Woodies CCIBB %B + Woodies CCI
Divergnece of Bollinger bands and Divegence of CCI look very similar.
This is an indicator of the similar size of the Bollinger Band & B and Woodis CCI.

Multi Indicators v1 - 20 50 200 EMA/SMA, Bollinger Bands, VWAPMulti Indicators v1
20 50 200 EMA/SMA, Bollinger Bands, VWAP
These can be turned on and off
I'll be adding to this multi indicator in future updates
RSI Bollinger BandsThis RSI indicator has a Bollinger Bands indicator around it, and a simple moving average.
I still haven't decided yet if the Bollinger Bands should be at 20 (like normal) or at 14 (like the RSI).
Experiment with it and have fun :)

4EMA (8,13,21,55) + Bollinger BandsFive indicators in one.
4 Moving Average Exponential : 8, 13, 21, 55 - as per @Philakone strategy
Bollinger Bands
Check out my other scripts for RSI and Stoch RSI all in one, and 4EMA + Death Cross + Bollinger Bands.
