Soul Button Scalping (1 min chart) V 1.0Indicator Description
- P Signal: The foundational buy signal. It should be confirmed by observing RSI divergence on the 1-minute chart.
- Green, Orange, and Blue Signals: Three buy signals generated through the combination of multiple oscillators. These signals should also be cross-referenced with the RSI on the 1-minute chart.
- Big White and Big Yellow Signals: These represent strong buy signals, triggered in extreme oversold conditions.
- BEST BUY Signal: The most reliable and powerful buy signal available in this indicator.
____________
Red Sell Signal: A straightforward sell signal indicating potential overbought conditions.
____________
Usage Guidance
This scalping indicator is specifically designed for use on the 1-minute chart, incorporating data from the 5-minute chart for added context. It is most effective when used in conjunction with:
• VWAP (Volume Weighted Average Price), already included in the indicator.
• RSI on the 1-minute chart, which should be opened as a separate indicator.
• Trendlines, structure breakouts, and price action analysis to confirm signals.
Intended for Crypto Scalping:
The indicator is optimized for scalping cryptocurrency markets.
____________
Future Enhancements:
• Integration of price action and candlestick patterns.
• A refined version tailored for trading futures contracts, specifically ES and MES in the stock market.
在腳本中搜尋"bollingerband"

Williams BBDiv Signal [trade_lexx]📈 Williams BBDiv Signal — Improve your trading strategy with accurate signals!
Introducing Williams BBDiv Signal , an advanced trading indicator designed for a comprehensive analysis of market conditions. This indicator combines Williams%R with Bollinger Bands, providing traders with a powerful tool for generating buy and sell signals, as well as detecting divergences. It is ideal for traders who need an advantage in detecting changing trends and market conditions.
🔍 How signals work
— A buy signal is generated when the Williams %R line crosses the lower Bollinger Bands band from bottom to top. This indicates that the market may be oversold and ready for a rebound. They are displayed as green triangles located under the Williams %R graph. On the main chart, buy signals are displayed as green triangles labeled "Buy" under candlesticks.
— A sell signal is generated when the Williams %R line crosses the upper Bollinger Bands band from top to bottom. This indicates that the market may be overbought and ready for a correction. They are displayed as red triangles located above the Williams %R chart. On the main chart, the sell signals are displayed as red triangles with the word "Sell" above the candlesticks.
— Minimum Bars Between Signals
The user can adjust the minimum number of bars between the signals to avoid false signals. This helps to filter out noise and improve signal quality.
— Mode "Wait for Opposite Signal"
In this mode, buy and sell signals are generated only after receiving the opposite signal. This adds an additional level of filtering and helps to avoid false alarms.
— Mode "Overbought and Oversold Zones"
A buy signal is generated only when Williams %R is below the -80 level (Lower Band). A sell signal is generated only when Williams %R is above -20 (Upper Band).
📊 Divergences
— Bullish divergence occurs when Williams%R shows a higher low while price shows a lower low. This indicates a possible upward reversal. They are displayed as green lines and labels labeled "Bull" on the Williams %R chart. On the main chart, bullish divergences are displayed as green triangles labeled "Bull" under candlesticks.
— A bearish divergence occurs when Williams %R shows a lower high, while the price shows a higher high. This indicates a possible downward reversal. They are displayed as red lines and labels labeled "Bear" on the Williams %R chart. On the main chart, bearish divergences are displayed as red triangles with the word "Bear" above the candlesticks.
— 🔌Connector Signal🔌 and 🔌Connector Divergence🔌
It allows you to connect the indicator to trading strategies and test signals throughout the trading history. This makes the indicator an even more powerful tool for traders who want to test the effectiveness of their strategies on historical data.
🔔 Alerts
The indicator provides the ability to set up alerts for buy and sell signals, as well as for divergences. This allows traders to keep abreast of important market developments without having to constantly monitor the chart.
🎨 Customizable Appearance
Customize the appearance of Williams BBDiv Signal according to your preferences to make the analysis more convenient and visually pleasing. In the indicator settings section, you can change the colors of the buy and sell signals, as well as divergences, so that they stand out on the chart and are easily visible.
🔧 How it works
— The indicator starts by calculating the Williams %R and Bollinger Bands values for a certain period to assess market conditions. Initial assumptions are introduced for overbought and oversold levels, as well as for the standard deviation of the Bollinger Bands. The indicator then analyzes these values to generate buy and sell signals. This classification helps to determine the appropriate level of volatility for signal calculation. As the market evolves, the indicator dynamically adjusts, providing information about the trend and volatility in real time.
Quick Guide to Using Williams BBDiv Signal
— Add the indicator to your favorites by clicking on the star icon. Adjust the parameters, such as the period length for Williams %R, the type of moving average and the standard deviation for Bollinger Bands, according to your trading style. Or leave all the default settings.
— Adjust the signal filters to improve the quality of the signals and avoid false alarms, adjust the filters in the "Signal Settings" section.
— Turn on alerts so that you don't miss important trading opportunities and don't constantly sit at the chart, set up alerts for buy and sell signals, as well as for divergences. This will allow you to keep abreast of all key market developments and respond to them in a timely manner, without being distracted from other business.
— Use signals. They will help you determine the optimal entry and exit points for your positions. Also, pay attention to bullish and bearish divergences, which may indicate possible market reversals and provide additional trading opportunities.
— Use the 🔌Connector🔌 for deeper analysis and verification of the effectiveness of signals, connect it to your trading strategies. This will allow you to test signals throughout the trading history and evaluate their accuracy based on historical data. Include the indicator in your trading strategy and run testing to see how buy and sell signals have worked in the past. Analyze the test results to determine how reliable the signals are and how they can improve your trading strategy. This will help you make better informed decisions and increase your trading efficiency.

Uptrick: Smart BoundariesThis script is an indicator that combines the RSI (Relative Strength Index) and Bollinger Bands to highlight potential points where price momentum and volatility may both be at extreme levels. Below is a detailed explanation of its components, how it calculates signals, and why these two indicators have been merged into one tool. This script is intended solely for educational purposes and for traders who want to explore the combined use of momentum and volatility measures. Please remember that no single indicator guarantees profitable results.
Purpose of This Script
This script is designed to serve as a concise, all-in-one tool for traders seeking to track both momentum and volatility extremes in real time. By overlaying RSI signals with Bollinger Band boundaries, it helps users quickly identify points on a chart where price movement may be highly stretched. The goal is to offer a clearer snapshot of potential overbought or oversold conditions without requiring two separate indicators. Additionally, its optional pyramiding feature enables users to manage how many times they initiate trades when signals repeat in the same direction. Through these combined functions, the script aims to streamline technical analysis by consolidating two popular measures—momentum via RSI and volatility via Bollinger Bands—into a single, manageable interface.
1. Why Combine RSI and Bollinger Bands
• RSI (Relative Strength Index): This is a momentum oscillator that measures the speed and magnitude of recent price changes. It typically ranges between 0 and 100. Traders often watch for RSI crossing into “overbought” or “oversold” levels because it may indicate a potential shift in momentum.
• Bollinger Bands: These bands are plotted around a moving average, using a standard deviation multiplier to create an upper and lower boundary. They help illustrate how volatile the price has been relative to its recent average. When price moves outside these boundaries, some traders see it as a sign the price may be overstretched and could revert closer to the average.
Combining these two can be useful because it blends two different perspectives on market movement. RSI attempts to identify momentum extremes, while Bollinger Bands track volatility extremes. By looking for moments when both conditions agree, the script tries to highlight points where price might be unusually stretched in terms of both momentum and volatility.
2. How Signals Are Generated
• Buy Condition:
- RSI dips below a specified “oversold” level (for example, 30 by default).
- Price closes below the lower Bollinger Band.
When these occur together, the script draws a label indicating a potential bullish opportunity. The underlying reasoning is that momentum (RSI) suggests a stronger-than-usual sell-off, and price is also stretched below the lower Bollinger Band.
• Sell Condition:
- RSI rises above a specified “overbought” level (for example, 70 by default).
- Price closes above the upper Bollinger Band.
When these occur together, a label is plotted for a potential bearish opportunity. The rationale is that momentum (RSI) may be overheated, and the price is trading outside the top of its volatility range.
3. Pyramiding Logic and Trade Count Management
• Pyramiding refers to taking multiple positions in the same direction when signals keep firing. While some traders prefer just one position per signal, others like to scale into a trade if the market keeps pushing in their favor.
• This script uses variables that keep track of how many recent buy or sell signals have fired. If the count reaches a user-defined maximum, no more signals of that type will trigger additional labels. This protects traders from over-committing to one direction if the market conditions remain “extreme” for a prolonged period.
• If you disable the pyramiding feature, the script will only plot one label per side until the condition resets (i.e., until RSI and price conditions are no longer met).
4. Labels and Visual Feedback
• Whenever a buy or sell condition appears, the script plots a label directly on the chart:
- Buy labels under the price bar.
- Sell labels above the price bar.
These labels make it easier to review where both RSI and Bollinger Band conditions align. It can be helpful for visually scanning the chart to see if the signals show any patterns related to market reversals or trend continuations.
• The Bollinger Bands themselves are plotted so traders can see when the price is approaching or exceeding the upper or lower band. Watching the RSI and Bollinger Band plots simultaneously can give traders more context for each signal.
5. Originality and Usefulness
This script provides a distinct approach by merging two well-established concepts—RSI and Bollinger Bands—within a single framework, complemented by optional pyramiding controls. Rather than using each indicator separately, it attempts to uncover moments when momentum signals from RSI align with volatility extremes highlighted by Bollinger Bands. This combined perspective can aid in spotting areas of possible overextension in price. Additionally, the built-in pyramiding mechanism offers a method to manage multiple signals in the same direction, allowing users to adjust how aggressively they scale into trades. By integrating these elements together, the script aims to deliver a tool that caters to diverse trading styles while remaining straightforward to configure and interpret.
6. How to Use the Indicator
• Configure the Inputs:
- RSI Length (the lookback period used for the RSI calculation).
- RSI Overbought and Oversold Levels.
- Bollinger Bands Length and Multiplier (defines the moving average period and the degree of deviation).
- Option to reduce pyramiding.
• Set Alerts (Optional):
- You can create TradingView alerts for when these conditions occur, so you do not have to monitor the chart constantly. Choose the buy or sell alert conditions in your alert settings.
• Integration in a Trading Plan:
- This script alone is not a complete trading system. Consider combining it with other forms of analysis, such as support and resistance, volume profiles, or candlestick patterns. Thorough research, testing on historical data, and risk management are always recommended.
7. No Performance Guarantees
• This script does not promise any specific trading results. It is crucial to remember that no single indicator can accurately predict future market movements all the time. The script simply tries to highlight moments when two well-known indicators both point to an extreme condition.
• Actual trading decisions should factor in a range of market information, including personal risk tolerance and broader market conditions.
8. Purpose and Limitations
• Purpose:
- Provide a combined view of momentum (RSI) and volatility (Bollinger Bands) in a single script.
- Assist in spotting times when price may be at an extreme.
- Offer a configurable system for labeling potential buy or sell points based on these extremes.
• Limitations:
- Overbought and oversold conditions can persist for an extended period in trending markets.
- Bollinger Band breakouts do not always result in immediate reversals. Sometimes price keeps moving in the same direction.
- The script does not include a built-in exit strategy or risk management rules. Traders must handle these themselves.
Additional Disclosures
This script is published open-source and does not rely on any external or private libraries. It does not use lookahead methods or repaint signals; all calculations are performed on the current bar without referencing future data. Furthermore, the script is designed for standard candlestick or bar charts rather than non-standard chart types (e.g., Heikin Ashi, Renko). Traders should keep in mind that while the script can help locate potential momentum and volatility extremes, it does not include an exit strategy or account for factors like slippage or commission. All code comes from built-in Pine Script functions and standard formulas for RSI and Bollinger Bands. Anyone reviewing or modifying this script should exercise caution and incorporate proper risk management when applying it to their own trading.
Calculation Details
The script computes RSI by examining a user-defined number of prior bars (the RSI Length) and determining the average of up-moves relative to the average of down-moves over that period. This ratio is then scaled to a 0–100 range, so lower values typically indicate stronger downward momentum, while higher values suggest stronger upward momentum. In parallel, Bollinger Bands are generated by first calculating a simple moving average (SMA) of the closing price for the user-specified length. The script then measures the standard deviation of closing prices over the same period and multiplies it by the chosen factor (the Bollinger Bands Multiplier) to form the upper and lower boundaries around the SMA. These two measures are checked in tandem: if the RSI dips below a certain oversold threshold and price trades below the lower Bollinger Band, a condition is met that may imply a strong short-term sell-off; similarly, if the RSI surpasses the overbought threshold and price rises above the upper Band, it may indicate an overextended move to the upside. The pyramiding counters track how many of these signals occur in sequence, preventing excessive stacking of labels on the chart if conditions remain extreme for multiple bars.
Conclusion
This indicator aims to provide a more complete view of potential market extremes by overlaying the RSI’s momentum readings on top of Bollinger Band volatility signals. By doing so, it attempts to help traders see when both indicators suggest that the market might be oversold or overbought. The optional reduced pyramiding logic further refines how many signals appear, giving users the choice of a single entry or multiple scaling entries. It does not claim any guaranteed success or predictive power, but rather serves as a tool for those wanting to explore this combined approach. Always be cautious and consider multiple factors before placing any trades.

RSI and Bollinger Bands Screener [deepakks444]Indicator Overview
The indicator is designed to help traders identify potential long signals by combining the Relative Strength Index (RSI) and Bollinger Bands across multiple timeframes. This combination allows traders to leverage the strengths of both indicators to make more informed trading decisions.
Understanding RSI
What is RSI?
The Relative Strength Index (RSI) is a momentum oscillator that measures the speed and change of price movements. Developed by J. Welles Wilder Jr. for stocks and forex trading, the RSI is primarily used to identify overbought or oversold conditions in an asset.
How RSI Works:
Calculation: The RSI is calculated using the average gains and losses over a specified period, typically 14 periods.
Range: The RSI oscillates between 0 and 100.
Interpretation:
Key Features of RSI:
Momentum Indicator: RSI helps identify the momentum of price movements.
Divergences: RSI can show divergences, where the price makes a higher high, but the RSI makes a lower high, indicating potential reversals.
Trend Identification: RSI can also help identify trends. In an uptrend, the RSI tends to stay above 50, and in a downtrend, it tends to stay below 50.
Understanding Bollinger Bands
What is Bollinger Bands?
Bollinger Bands are a type of trading band or envelope plotted two standard deviations (positively and negatively) away from a simple moving average (SMA) of a price. Developed by financial analyst John Bollinger, Bollinger Bands consist of three lines:
Upper Band: SMA + (Standard Deviation × Multiplier)
Middle Band (Basis): SMA
Lower Band: SMA - (Standard Deviation × Multiplier)
How Bollinger Bands Work:
Volatility Measure: Bollinger Bands measure the volatility of the market. When the bands are wide, it indicates high volatility, and when the bands are narrow, it indicates low volatility.
Price Movement: The price tends to revert to the mean (middle band) after touching the upper or lower bands.
Support and Resistance: The upper and lower bands can act as dynamic support and resistance levels.
Key Features of Bollinger Bands:
Volatility Indicator: Bollinger Bands help traders understand the volatility of the market.
Mean Reversion: Prices tend to revert to the mean (middle band) after touching the bands.
Squeeze: A Bollinger Band Squeeze occurs when the bands narrow significantly, indicating low volatility and a potential breakout.
Combining RSI and Bollinger Bands
Strategy Overview:
The strategy aims to identify potential long signals by combining RSI and Bollinger Bands across multiple timeframes. The key conditions are:
RSI Crossing Above 60: The RSI should cross above 60 on the 15-minute timeframe.
RSI Above 60 on Higher Timeframes: The RSI should already be above 60 on the hourly and daily timeframes.
Price Above 20MA or Walking on Upper Bollinger Band: The price should be above the 20-period moving average of the Bollinger Bands or walking on the upper Bollinger Band.
Strategy Details:
RSI Calculation:
Calculate the RSI for the 15-minute, 1-hour, and 1-day timeframes.
Check if the RSI crosses above 60 on the 15-minute timeframe.
Ensure the RSI is above 60 on the 1-hour and 1-day timeframes.
Bollinger Bands Calculation:
Calculate the Bollinger Bands using a 20-period moving average and 2 standard deviations.
Check if the price is above the 20-period moving average or walking on the upper Bollinger Band.
Entry and Exit Signals:
Long Signal: When all the above conditions are met, consider a long entry.
Exit: Exit the trade when the price crosses below the 20-period moving average or the stop-loss is hit.
Example Usage
Setup:
Add the indicator to your TradingView chart.
Configure the inputs as per your requirements.
Monitoring:
Look for the long signal on the chart.
Ensure that the RSI is above 60 on the 15-minute, 1-hour, and 1-day timeframes.
Check that the price is above the 20-period moving average or walking on the upper Bollinger Band.
Trading:
Enter a long position when the criteria are met.
Set a stop-loss below the low of the recent 15-minute candle or based on your risk management rules.
Monitor the trade and exit when the RSI returns below 60 on any of the timeframes or when the price crosses below the 20-period moving average.
House Rules Compliance
No Financial Advice: This strategy is for educational purposes only and should not be construed as financial advice.
Risk Management: Always use proper risk management techniques, including stop-loss orders and position sizing.
Past Performance: Past performance is not indicative of future results. Always conduct your own research and analysis.
TradingView Guidelines: Ensure that any shared scripts or strategies comply with TradingView's terms of service and community guidelines.
Conclusion
This strategy combines RSI and Bollinger Bands across multiple timeframes to identify potential long signals. By ensuring that the RSI is above 60 on higher timeframes and that the price is above the 20-period moving average or walking on the upper Bollinger Band, traders can make more informed decisions. Always remember to conduct thorough research and use proper risk management techniques.

DCA Strategy with Mean Reversion and Bollinger BandDCA Strategy with Mean Reversion and Bollinger Band
The Dollar-Cost Averaging (DCA) Strategy with Mean Reversion and Bollinger Bands is a sophisticated trading strategy that combines the principles of DCA, mean reversion, and technical analysis using Bollinger Bands. This strategy aims to capitalize on market corrections by systematically entering positions during periods of price pullbacks and reversion to the mean.
Key Concepts and Principles
1. Dollar-Cost Averaging (DCA)
DCA is an investment strategy that involves regularly purchasing a fixed dollar amount of an asset, regardless of its price. The idea behind DCA is that by spreading out investments over time, the impact of market volatility is reduced, and investors can avoid making large investments at inopportune times. The strategy reduces the risk of buying all at once during a market high and can smooth out the cost of purchasing assets over time.
In the context of this strategy, the Investment Amount (USD) is set by the user and represents the amount of capital to be invested in each buy order. The strategy executes buy orders whenever the price crosses below the lower Bollinger Band, which suggests a potential market correction or pullback. This is an effective way to average the entry price and avoid the emotional pitfalls of trying to time the market perfectly.
2. Mean Reversion
Mean reversion is a concept that suggests prices will tend to return to their historical average or mean over time. In this strategy, mean reversion is implemented using the Bollinger Bands, which are based on a moving average and standard deviation. The lower band is considered a potential buy signal when the price crosses below it, indicating that the asset has become oversold or underpriced relative to its historical average. This triggers the DCA buy order.
Mean reversion strategies are popular because they exploit the natural tendency of prices to revert to their mean after experiencing extreme deviations, such as during market corrections or panic selling.
3. Bollinger Bands
Bollinger Bands are a technical analysis tool that consists of three lines:
Middle Band: The moving average, usually a 200-period Exponential Moving Average (EMA) in this strategy. This serves as the "mean" or baseline.
Upper Band: The middle band plus a certain number of standard deviations (multiplier). The upper band is used to identify overbought conditions.
Lower Band: The middle band minus a certain number of standard deviations (multiplier). The lower band is used to identify oversold conditions.
In this strategy, the Bollinger Bands are used to identify potential entry points for DCA trades. When the price crosses below the lower band, this is seen as a potential opportunity for mean reversion, suggesting that the asset may be oversold and could reverse back toward the middle band (the EMA). Conversely, when the price crosses above the upper band, it indicates overbought conditions and signals potential market exhaustion.
4. Time-Based Entry and Exit
The strategy has specific entry and exit points defined by time parameters:
Open Date: The date when the strategy begins opening positions.
Close Date: The date when all positions are closed.
This time-bound approach ensures that the strategy is active only during a specified window, which can be useful for testing specific market conditions or focusing on a particular time frame.
5. Position Sizing
Position sizing is determined by the Investment Amount (USD), which is the fixed amount to be invested in each buy order. The quantity of the asset to be purchased is calculated by dividing the investment amount by the current price of the asset (investment_amount / close). This ensures that the amount invested remains constant despite fluctuations in the asset's price.
6. Closing All Positions
The strategy includes an exit rule that closes all positions once the specified close date is reached. This allows for controlled exits and limits the exposure to market fluctuations beyond the strategy's timeframe.
7. Background Color Based on Price Relative to Bollinger Bands
The script uses the background color of the chart to provide visual feedback about the price's relationship with the Bollinger Bands:
Red background indicates the price is above the upper band, signaling overbought conditions.
Green background indicates the price is below the lower band, signaling oversold conditions.
This provides an easy-to-interpret visual cue for traders to assess the current market environment.
Postscript: Configuring Initial Capital for Backtesting
To ensure the backtest results align with the actual investment scenario, users must adjust the Initial Capital in the TradingView strategy properties. This is done by calculating the Initial Capital as the product of the Total Closed Trades and the Investment Amount (USD). For instance:
If the user is investing 100 USD per trade and has 10 closed trades, the Initial Capital should be set to 1,000 USD.
Similarly, if the user is investing 200 USD per trade and has 24 closed trades, the Initial Capital should be set to 4,800 USD.
This adjustment ensures that the backtesting results reflect the actual capital deployed in the strategy and provides an accurate representation of potential gains and losses.
Conclusion
The DCA strategy with Mean Reversion and Bollinger Bands is a systematic approach to investing that leverages the power of regular investments and technical analysis to reduce market timing risks. By combining DCA with the insights offered by Bollinger Bands and mean reversion, this strategy offers a structured way to navigate volatile markets while targeting favorable entry points. The clear entry and exit rules, coupled with time-based constraints, make it a robust and disciplined approach to long-term investing.

UVR ChannelsUVR CHANNELS: A VOLATILITY-BASED TREND ANALYSIS TOOL
PURPOSE
UVR Channels are designed to dynamically measure market volatility and identify key price levels for potential trend reversals. The channels are calculated using a unique volatility formula(UVR) combined with an EMA as the central reference point. This approach provides traders with a tool for evaluating trends, reversals, and market conditions such as breakouts or consolidations.
CALCULATION MECHANISM
1. Ultimate Volatility Rate (UVR) Calculation:
The UVR is a custom measure of volatility that highlights significant price movements by comparing the extremes of current and previous candles.
Volatility Components:
Two values are calculated to represent potential price fluctuations:
The absolute difference between the current candle's high and the previous candle's low:
Volatility Component 1=∣high−low ∣
The absolute difference between the previous candle's high and the current candle's low:
Volatility Component 2=∣high −low∣
Volatility Ratio:
The larger of the two components is selected as the Volatility Ratio, ensuring the UVR captures the most significant movement:
Volatility Ratio=max(Volatility Component 1,Volatility Component 2)
Smoothing with SMMA:
To stabilize the volatility calculation, the Volatility Ratio is smoothed using a Smoothed Moving Average (SMMA) over a user-defined period (e.g., 14 candles):
UVR= (UVR(Previous) × (Period−1))+Volatility Ratio)/Period
2. Band Construction:
The UVR is integrated into the band calculations by using the Exponential Moving Average (EMA) as the central line:
Central Line (EMA):
The EMA is calculated based on closing prices over a user-defined period (e.g., 20 candles).
Upper Band:
The upper band represents a dynamic resistance level, calculated as:
Upper Band=EMA+(UVR × Multiplier)
Lower Band:
The lower band serves as a dynamic support level, calculated as:
Lower Band=EMA−(UVR × Multiplier)
3. Role of the Multiplier:
The Multiplier adjusts the width of the bands based on trader preferences:
Higher Multiplier: Wider bands to capture larger price swings.
Lower Multiplier: Narrower bands for tighter market analysis.
FEATURES AND USAGE
Dynamic Volatility Analysis:
The UVR Channels expand and contract based on real-time market volatility, offering a dynamic framework for identifying potential price trends.
Expanding Bands: High market volatility.
Contracting Bands: Low volatility or consolidation.
Trend Identification:
Price consistently near the upper band indicates a strong bullish trend.
Price near the lower band signals a bearish trend.
Trend Reversal Signals:
Price reaching the upper band may signal overbought conditions, while price touching the lower band may signal oversold conditions.
Breakout Potential:
Narrow bands often precede significant price breakouts, making UVR Channels a useful tool for spotting early breakout conditions.
DIFFERENCES FROM BOLLINGER BANDS
Unlike Bollinger Bands, which rely on standard deviation to measure volatility, the UVR Channels use a custom volatility formula based on price extremes (highs and lows). This approach adapts to market behaviour in a unique way, providing traders with an alternative and accurate view of volatility and trends.
INPUT PARAMETERS
Volatility Period:
Determines the number of periods used to smooth the volatility ratio. A higher value results in smoother bands but may lag behind sudden market changes.
EMA Period:
Controls the calculation of the central reference line.
Multiplier:
Adjusts the width of the bands. Increasing the multiplier widens the bands, capturing larger price movements, while decreasing it narrows the bands for tighter analysis.
VISUALIZATION
Purple Line: The EMA (central line).
Red Line: Upper band (dynamic resistance).
Green Line: Lower band (dynamic support).
Shaded Area: Fills the space between the upper and lower bands, visually highlighting the channel.

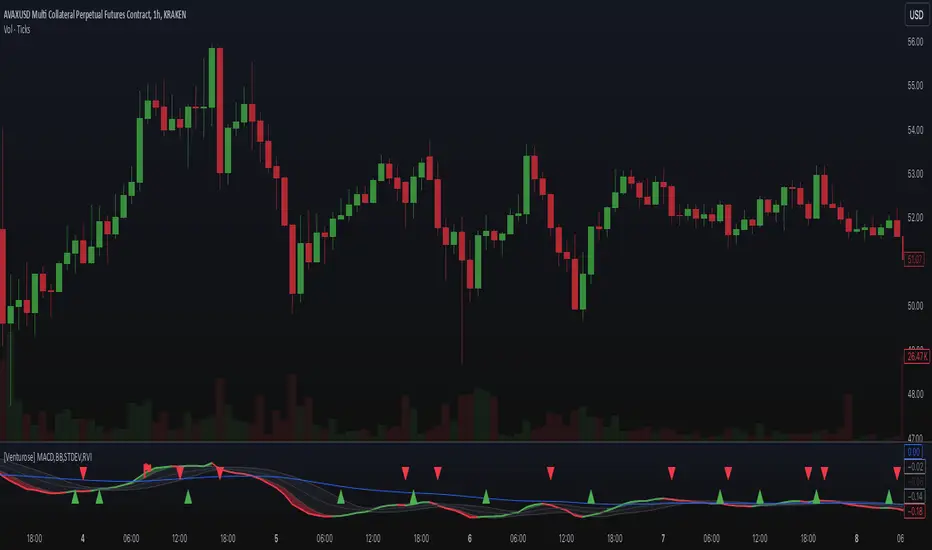
[Venturose] MACD x BB x STDEV x RVIDescription:
The MACD x BB x STDEV x RVI combines MACD, Bollinger Bands, Standard Deviation, and Relative Volatility Index into a single tool. This indicator is designed to provide insights into market trends, momentum, and volatility. It generates buy and sell signals, by analyzing the interactions between these components. These buy and sell signals are not literal, and should be used in combination with the current trend.
How It Works:
MACD: Tracks momentum and trend direction using customizable fast and slow EMA periods.
Bollinger Bands: Adds volatility bands to MACD to identify overextension zones.
Standard Deviation: Dynamically adjusts the Bollinger Band width based on MACD volatility.
RVI (Relative Volatility Index): Confirms momentum extremes with upper and lower threshold markers.
Custom Logic: Includes a trigger system ("inside" or "flipped") to adapt signals to various market conditions and an optional filter to reduce noise.
Key Features:
Combines MACD and Bollinger Bands with volatility and momentum confirmations from RVI.
Dynamic color-coded plots for identifying bullish, bearish, and neutral trends.
Customizable parameters for tailoring the indicator to different strategies.
Optional signal filtering to refine buy and sell triggers.
Alerts for buy and sell signals based on signal logic.
Why It’s Unique:
This indicator combines momentum (MACD), volatility (Bollinger Bands and Standard Deviation), and confirmation signals (RVI thresholds) into a unified system. It introduces custom "inside" and "flipped" triggers for adaptable signal generation and includes signal filtering to reduce noise. The addition of RVI-based hints helps identify early overbought or oversold conditions, providing an extra layer of insight for decision-making. The dynamic integration of these components ensures a comprehensive yet straightforward analysis tool for various market conditions.
MACD, ADX & RSI -> for altcoins# MACD + ADX + RSI Combined Indicator
## Overview
This advanced technical analysis tool combines three powerful indicators (MACD, ADX, and RSI) into a single view, providing a comprehensive analysis of trend, momentum, and divergence signals. The indicator is designed to help traders identify potential trading opportunities by analyzing multiple aspects of price action simultaneously.
## Components
### 1. MACD (Moving Average Convergence Divergence)
- **Purpose**: Identifies trend direction and momentum
- **Components**:
- Fast EMA (default: 12 periods)
- Slow EMA (default: 26 periods)
- Signal Line (default: 9 periods)
- Histogram showing the difference between MACD and Signal line
- **Visual**:
- Blue line: MACD line
- Orange line: Signal line
- Green/Red histogram: MACD histogram
- **Interpretation**:
- Histogram color changes indicate potential trend shifts
- Crossovers between MACD and Signal lines suggest entry/exit points
### 2. ADX (Average Directional Index)
- **Purpose**: Measures trend strength and direction
- **Components**:
- ADX line (default threshold: 20)
- DI+ (Positive Directional Indicator)
- DI- (Negative Directional Indicator)
- **Visual**:
- Navy blue line: ADX
- Green line: DI+
- Red line: DI-
- **Interpretation**:
- ADX > 20 indicates a strong trend
- DI+ crossing above DI- suggests bullish momentum
- DI- crossing above DI+ suggests bearish momentum
### 3. RSI (Relative Strength Index)
- **Purpose**: Identifies overbought/oversold conditions and divergences
- **Components**:
- RSI line (default: 14 periods)
- Divergence detection
- **Visual**:
- Purple line: RSI
- Horizontal lines at 70 (overbought) and 30 (oversold)
- Divergence labels ("Bull" and "Bear")
- **Interpretation**:
- RSI > 70: Potentially overbought
- RSI < 30: Potentially oversold
- Bullish/Bearish divergences indicate potential trend reversals
## Alert System
The indicator includes several automated alerts:
1. **MACD Alerts**:
- Rising to falling histogram transitions
- Falling to rising histogram transitions
2. **RSI Divergence Alerts**:
- Bullish divergence formations
- Bearish divergence formations
3. **ADX Trend Alerts**:
- Strong trend development (ADX crossing threshold)
- DI+ crossing above DI- (bullish)
- DI- crossing above DI+ (bearish)
## Settings Customization
All components can be fine-tuned through the settings panel:
### MACD Settings
- Fast Length
- Slow Length
- Signal Smoothing
- Source
- MA Type options (SMA/EMA)
### ADX Settings
- Length
- Threshold level
### RSI Settings
- RSI Length
- Source
- Divergence calculation toggle
## Usage Guidelines
### Entry Signals
Strong entry signals typically occur when multiple components align:
1. MACD histogram color change
2. ADX showing strong trend (>20)
3. RSI showing divergence or leaving oversold/overbought zones
### Exit Signals
Consider exits when:
1. MACD crosses signal line in opposite direction
2. ADX shows weakening trend
3. RSI reaches extreme levels with divergence
### Risk Management
- Use the indicator as part of a complete trading strategy
- Combine with price action and support/resistance levels
- Consider multiple timeframe analysis for confirmation
- Don't rely solely on any single component
## Technical Notes
- Built for TradingView using Pine Script v5
- Compatible with all timeframes
- Optimized for real-time calculation
- Includes proper error handling and NA value management
- Memory-efficient calculations for smooth performance
## Installation
1. Copy the provided Pine Script code
2. Open TradingView Chart
3. Create New Indicator -> Pine Editor
4. Paste the code and click "Add to Chart"
5. Adjust settings as needed through the indicator settings panel
## Version Information
- Version: 2.0
- Last Updated: November 2024
- Platform: TradingView
- Language: Pine Script v5

MACD+RSI+BBDESCRIPTION
The MACD + RSI + Bollinger Bands Indicator is a comprehensive technical analysis tool designed for traders and investors to identify potential market trends and reversals. This script combines three indicators: the Moving Average Convergence Divergence (MACD), the Relative Strength Index (RSI), and Bollinger Bands. Each of these indicators provides unique insights into market behavior.
FEATURES
MACD (Moving Average Convergence Divergence)
The MACD is a trend-following momentum indicator that shows the relationship between two moving averages of a security’s price.
The script calculates the MACD line, the signal line, and the histogram, which visually represents the difference between the MACD line and the signal line.
RSI (Relative Strength Index)
The RSI is a momentum oscillator that measures the speed and change of price movements. It ranges from 0 to 100 and is typically used to identify overbought or oversold conditions.
The script allows users to set custom upper and lower thresholds for the RSI, with default values of 70 and 30, respectively.
Bollinger Bands
Bollinger Bands consist of a middle band (EMA) and two outer bands (standard deviations away from the EMA). They help traders identify volatility and potential price reversals.
The script allows users to customize the length of the Bollinger Bands and the multiplier for the standard deviation.
Color-Coding Logic
The histogram color changes based on the following conditions:
Black: If the RSI is above the upper threshold and the closing price is above the upper Bollinger Band, or if the RSI is below the lower threshold and the closing price is below the lower Bollinger Band.
Green (#4caf50): If the RSI is above the upper threshold but the closing price is not above the upper Bollinger Band.
Light Green (#a5d6a7): If the histogram is positive and the RSI is not above the upper threshold.
Red (#f23645): If the RSI is below the lower threshold but the closing price is not below the lower Bollinger Band.
Light Red (#faa1a4): If the histogram is negative and the RSI is not below the lower threshold.
Inputs
Bollinger Bands Settings
Length: The number of periods for the moving average.
Basis MA Type: The type of moving average (SMA, EMA, SMMA, WMA, VWMA).
Source: The price source for the Bollinger Bands calculation.
StdDev: The multiplier for the standard deviation.
RSI Settings
RSI Length: The number of periods for the RSI calculation.
RSI Upper: The upper threshold for the RSI.
RSI Lower: The lower threshold for the RSI.
Source: The price source for the RSI calculation.
MACD Settings
Fast Length: The length for the fast moving average.
Slow Length: The length for the slow moving average.
Signal Smoothing: The length for the signal line smoothing.
Oscillator MA Type: The type of moving average for the MACD calculation.
Signal Line MA Type: The type of moving average for the signal line.
Usage
This indicator is suitable for various trading strategies, including day trading, swing trading, and long-term investing.
Traders can use the MACD histogram to identify potential buy and sell signals, while the RSI can help confirm overbought or oversold conditions.
The Bollinger Bands provide context for price volatility and potential breakout or reversal points.
Example:
From the example, it can clearly see that the Selling Climax and Buying Climax, marked as orange circle when a black histogram occurs.
Conclusion
The MACD + RSI + Bollinger Bands Indicator is a versatile tool that combines multiple technical analysis methods to provide traders with a comprehensive view of market conditions. By utilizing this script, traders can enhance their analysis and improve their decision-making process.

Pivot Bollinger BandThis is a special kind of Bollinger Bands indicator that adapts to the market's pivot points. Instead of using regular price data, it first finds important swing highs and lows in the market (called pivot points). It then uses these pivot points to create a center line, which is like a moving average of where the market is pivoting.
Around this center line, it draws the classic Bollinger Bands - an upper and lower band that show where prices might find resistance or support. The distance between these bands changes based on market volatility, just like regular Bollinger Bands. You can adjust how sensitive it is to pivot points and how wide the bands should be.
By using pivot point based Bollinger Bands, we expect band breakout can be captured more effectively.

VIDYA ProTrend Multi-Tier ProfitHello! This time is about a trend-following system.
VIDYA is quite an interesting indicator that adjusts dynamically to market volatility, making it more responsive to price changes compared to traditional moving averages. Balancing adaptability and precision, especially with the more aggressive short trade settings, challenged me to fine-tune the strategy for a variety of market conditions.
█ Introduction and How it is Different
The "VIDYA ProTrend Multi-Tier Profit" strategy is a trend-following system that combines the VIDYA (Variable Index Dynamic Average) indicator with Bollinger Bands and a multi-step take-profit mechanism.
Unlike traditional trend strategies, this system allows for more adaptive profit-taking, adjusting for long and short positions through distinct ATR-based and percentage-based targets. The innovation lies in its dynamic multi-tier approach to profit-taking, especially for short trades, where more aggressive percentages are applied using a multiplier. This flexibility helps adapt to various market conditions by optimizing trade management and profit allocation based on market volatility and trend strength.
BTCUSD 6hr performance
█ Strategy, How it Works: Detailed Explanation
The core of the "VIDYA ProTrend Multi-Tier Profit" strategy lies in the dual VIDYA indicators (fast and slow) that analyze price trends while accounting for market volatility. These indicators work alongside Bollinger Bands to filter trade entries and exits.
🔶 VIDYA Calculation
The VIDYA indicator is calculated using the following formula:
Smoothing factor (𝛼):
alpha = 2 / (Length + 1)
VIDYA formula:
VIDYA(t) = alpha * k * Price(t) + (1 - alpha * k) * VIDYA(t-1)
Where:
k = |Chande Momentum Oscillator (MO)| / 100
🔶 Bollinger Bands as a Volatility Filter
Bollinger Bands are calculated using a rolling mean and standard deviation of price over a specified period:
Upper Band:
BB_upper = MA + (K * stddev)
Lower Band:
BB_lower = MA - (K * stddev)
Where:
MA is the moving average,
K is the multiplier (typically 2), and
stddev is the standard deviation of price over the Bollinger Bands length.
These bands serve as volatility filters to identify potential overbought or oversold conditions, aiding in the entry and exit logic.
🔶 Slope Calculation for VIDYA
The slopes of both fast and slow VIDYAs are computed to assess the momentum and direction of the trend. The slope for a given VIDYA over its length is:
Slope = (VIDYA(t) - VIDYA(t-n)) / n
Where:
n is the length of the lookback period. Positive slope indicates bullish momentum, while negative slope signals bearish momentum.
LOCAL picture
🔶 Entry and Exit Conditions
- Long Entry: Occurs when the price moves above the slow VIDYA and the fast VIDYA is trending upward. Bollinger Bands confirm the signal when the price crosses the upper band, indicating bullish strength.
- Short Entry: Happens when the price drops below the slow VIDYA and the fast VIDYA trends downward. The signal is confirmed when the price crosses the lower Bollinger Band, showing bearish momentum.
- Exit: Based on VIDYA slopes flattening or reversing, or when the price hits specific ATR or percentage-based profit targets.
🔶 Multi-Step Take Profit Mechanism
The strategy incorporates three levels of take profit for both long and short trades:
- ATR-based Take Profit: Each step applies a multiple of the ATR (Average True Range) to the entry price to define the exit point.
The first level of take profit (long):
TP_ATR1_long = Entry Price + (2.618 * ATR)
etc.
█ Trade Direction
The strategy offers flexibility in defining the trading direction:
- Long: Only long trades are considered based on the criteria for upward trends.
- Short: Only short trades are initiated in bearish trends.
- Both: The strategy can take both long and short trades depending on the market conditions.
█ Usage
To use the strategy effectively:
- Adjust the VIDYA lengths (fast and slow) based on your preference for trend sensitivity.
- Use Bollinger Bands as a filter for identifying potential breakout or reversal scenarios.
- Enable the multi-step take profit feature to manage positions dynamically, allowing for partial exits as the price reaches specified ATR or percentage levels.
- Leverage the short trade multiplier for more aggressive take profit levels in bearish markets.
This strategy can be applied to different asset classes, including equities, forex, and cryptocurrencies. Adjust the input parameters to suit the volatility and characteristics of the asset being traded.
█ Default Settings
The default settings for this strategy have been designed for moderate to trending markets:
- Fast VIDYA Length (10): A shorter length for quick responsiveness to price changes. Increasing this length will reduce noise but may delay signals.
- Slow VIDYA Length (30): The slow VIDYA is set longer to capture broader market trends. Shortening this value will make the system more reactive to smaller price swings.
- Minimum Slope Threshold (0.05): This threshold helps filter out weak trends. Lowering the threshold will result in more trades, while raising it will restrict trades to stronger trends.
Multi-Step Take Profit Settings
- ATR Multipliers (2.618, 5.0, 10.0): These values define how far the price should move before taking profit. Larger multipliers widen the profit-taking levels, aiming for larger trend moves. In higher volatility markets, these values might be adjusted downwards.
- Percentage Levels (3%, 8%, 17%): These percentage levels define how much the price must move before taking profit. Increasing the percentages will capture larger moves, while smaller percentages offer quicker exits.
- Short TP Multiplier (1.5): This multiplier applies more aggressive take profit levels for short trades. Adjust this value based on the aggressiveness of your short trade management.
Each of these settings directly impacts the performance and risk profile of the strategy. Shorter VIDYA lengths and lower slope thresholds will generate more trades but may result in more whipsaws. Higher ATR multipliers or percentage levels can delay profit-taking, aiming for larger trends but risking partial gains if the trend reverses too early.

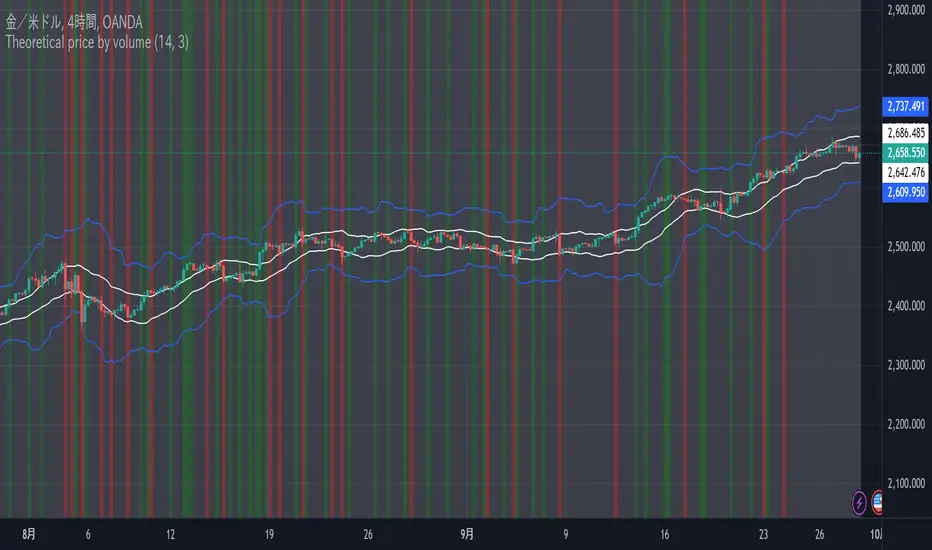
Theoretical price by volumeThis code is used to calculate a theoretical price range based on volume and price change and display it on the chart. Specifically, it calculates the “theoretical price volatility” based on price changes and volume, from which the upper and lower price limits are derived.
The price volatility is calculated by dividing the price change by the volume as the change unit volume.
Based on this volatility, we calculate the theoretical variation relative to the current price (“Theoretical Variance Difference”).
Based on the results, **Theoretical High Price (p_price) and Theoretical Low Price (m_price)** are calculated.
The chart displays the upper and lower bounds of these theoretical prices in color, and also calculates their mean and standard deviation (in the form of a Bollinger band) and plots them.
The background color on the chart indicates whether the price is within the theoretical price range, and at the same time, the mean and standard deviation of the theoretical prices are used to visualize price movements in more detail.
This indicator helps traders understand the impact of volume on price movements and helps them determine if prices are staying within the theoretical range or if there are unusual movements.
Bitcoin CME-Spot Z-Spread - Strategy [presentTrading]This time is a swing trading strategy! It measures the sentiment of the Bitcoin market through the spread of CME Bitcoin Futures and Bitfinex BTCUSD Spot prices. By applying Bollinger Bands to the spread, the strategy seeks to capture mean-reversion opportunities when prices deviate significantly from their historical norms
█ Introduction and How it is Different
The Bitcoin CME-Spot Bollinger Bands Strategy is designed to capture mean-reversion opportunities by exploiting the spread between CME Bitcoin Futures and Bitfinex BTCUSD Spot prices. The strategy uses Bollinger Bands to detect when the spread between these two correlated assets has deviated significantly from its historical norm, signaling potential overbought or oversold conditions.
What sets this strategy apart is its focus on spread trading between futures and spot markets rather than price-based indicators. By applying Bollinger Bands to the spread rather than individual prices, the strategy identifies price inefficiencies across markets, allowing traders to take advantage of the natural reversion to the mean that often occurs in these correlated assets.
BTCUSD 8hr Performance
█ Strategy, How It Works: Detailed Explanation
The strategy relies on Bollinger Bands to assess the volatility and relative deviation of the spread between CME Bitcoin Futures and Bitfinex BTCUSD Spot prices. Bollinger Bands consist of a moving average and two standard deviation bands, which help measure how much the spread deviates from its historical mean.
🔶 Spread Calculation:
The spread is calculated by subtracting the Bitfinex spot price from the CME Bitcoin futures price:
Spread = CME Price - Bitfinex Price
This spread represents the difference between the futures and spot markets, which may widen or narrow based on supply and demand dynamics in each market. By analyzing the spread, the strategy can detect when prices are too far apart (potentially overbought or oversold), indicating a trading opportunity.
🔶 Bollinger Bands Calculation:
The Bollinger Bands for the spread are calculated using a simple moving average (SMA) and the standard deviation of the spread over a defined period.
1. Moving Average (SMA):
The simple moving average of the spread (mu_S) over a specified period P is calculated as:
mu_S = (1/P) * sum(S_i from i=1 to P)
Where S_i represents the spread at time i, and P is the lookback period (default is 200 bars). The moving average provides a baseline for the normal spread behavior.
2. Standard Deviation:
The standard deviation (sigma_S) of the spread is calculated to measure the volatility of the spread:
sigma_S = sqrt((1/P) * sum((S_i - mu_S)^2 from i=1 to P))
3. Upper and Lower Bollinger Bands:
The upper and lower Bollinger Bands are derived by adding and subtracting a multiple of the standard deviation from the moving average. The number of standard deviations is determined by a user-defined parameter k (default is 2.618).
- Upper Band:
Upper Band = mu_S + (k * sigma_S)
- Lower Band:
Lower Band = mu_S - (k * sigma_S)
These bands provide a dynamic range within which the spread typically fluctuates. When the spread moves outside of these bands, it is considered overbought or oversold, potentially offering trading opportunities.
Local view
🔶 Entry Conditions:
- Long Entry: A long position is triggered when the spread crosses below the lower Bollinger Band, indicating that the spread has become oversold and is likely to revert upward.
Spread < Lower Band
- Short Entry: A short position is triggered when the spread crosses above the upper Bollinger Band, indicating that the spread has become overbought and is likely to revert downward.
Spread > Upper Band
🔶 Risk Management and Profit-Taking:
The strategy incorporates multi-step take profits to lock in gains as the trade moves in favor. The position is gradually reduced at predefined profit levels, reducing risk while allowing part of the trade to continue running if the price keeps moving favorably.
Additionally, the strategy uses a hold period exit mechanism. If the trade does not hit any of the take-profit levels within a certain number of bars, the position is closed automatically to avoid excessive exposure to market risks.
█ Trade Direction
The trade direction is based on deviations of the spread from its historical norm:
- Long Trade: The strategy enters a long position when the spread crosses below the lower Bollinger Band, signaling an oversold condition where the spread is expected to narrow.
- Short Trade: The strategy enters a short position when the spread crosses above the upper Bollinger Band, signaling an overbought condition where the spread is expected to widen.
These entries rely on the assumption of mean reversion, where extreme deviations from the average spread are likely to revert over time.
█ Usage
The Bitcoin CME-Spot Bollinger Bands Strategy is ideal for traders looking to capitalize on price inefficiencies between Bitcoin futures and spot markets. It’s especially useful in volatile markets where large deviations between futures and spot prices occur.
- Market Conditions: This strategy is most effective in correlated markets, like CME futures and spot Bitcoin. Traders can adjust the Bollinger Bands period and standard deviation multiplier to suit different volatility regimes.
- Backtesting: Before deployment, backtesting the strategy across different market conditions and timeframes is recommended to ensure robustness. Adjust the take-profit steps and hold periods to reflect the trader’s risk tolerance and market behavior.
█ Default Settings
The default settings provide a balanced approach to spread trading using Bollinger Bands but can be adjusted depending on market conditions or personal trading preferences.
🔶 Bollinger Bands Period (200 bars):
This defines the number of bars used to calculate the moving average and standard deviation for the Bollinger Bands. A longer period smooths out short-term fluctuations and focuses on larger, more significant trends. Adjusting the period affects the responsiveness of the strategy:
- Shorter periods (e.g., 100 bars): Makes the strategy more reactive to short-term market fluctuations, potentially generating more signals but increasing the risk of false positives.
- Longer periods (e.g., 300 bars): Focuses on longer-term trends, reducing the frequency of trades and focusing only on significant deviations.
🔶 Standard Deviation Multiplier (2.618):
The multiplier controls how wide the Bollinger Bands are around the moving average. By default, the bands are set at 2.618 standard deviations away from the average, ensuring that only significant deviations trigger trades.
- Higher multipliers (e.g., 3.0): Require a more extreme deviation to trigger trades, reducing trade frequency but potentially increasing the accuracy of signals.
- Lower multipliers (e.g., 2.0): Make the bands narrower, increasing the number of trade signals but potentially decreasing their reliability.
🔶 Take-Profit Levels:
The strategy has four take-profit levels to gradually lock in profits:
- Level 1 (3%): 25% of the position is closed at a 3% profit.
- Level 2 (8%): 20% of the position is closed at an 8% profit.
- Level 3 (14%): 15% of the position is closed at a 14% profit.
- Level 4 (21%): 10% of the position is closed at a 21% profit.
Adjusting these take-profit levels affects how quickly profits are realized:
- Lower take-profit levels: Capture gains more quickly, reducing risk but potentially cutting off larger profits.
- Higher take-profit levels: Let trades run longer, aiming for bigger gains but increasing the risk of price reversals before profits are locked in.
🔶 Hold Days (20 bars):
The strategy automatically closes the position after 20 bars if none of the take-profit levels are hit. This feature prevents trades from being held indefinitely, especially if market conditions are stagnant. Adjusting this:
- Shorter hold periods: Reduce the duration of exposure, minimizing risks from market changes but potentially closing trades too early.
- Longer hold periods: Allow trades to stay open longer, increasing the chance for mean reversion but also increasing exposure to unfavorable market conditions.
By understanding how these default settings affect the strategy’s performance, traders can optimize the Bitcoin CME-Spot Bollinger Bands Strategy to their preferences, adapting it to different market environments and risk tolerances.

Uptrick: Market MoodsThe "Uptrick: Market Moods" indicator is an advanced technical analysis tool designed for the TradingView platform. It combines three powerful indicators—Relative Strength Index (RSI), Average True Range (ATR), and Bollinger Bands—into one cohesive framework, aimed at helping traders better understand and interpret market sentiment. By capturing shifts in the emotional climate of the market, it provides a holistic view of market conditions, which can range from calm to stressed or even highly excited. This multi-dimensional analysis tool stands apart from traditional single-indicator approaches by offering a more complete picture of market dynamics, making it a valuable resource for traders looking to anticipate and react to changes in market behavior.
The RSI in the "Uptrick: Market Moods" indicator is used to measure momentum. RSI is an essential component of many technical analysis strategies, and in this tool, it is used to identify potential market extremes. When RSI values are high, they indicate an overbought condition, meaning the market may be approaching a peak. Conversely, low RSI values suggest an oversold condition, signaling that the market could be nearing a bottom. These extremes provide crucial clues about shifts in market sentiment, helping traders gauge whether the current emotional state of the market is likely to result in a reversal. This understanding is pivotal in predicting whether the market is transitioning from calm to stressed or from excited to overbought.
The Average True Range adds another layer to this analysis by offering insights into market volatility. Volatility is a key factor in understanding the mood of the market, as periods of high volatility often reflect high levels of excitement or stress, while low volatility typically indicates a calm, steady market. ATR is calculated based on the range of price movements over a given period, and the higher the value, the more volatile the market is. The "Uptrick: Market Moods" indicator uses ATR to dynamically gauge volatility levels, helping traders understand whether the market is currently moving in a way that aligns with its emotional mood. For example, an increase in ATR accompanied by an RSI value that indicates overbought conditions could suggest that the market is in a highly excited state, with the potential for either strong momentum continuation or a sharp reversal.
Bollinger Bands complement these tools by providing visual cues about price volatility and the range within which the market is likely to move. Bollinger Bands plot two standard deviations away from a simple moving average of the price. This banding technique helps traders visualize how far the price is likely to deviate from its average over a certain period. The "Uptrick: Market Moods" indicator uses Bollinger Bands to establish price boundaries and identify breakout conditions. When prices break above the upper band or below the lower band, it often signals that the market is either highly stressed or excited. This breakout condition serves as a visual representation of the market mood, alerting traders to moments when prices are moving beyond typical ranges and when significant emotional shifts are occurring in the market.
Technically, the "Uptrick: Market Moods" indicator has been developed using TradingView’s Pine Script language, a highly efficient language for building custom indicators. It employs functions like ta.rsi, ta.atr, and ta.sma to perform the necessary calculations. The use of these built-in functions ensures that the calculations are both accurate and efficient, allowing the indicator to operate in real-time without lagging, even in volatile market conditions. The ta.rsi function is used to compute the Relative Strength Index, while ta.atr calculates the Average True Range, and ta.sma is used to smooth out price data for the Bollinger Bands. These functions are applied dynamically within the script, allowing the "Uptrick: Market Moods" indicator to respond to changes in market conditions in real time.
The user interface of the "Uptrick: Market Moods" indicator is designed to provide a visually intuitive experience. The market mood is color-coded on the chart, making it easy for traders to identify whether the market is calm, stressed, or excited at a glance. This feature is especially useful for traders who need to make quick decisions in fast-moving markets. Additionally, the indicator includes an interactive table that updates in real-time, showing the most recent mood state and its frequency. This provides valuable statistical insights into market behavior over specific time frames, helping traders track the dominant emotional state of the market. Whether the market is in a prolonged calm state or rapidly transitioning through moods, this real-time feedback offers actionable data that can help traders adjust their strategies accordingly.
The RSI component of the "Uptrick: Market Moods" indicator helps detect the speed and direction of price movements, offering insight into whether the market is approaching extreme conditions. By providing signals based on overbought and oversold levels, the RSI helps traders decide whether to enter or exit positions. The ATR element acts as a volatility gauge, dynamically adjusting traders’ expectations in response to changes in market volatility. Meanwhile, the Bollinger Bands help identify trends and potential breakout conditions, serving as an additional confirmation tool that highlights when the price has moved beyond normal boundaries, indicating heightened market excitement or stress.
Despite the robust capabilities of the "Uptrick: Market Moods" indicator, it does have limitations. In markets affected by sudden shifts, such as those driven by major news events or external economic factors, the indicator’s performance may not always be reliable. These external factors can cause rapid mood swings that are difficult for any technical analysis tool to fully anticipate. Additionally, the indicator’s complexity may pose a learning curve for novice traders, particularly those who are unfamiliar with the concepts of RSI, ATR, and Bollinger Bands. However, with practice, traders can become proficient in using the tool to its full potential, leveraging the insights it provides to better navigate market shifts.
For traders seeking a deeper understanding of market sentiment, the "Uptrick: Market Moods" indicator is an invaluable resource. It is recommended for those dealing with medium to high volatility instruments, where understanding emotional shifts can offer a strategic advantage. While it can be used on its own, integrating it with other forms of analysis, such as fundamental analysis and additional technical indicators, can enhance its effectiveness. By confirming signals with other tools, traders can reduce the likelihood of false signals and improve their overall trading strategy.
To further enhance the accuracy of the "Uptrick: Market Moods" indicator, it can be integrated with volume-based tools like Volume Profile or On-Balance Volume (OBV). This combination allows traders to confirm the moods identified by the indicator with volume data, providing additional confirmation of market sentiment. For example, when the market is in an excited mood, an increase in trading volume could reinforce the reliability of that signal. Conversely, if the market is stressed but volume remains low, traders may want to proceed with caution. Using multiple indicators together creates a more comprehensive trading approach, helping traders better manage risk and make informed decisions based on multiple data points.
In conclusion, the "Uptrick: Market Moods" indicator is a powerful and unique addition to the suite of technical analysis tools available on TradingView. It provides traders with a multi-dimensional view of market sentiment by combining the analytical strengths of RSI, ATR, and Bollinger Bands into a single tool. Its ability to capture and interpret the emotional mood of the market makes it an essential tool for traders seeking to gain an edge in understanding market behavior. While the indicator has certain limitations, particularly in rapidly shifting markets, its ability to provide real-time insights into market sentiment is a valuable asset for traders of all experience levels. Used in conjunction with other tools and sound trading practices, the "Uptrick: Market Moods" indicator offers a comprehensive solution for navigating the complexities of financial markets.

Bollinger Bands ForLoopBollinger Bands ForLoop
OVERVIEW
BB ForLoop is an improved version of Bollinger Bands it is designed to calculate an array of values 1 or -1 depending if soruce for calculations is above or below basis.
It takes avereage of values over a range of lengths, providing trend signals smothed based on various moving averages in order to get rid of noise.
It offers flexibility with different signal modes and visual customizations.
TYPE OF SIGNALS
-FAST (MA > MA or MA > 0.99)
-SLOW (MA > 0)
-THRESHOLD CROSSING (when cross above/below treshold set independently for both directions)
-FAST THRESHOLD (when there's change in signal by set margin e.g (0.4 -> 0.2) means bearsih when FT is set to 0.1, when MA is > 0.99 it will signal bullish, when MA < -0.99 it will signal bearish)
Generaly Lime color of line indicates Bullish, Fuchsia indicates Bearish.
This colors are not set in stone so you can change them in settings.
-Bullish Trend, line color is lime
-Bearish Trend, line color is fuchsia
Credit
Idea for this script was from one of indicators created by www.tradingview.com
Warning
Be careful when using this indicator especialy combining DEMA with FT (Fast Treshold).
This indicator can be really noisy depending on the settings, signal mode so it should be used preferably as a part of an strategy not as a stand alone indicator
Remember the lower the timeframe you use the more noise there is.
No single indicator should be used alone when making investment decisions.

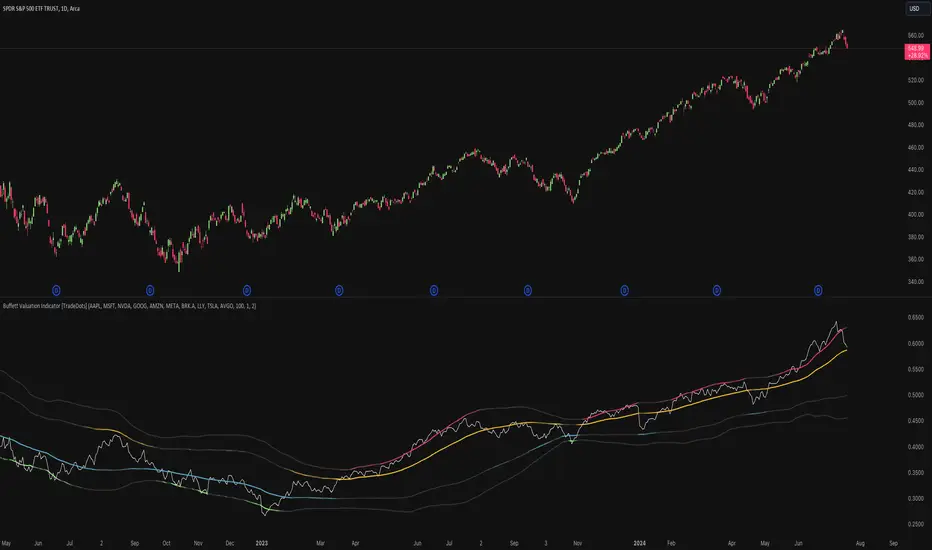
Buffett Valuation Indicator [TradeDots]The Buffett Valuation Indicator (also known as the Buffett Index or Buffett Ratio) measures the ratio of the total United States stock market to GDP.
This indicator helps determine whether the valuation changes in US stocks are justified by the GDP level.
For example, the ratio is calculated based on the standard deviations from the historical trend line. If the value exceeds +2 standard deviations, it suggests that the stock market is overvalued relative to GDP, and vice versa.
This "Buffett Valuation Indicator" is an enhanced version of the original indicator. It applies a Bollinger Band over the Valuation/GDP ratio to identify overvaluation and undervaluation across different timeframes, making it efficient for use in smaller timeframes, e.g. daily or even hourly intervals.
HOW DOES IT WORK
The Buffett Valuation Indicator measures the ratio between US stock valuation and US GDP, evaluating whether stock valuations are overvalued or undervalued in GDP terms.
In this version, the total valuation of the US stock market is represented by considering the top 10 market capitalization stocks.
Users can customize this list to include other stocks for a more balanced valuation ratio. Alternatively, users may use S&P 500 ETFs, such as SPY or VOO, as inputs.
The ratio is plotted as a line chart in a separate panel below the main chart. A Bollinger Band with a default 100-period and multiples of 1 and 2 is used to identify overvaluation and undervaluation.
For instance, if the ratio line moves above the +2 standard deviation line, it indicates that stocks are overvalued, signaling a potential selling opportunity.
APPLICATION
When the indicator is applied to a chart, we observe the ratio line's movements relative to the standard deviation lines. The further the line deviates from the standard deviation lines, the more extreme the overvaluation or undervaluation.
We look for buying opportunities when the Buffett Index moves below the first and second standard deviation lines and sell opportunities when it moves above these lines. This indicator is used as a microeconomic confirmation tool, in combination with other indicators, to achieve higher win-rate setups.
RISK DISCLAIMER
Trading entails substantial risk, and most day traders incur losses. All content, tools, scripts, articles, and education provided by TradeDots serve purely informational and educational purposes. Past performances are not definitive predictors of future results.
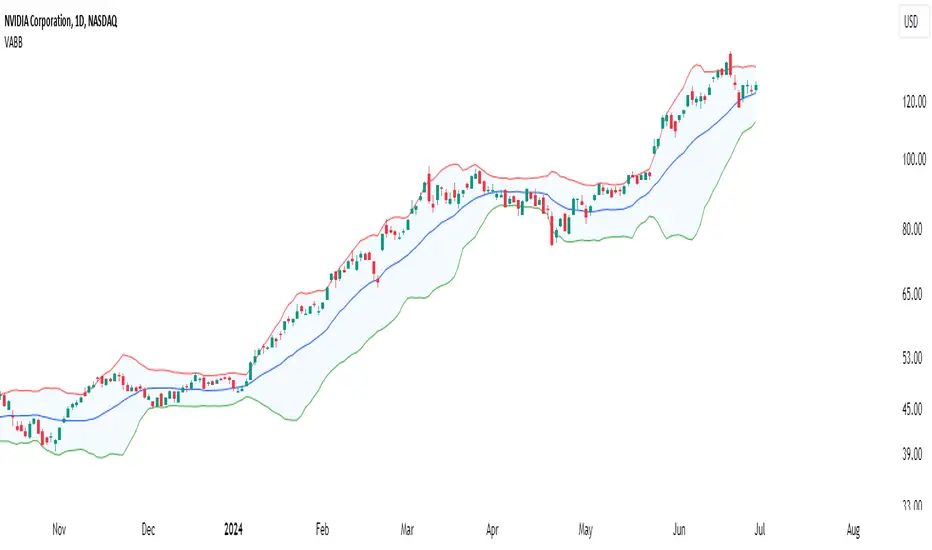
Volume-Adjusted Bollinger BandsThe Volume-Adjusted Bollinger Bands (VABB) indicator is an advanced technical analysis tool that enhances the traditional Bollinger Bands by incorporating volume data. This integration allows the bands to dynamically adjust based on market volume, providing a more nuanced view of price movements and volatility. The key qualities of the VABB indicator include:
1. Dynamic Adjustment with Volume: Traditional Bollinger Bands are based solely on price data and standard deviations. The VABB indicator adjusts the width of the bands based on the volume ratio, making them more responsive to changes in market activity. This means that during periods of high volume, the bands will expand, and during periods of low volume, they will contract. This adjustment helps to reinforce the significance of price movements relative to the central line (VWMA).
2. Volume-Weighted Moving Average (VWMA): Instead of using a simple moving average (SMA) as the central line, the VABB uses the VWMA, which weights prices by volume. This provides a more accurate representation of the average price level, considering the trading volume.
3. Enhanced Signal Reliability: By incorporating volume, the VABB can filter out false signals that might occur in low-volume conditions. This makes the indicator particularly useful for identifying significant price movements that are supported by strong trading activity.
How to Use and Interpret the VABB Indicator
To use the VABB indicator, you need to set it up on your trading platform with the following parameters:
1. BB Length: The number of periods for calculating the Bollinger Bands (default is 20).
2. BB Multiplier: The multiplier for the standard deviation to set the width of the Bollinger Bands (default is 2.0).
3. Volume MA Length: The number of periods for calculating the moving average of the volume (default is 14).
Volume Ratio Smoothing Length: The number of periods for smoothing the volume ratio (default is 5).
Interpretation
1.Trend Identification: The VWMA serves as the central line. When the price is above the VWMA, it indicates an uptrend, and when it is below, it indicates a downtrend. The direction of the VWMA itself can also signal the trend's strength.
2. Volatility and Volume Analysis: The width of the VABB bands reflects both volatility and volume. Wider bands indicate high volatility and/or high volume, suggesting significant price movements. Narrower bands indicate low volatility and/or low volume, suggesting consolidation.
3. Trading Signals:
Breakouts: A price move outside the adjusted upper or lower bands can signal a potential breakout. High volume during such moves reinforces the breakout's validity.
Reversals: When the price touches or crosses the adjusted upper band, it may indicate overbought conditions, while touching or crossing the adjusted lower band may indicate oversold conditions. These conditions can signal potential reversals, especially if confirmed by other indicators or volume patterns.
Volume Confirmation: The volume ratio component helps confirm the strength of price movements. For instance, a breakout accompanied by a high volume ratio is more likely to be sustained than one with a low volume ratio.
Practical Example
Bullish Scenario: If the price crosses above the adjusted upper band with a high volume ratio, it suggests a strong bullish breakout. Traders might consider entering a long position, setting a stop-loss just below the VWMA or the lower band.
Bearish Scenario: Conversely, if the price crosses below the adjusted lower band with a high volume ratio, it suggests a strong bearish breakout. Traders might consider entering a short position, setting a stop-loss just above the VWMA or the upper band.
Conclusion
The Volume-Adjusted Bollinger Bands (VABB) indicator is a powerful tool that enhances traditional Bollinger Bands by incorporating volume data. This dynamic adjustment helps traders better understand market conditions and make more informed trading decisions. By using the VABB indicator, traders can identify significant price movements supported by volume, improving the reliability of their trading signals.
The Volume-Adjusted Bollinger Bands (VABB) indicator is provided for educational and informational purposes only. It is not financial advice and should not be construed as a recommendation to buy, sell, or hold any financial instrument. Trading involves significant risk of loss and is not suitable for all investors. Past performance is not indicative of future results.
MA MACD BB BackTesterOverview:
This Pine Script™ code provides a comprehensive backtesting tool that combines Moving Average (MA), Moving Average Convergence Divergence (MACD), and Bollinger Bands (BB). It is designed to help traders analyze market trends and make informed trading decisions by testing various strategies over historical data.
Key Features:
1. Customizable Indicators:
Moving Average (MA): Smooths out price data for clearer trend direction.
MACD: Measures trend momentum through MACD Line, Signal Line, and Histogram.
Bollinger Bands (BB): Identifies overbought or oversold conditions with upper and lower bands.
2. Flexible Trading Direction: Choose between long or short positions to adapt to different market conditions.
3. Risk Management: Efficiently allocate your capital with customizable position sizes.
4. Signal Generation:
Buy Signals: Triggered by crossovers for MACD, MA, and BB.
Sell Signals: Triggered by crossunders for MACD, MA, and BB.
5. Automated Trading: Automatically enter and exit trades based on signal conditions and strategy parameters.
How It Works:
1. Indicator Selection: Select your preferred indicator (MA, MACD, BB) and trading direction (Long/Short).
2. Risk Management Configuration: Set the percentage of capital to allocate per position to manage risk effectively.
3.Signal Detection: The algorithm identifies and plots buy/sell signals directly on the chart based on the chosen indicator.
4. Trade Execution: The strategy automatically enters and exits trades based on signal conditions and configured strategy parameters.
Use Cases:
- Backtesting: Evaluate the effectiveness of trading strategies using historical data to understand potential performance.
- Strategy Development: Customize and expand the strategy to incorporate additional indicators or conditions to fit specific trading styles.
ADDONS That Affect Strategy:
1. Indicator Parameters:
Adjustments to the settings of MACD (e.g., fast length, slow length), MA (e.g., length), and BB (e.g., length, multiplier) will directly impact the detection of signals and the strategy's performance.
2. Trading Direction:
Changing the trading direction (Long/Short) will alter the entry and exit conditions based on the detected signals.
3. Risk Management Settings:
Modifying the position size percentage affects capital allocation and overall risk exposure per trade.
ADDONS That Do Not Affect Strategy:
1. Visual Customizations:
Changes to the color, shape, and style of the plotted lines and signals do not impact the core functionality of the strategy but enhance visual clarity.
2. Text and Labels:
Modifying text labels for the signals (such as renaming "Buy MACD" to "MACD Buy Signal") is purely cosmetic and does not influence the strategy’s logic or outcomes.
Notes:
- Customization: The indicator is highly customizable to fit various trading styles and market conditions.
- Risk Management: Adjust position sizes and risk parameters according to your risk tolerance and account size.
- Optimization: Regularly backtest and optimize parameters to adapt to changing market dynamics for better performance.
Getting Started:
-Add the script to your chart.
-Adjust the input parameters to suit your analysis preferences.
-Observe the marked buy and sell signals on your chart to make informed trading decisions.

Dynamic Bollinger Bands with Momentum and Volume (DBBMV)Overview
The Dynamic Bollinger Bands with Momentum and Volume (DBBMV) indicator enhances the traditional Bollinger Bands by dynamically adjusting their width and position based on momentum and volume. This provides a more responsive and context-aware indication of price volatility and potential reversals.
Key Features
Momentum Adjusted Bands: Adjusts the bands' width based on the momentum indicator, reflecting the rate of change in price.
Volume Weighted Bands: Further adjusts the bands based on trading volume to reflect market activity and price volatility.
Signal Alerts: Provides buy and sell signals based on price action relative to the dynamic bands, helping traders identify entry and exit points.
Customizable Parameters: Allows users to adjust the lookback period, momentum sensitivity, and volume weighting for personalized analysis.
How It Works
The DBBMV indicator starts with the traditional Bollinger Bands, which are calculated using a moving average and standard deviation of the selected price source. The width of these bands is then adjusted based on the momentum of the price, making them more sensitive to price changes. Further adjustments are made based on trading volume, which ensures that the bands accurately reflect current market conditions. This results in a set of dynamic Bollinger Bands that provide more nuanced insights into price volatility and potential reversals.
Usage Instructions
Identify Volatile Periods: Use the dynamically adjusted bands to identify periods of high and low volatility in the market.
Spot Reversals: Look for buy signals when the price crosses above the lower band and sell signals when the price crosses below the upper band.
Adjust Sensitivity: Customize the lookback period, momentum sensitivity, and volume weighting to fine-tune the indicator to your specific trading strategy and market conditions.
Enhance Analysis: Combine the DBBMV indicator with other technical analysis tools for a more comprehensive market analysis.
Volume Confirmation: Use the volume-weighted adjustments to confirm the strength of price movements and potential breakouts.
The Dynamic Bollinger Bands with Momentum and Volume (DBBMV) indicator provides traders with a powerful tool to understand market dynamics better and make informed trading decisions based on adjusted volatility and market activity.

Supertrend + BB + Consecutive Candles + QQE + EMA [Pineify]Overview
This indicator, developed by Pineify, is a comprehensive tool designed to assist traders in making informed decisions by combining multiple technical analysis methods. It integrates Supertrend, Bollinger Bands (BB), Consecutive Candles, Quantitative Qualitative Estimation (QQE), and Exponential Moving Averages (EMA) into a single, cohesive script. This multi-faceted approach allows traders to analyze market trends, volatility, and potential buy/sell signals with greater accuracy.
Key Features
1. Supertrend: Utilizes the Supertrend indicator to identify the prevailing market trend. It provides clear buy and sell signals based on the direction of the trend.
2. Bollinger Bands (BB): Measures market volatility and identifies overbought or oversold conditions. The script calculates the middle, upper, and lower bands, along with the Bollinger Band Width (BBW) and Bollinger Band %B (BBR).
3. Consecutive Candles: Detects sequences of consecutive bullish or bearish candles, providing signals when a specified number of consecutive candles are detected.
4. Quantitative Qualitative Estimation (QQE): Combines the Relative Strength Index (RSI) with a smoothing factor to generate buy and sell signals based on the QQE methodology.
5. Exponential Moving Averages (EMA): Includes both fast and slow EMAs to identify potential crossovers, which are used as buy and sell signals.
How It Works
- Supertrend: The Supertrend indicator is calculated using a factor and ATR length. It plots the trend direction and generates buy/sell signals when the trend changes.
- Bollinger Bands: The BB indicator calculates the middle band as a Simple Moving Average (SMA) of the closing prices. The upper and lower bands are derived by adding and subtracting a multiple of the standard deviation from the middle band.
- Consecutive Candles: This feature counts the number of consecutive candles that close higher or lower than the previous candle. When the count reaches a specified threshold, it generates a buy or sell signal.
- QQE: The QQE indicator smooths the RSI values and calculates the QQE Fast and QQE Slow lines. Buy and sell signals are generated based on the crossover of these lines.
- EMA: The script calculates fast and slow EMAs and generates buy/sell signals based on their crossovers.
How to Use
1. Inputs: Customize the indicator settings through the input parameters:
- Supertrend Factor and ATR Length
- BB Length
- Consecutive Candles Counting
- QQE RSI Length
- Fast and Slow EMA Lengths
- Enable/Disable Alerts for various signals
2. Alerts: Set up alerts for Supertrend, Consecutive Candles, and EMA crossovers. Alerts can be enabled or disabled based on user preference.
3. Visualization: The indicator plots the Supertrend, Bollinger Bands, and EMA lines on the chart. It also marks buy and sell signals with arrows and labels for easy identification.
Concepts Underlying Calculations
- Supertrend: Based on the Average True Range (ATR) to determine the trend direction and potential reversal points.
- Bollinger Bands: Utilizes standard deviation to measure market volatility and identify overbought/oversold conditions.
- Consecutive Candles: A method to detect momentum by counting consecutive bullish or bearish candles.
- QQE: Enhances the traditional RSI by smoothing it and using a dynamic threshold to generate signals.
- EMA: A widely used moving average that gives more weight to recent prices, making it responsive to market changes.
This indicator is a powerful tool for traders looking to combine multiple technical analysis methods into a single, easy-to-use script. By integrating these diverse techniques, it provides a comprehensive view of market conditions and potential trading opportunities.

BBTrend w SuperTrend decision - Strategy [presentTrading]This strategy aims to improve upon the performance of Traidngview's newly published "BB Trend" indicator by incorporating the SuperTrend for better trade execution and risk management. Enjoy :)
█Introduction and How it is Different
The "BBTrend w SuperTrend decision - Strategy " is a trading strategy designed to identify market trends using Bollinger Bands and SuperTrend indicators. What sets this strategy apart is its use of two Bollinger Bands with different lengths to capture both short-term and long-term market trends, providing a more comprehensive view of market dynamics. Additionally, the strategy includes customizable take profit (TP) and stop loss (SL) settings, allowing traders to tailor their risk management according to their preferences.
BTCUSD 4h Long Performance
█ Strategy, How It Works: Detailed Explanation
The BBTrend strategy employs two key indicators: Bollinger Bands and SuperTrend.
🔶 Bollinger Bands Calculation:
- Short Bollinger Bands**: Calculated using a shorter period (default 20).
- Long Bollinger Bands**: Calculated using a longer period (default 50).
- Bollinger Bands use the standard deviation of price data to create upper and lower bands around a moving average.
Upper Band = Middle Band + (k * Standard Deviation)
Lower Band = Middle Band - (k * Standard Deviation)
🔶 BBTrend Indicator:
- The BBTrend indicator is derived from the absolute differences between the short and long Bollinger Bands' lower and upper values.
BBTrend = (|Short Lower - Long Lower| - |Short Upper - Long Upper|) / Short Middle * 100
🔶 SuperTrend Indicator:
- The SuperTrend indicator is calculated using the average true range (ATR) and a multiplier. It helps identify the market trend direction by plotting levels above and below the price, which act as dynamic support and resistance levels. * @EliCobra makes the SuperTrend Toolkit. He is GOAT.
SuperTrend Upper = HL2 + (Factor * ATR)
SuperTrend Lower = HL2 - (Factor * ATR)
The strategy determines market trends by checking if the close price is above or below the SuperTrend values:
- Uptrend: Close price is above the SuperTrend lower band.
- Downtrend: Close price is below the SuperTrend upper band.
Short: 10 Long: 20 std 2
Short: 20 Long: 40 std 2
Short: 20 Long: 40 std 4
█ Trade Direction
The strategy allows traders to choose their trading direction:
- Long: Enter long positions only.
- Short: Enter short positions only.
- Both: Enter both long and short positions based on market conditions.
█ Usage
To use the "BBTrend - Strategy " effectively:
1. Configure Inputs: Adjust the Bollinger Bands lengths, standard deviation multiplier, and SuperTrend settings.
2. Set TPSL Conditions: Choose the take profit and stop loss percentages to manage risk.
3. Choose Trade Direction: Decide whether to trade long, short, or both directions.
4. Apply Strategy: Apply the strategy to your chart and monitor the signals for potential trades.
█ Default Settings
The default settings are designed to provide a balance between sensitivity and stability:
- Short BB Length (20): Captures short-term market trends.
- Long BB Length (50): Captures long-term market trends.
- StdDev (2.0): Determines the width of the Bollinger Bands.
- SuperTrend Length (10): Period for calculating the ATR.
- SuperTrend Factor (12): Multiplier for the ATR to adjust the SuperTrend sensitivity.
- Take Profit (30%): Sets the level at which profits are taken.
- Stop Loss (20%): Sets the level at which losses are cut to manage risk.
Effect on Performance
- Short BB Length: A shorter length makes the strategy more responsive to recent price changes but can generate more false signals.
- Long BB Length: A longer length provides smoother trend signals but may be slower to react to price changes.
- StdDev: Higher values create wider bands, reducing the frequency of signals but increasing their reliability.
- SuperTrend Length and Factor: Shorter lengths and higher factors make the SuperTrend more sensitive, providing quicker signals but potentially more noise.
- Take Profit and Stop Loss: Adjusting these levels affects the risk-reward ratio. Higher take profit percentages can increase gains but may result in fewer closed trades, while higher stop loss percentages can decrease the likelihood of being stopped out but increase potential losses.

Enhanced Reversal DetectionScript Description:
The "Enhanced Reversal Detection" indicator is a powerful tool designed to identify potential market reversals across various financial instruments. It incorporates a sophisticated algorithm that analyzes price action along with key technical indicators such as the Relative Strength Index (RSI), Bollinger Bands, and Moving Average (MA).
How to Use:
Adjustable Parameters: The indicator offers a range of adjustable parameters to cater to different trading preferences and market conditions.
RSI Length: Adjusts the length of the RSI calculation to fine-tune sensitivity.
Overbought Level: Sets the threshold for identifying overbought conditions on the RSI scale.
Oversold Level: Sets the threshold for identifying oversold conditions on the RSI scale.
Bollinger Bands Length: Determines the length of the Bollinger Bands calculation.
Bollinger Bands Multiplier: Adjusts the standard deviation multiplier for the Bollinger Bands, influencing band width.
Moving Average Length: Defines the length of the Moving Average calculation to capture trend direction.
Min Bars Between Signals: Sets the minimum number of bars required between consecutive reversal signals.
ADX Length: Adjusts the length of the Average Directional Index (ADX) calculation.
ADX Threshold: Defines the threshold value for ADX, serving as a filter for reversal signals.
Signal Generation: The indicator generates signals for both bullish and bearish reversals based on predefined criteria. A bullish reversal signal is triggered when the closing price exceeds the lower Bollinger Band and RSI falls below the oversold threshold. Conversely, a bearish reversal signal occurs when the closing price falls below the upper Bollinger Band and RSI surpasses the overbought threshold.
Alerts: Traders can opt to receive alerts for bullish and bearish reversal signals, enabling them to stay informed of potential trading opportunities even when away from the platform.
Publication Readiness:
To ensure readiness for publication in the TradingView public library, the script has been meticulously crafted and documented:
The code is extensively commented to provide clear explanations of parameters, calculations, and signal generation logic.
Best coding practices have been followed to enhance readability and maintainability.
Rigorous testing has been conducted to validate the accuracy and reliability of signal generation across various market conditions.
The script adheres to TradingView's guidelines and policies for script publication, ensuring compliance with platform standards and user expectations.
With its comprehensive features and user-friendly design, the "Enhanced Reversal Detection" indicator is poised to become a valuable asset for traders seeking to identify high-probability reversal opportunities in the financial markets.

Multi-Chart Widget [LuxAlgo]The Multi-Chart Widget tool is a comprehensive solution crafted for traders and investors looking to analyze multiple financial instruments simultaneously. With the capability to showcase up to three additional charts, users can customize each chart by selecting different financial instruments, and timeframes.
Users can add various widely used technical indicators to the charts such as the relative strength index, Supertrend, moving averages, Bollinger Bands...etc.
🔶 USAGE
The tool offers traders and investors a comprehensive view of multiple charts simultaneously. By displaying up to three additional charts alongside the primary chart, users can analyze assets across different timeframes, compare their performance, and make informed decisions.
Users have the flexibility to choose from various customizable chart types, including the recently added "Volume Candles" option.
This tool allows adding to the chart some of the most widely used technical indicators, such as the Supertrend, Bollinger Bands, and various moving averages.
In addition to the charting capabilities, the tool also features a dynamic statistic panel that provides essential metrics and key insights into the selected assets. Users can track performance indicators such as relative strength, trend, and volatility, enabling them to identify trends, patterns, and trading opportunities efficiently.
🔶 DETAILS
A brief overview of the indicators featured in the statistic panel is given in the sub-section below:
🔹Dual Supertrend
The Dual Supertrend is a modified version of the Supertrend indicator, which is based on the concept of trend following. It generates buy or sell signals by analyzing the asset's price movement. The Dual Supertrend incorporates two Supertrend indicators with different parameters to provide potentially more accurate signals. It helps traders identify trend reversals and establish trend direction in a more responsive manner compared to a single Supertrend.
🔹Relative Strength Index
The Relative Strength Index is a momentum oscillator that measures the speed and change of price movements. RSI oscillates between 0 and 100 and is typically used to identify overbought or oversold conditions in a market. Traditionally, RSI values above 70 are considered overbought, suggesting that the asset may be due for a reversal or correction, while RSI values below 30 are considered oversold, indicating potential buying opportunities.
🔹Volatility
Volatility in trading refers to the degree of variation or fluctuation in the price of a financial instrument, such as a stock, currency pair, or commodity, over a certain period of time. It is a measure of the speed and magnitude of price changes and reflects the level of uncertainty or risk in the market. High volatility implies that prices are experiencing rapid and significant movements, while low volatility suggests that prices are relatively stable and are not changing much. Traders often use volatility as an indicator to assess the potential risk and return of an investment and to make informed decisions about when to enter or exit trades.
🔹R-Squared (R²)
R-squared, also known as the coefficient of determination, is a statistical measure that indicates the proportion of the variance in the dependent variable that is predictable from the independent variable(s). In other words, it quantifies the goodness of fit of a regression model to the observed data. R-squared values range from %0 to %100, with higher values indicating a better fit of the model to the data. An R-squared of 100% means that all movements of a security are completely explained by movements in the index, while an R-squared value of %0 indicates that the model does not explain any of the variability in the dependent variable.
In simpler terms, in investing, a high R-squared, from 85% to 100%, indicates that the stock’s or fund’s performance moves relatively in line with the index. Conversely, a low R-squared (around 70% or less) indicates that the fund's performance tends to deviate significantly from the movements of the index.
🔶 SETTINGS
🔹Mini Chart(s) Generic Settings
Mini Charts Separator: This option toggles the visibility of the separator lines.
Number Of Bars: Specifies the number of bars to be displayed for each mini chart.
Horizontal Offset: Determines the distance at which the mini charts will be displayed from the primary chart.
🔹Mini Chart Settings: Top - Middle - Bottom
Mini Chart Top/Middle/Bottom: Toggle the visibility of the selected mini chart.
Symbol: Choose the financial instrument to be displayed in the mini chart. If left as an empty string, it will default to the current chart instrument.
Timeframe: This option determines the timeframe used for calculating the mini charts. If a timeframe lower than the chart's timeframe is selected, the calculations will be based on the chart's timeframe.
Chart Type: Selection from various chart types for the mini charts, including candles, volume candles, line, area, columns, high-low, and Heikin Ashi.
Chart Size: Determines the size of the mini chart.
Technical Indicator: Selection from various technical indicators to be displayed on top of the mini charts.
Note : Chart sizing is relative to other mini charts. For example, If all the mini charts are sized to x5 relative to each other, the result will be the same as if they were all sized as x1. This is because the relative proportions between the mini charts remain consistent regardless of their absolute sizes. Therefore, their positions and sizes relative to each other remain unchanged, resulting in the same visual representation despite the differences in absolute scale.
🔹Supertrend Settings
ATR Length: is the lookback length for the ATR calculation.
Factor: is what the ATR is multiplied by to offset the bands from price.
Color: color customization option.
🔹Moving Average Settings
Type: is the type of the moving average, available types of moving averages include SMA (Simple Moving Average), EMA (Exponential Moving Average), RMA (Root Mean Square Moving Average), HMA (Hull Moving Average), WMA (Weighted Moving Average), and VWMA (Volume Weighted Moving Average).
Source: Determines what data from each bar will be used in calculations.
Length: The time period to be used in calculating the Moving Average.
Color: Color customization option.
🔹Bollinger Bands Settings
Basis Type: Determines the type of Moving Average that is applied to the basis plot line.
Source: Determines what data from each bar will be used in calculations.
Length: The time period to be used in calculating the Moving Average which creates the base for the Upper and Lower Bands.
StdDev: The number of Standard Deviations away from the Moving Average that the Upper and Lower Bands should be.
Color: Color customization options for basis, upper and lower bands.
🔹Mini Chart(s) Panel Settings
Mini Chart(s) Panel: Controls the visibility of the panel containing the mini charts.
Dual Supertrend: Toggles the display of the evaluated dual super trend, based on the super trend settings provided below the option. The definitions for the options are the same as stated above for the super trend.
Relative Strength Index: Toggles the display of the evaluated RSI, based on the source and length settings provided below the option.
Volatility: Toggles the display of the calculated Volatility, based on the length settings provided below the option.
R-Squared: Toggles the display of the calculated R-Squared (R²), based on the length settings provided below the option.
🔶 LIMITATIONS
The tool allows users to display mini charts featuring various types of instruments alongside the primary chart instrument. However, there's a limitation: the selected primary chart instrument must have an ACTIVE market status. Alternatively, if the primary chart instrument is not active, the mini chart instruments must belong to the same exchange and have the same type as the primary chart instrument.
