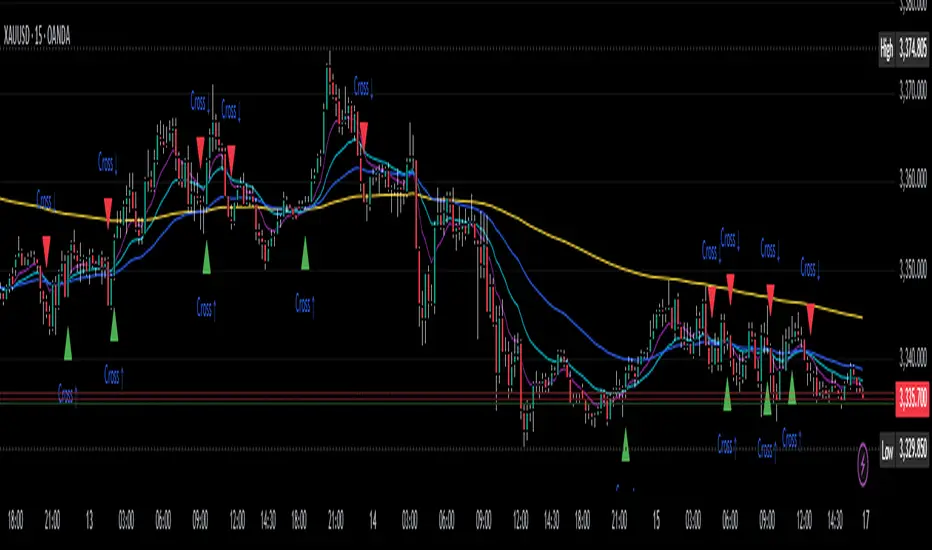
HeiKin Crossover With Alerts [Lofi]HeiKin LoFi - Crossover With Alerts
The goal of this indicator is to plot stoch, rsi, ema values "as if" the chart is a true price action based on a Heiken-Ashi Chart. It can also be used on a regular candle stick setting or the original Heikin Ashi chart.
The script is currently under development and additional updates will be added based on performance from a 24/7 active bot that is using this on 1hr, 4hr, 12hr time frames. The output may vary slightly between different chart time frames for the same indicator settings. A bad setting would be something like a sub 10-15 minute chart with BTCUSDT binance although some progress has been made on lower time frames. I have added an adjustable setting window for user tuning.
This is an "Invite Only" script. Contact me for details.
User Interface/Detail Description:
- Green Arrow = Buy
- Red Arrow = Sell
- Purple Arrow = High Risk Long
- Yellow Arrow= High Risk Short
This indicator can be easily used with popular bot trading platforms. Feel free to contact me for details.
Can be used for all Charts
Basic Entry Chart Layout:
BITMEX:
BINANCE:
FOREX:
I allow users to tune functions for almost any time interval. example 5 Second Chart:
在腳本中搜尋"bot"
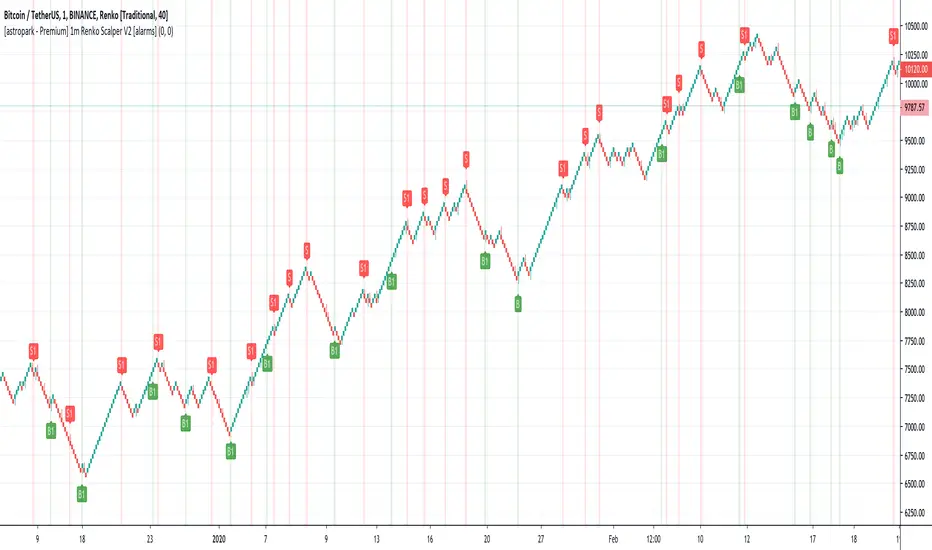
[astropark - Premium] 1m Renko Scalper V2 [alarms]Dear Followers,
today a new Scalper Tool , which works great on 1 minute timeframe , which is the best and more secure timeframe to use on a Renko chart, besides it works great up to 15m (I don't suggest to use a renko chart over 15m timeframe)!
It is an upgraded version of Bitmex Renko Scalper that you can find in my tradingview script page.
This tool has some cool features:
it works on 1 minute timeframe : so you can enjoy high-frequency trading by using a 24/7 running bot;
wait bricks optional mode : you may like to make script wait for triggering a new signal by waiting 1 or 2 more confirmation bricks
trailing stop : you can set a trailing stop in trade, so script will alert you if it will be reached in chart
This strategy can trigger till 5 buy or 5 sell signals in a row before reverting, so use a proper money management .
Strategy results are calculated on the timeframe from july to now, so on about 4 months, using 10000$ as initial capital and working at 3x leverage (very safe leverage!).
The user who wants to use this strategy, especially via an automated bot, must always set a stoploss at 5% from entry point or use a proper risk management strategy .
This is not the "Holy Grail", so use it with caution.
This script will let you set all notifications you may need in order to be alerted on each triggered signals.
The backtesting script version of this indicator, which will let you backtest this script and find best settings for your preferred market, can be found here below:
On Bitmex XBTUSD chart best settings is Traditional Renko chart with 10$ box size.
This is a premium indicator , so send me a private message in order to get access to this script .
TrendMaster ProTrendMaster Equilibrium X
TrendMaster Equilibrium X is a composite of TrendMaster, MokuMaster and KishokuMaster in one indicator. It is designed to be a drop-in replacement of our flagship indicator, TrendMaster, allowing the user to examine all three indicators on a single chart. The purpose of TrendMaster Equilibrium X is to provide a sentiment filter when assessing possible Trendmaster entries. When all three indicators align, we have equilibrium and can feel confident to take the trade. The indicator is optimised for weekly, daily and 4-hour candlesticks and can be used for all trending markets. It is exclusively available to our Pro tier members.
MokuMaster
MokuMaster is based on Ichimoku and its colours are derived from Ichimoku's depiction of trend conditions. When examining charts for directional bias you can simply check the colour of MokuMaster.
Bright Green - Resolutely Bullish
Green - Bullish
Blue - Neutral
Pink - Bearish
Red - Resolutely Bearish
These categories represent the interactions between Price, the Tenkan-sen, the Kijun-sen, the Kumo and the Chikou Span. This can be overwhelming if you are not an accomplished Ichimoku trader. MokuMaster allows you to view these interactions without the difficulty of interpreting what they mean.
KishokuMaster
KishokuMaster is a very simple indicator designed to provide an immediate representation of the ‘mood’ of the market. It provides an optimal balance of lag and smoothing to help traders establish a Bullish or Bearish bias. The underlying logic is based on Alan Hull's weighting techniques. KishokuMaster generally gives an early warning of a trend reversal.
Confluence
When assessing a TrendMaster entry, you can use TrendMaster Equilibrium as a simple checklist as shown in the annotated chart below. By taking entries that satisfy all criteria, you increase your likelihood of a successful outcome.
How to get it?
If you would like to use TrendMaster Equilibrium or any of our other Indicators, please visit my site. Here you can purchase one of our packages which include indicators, market scanner bots and a large Discord community. You will also find educational content and how to guides for our indicators.
Our Story
Founded in 2018 by IchimokuScholar and C00kie, TrendMaster is a team that produces technical analysis indicators with an emphasis on simplicity and noise reduction. We support a large community with educational content, automated market scanners and mentoring in our private chat rooms. We produce technical analysis indicators geared primarily towards the emerging Cryptocurrency asset class. We provide educational material to assist trader development and host a large online trend following community. All of our products are designed to help traders distinguish relevant information from background noise. Our indicators encourage disciplined trade management to maximise the opportunity captured while minimising losses.
IchimokuScholar
IchimokuScholar – In 2017 I retired from a career in higher education to focus on Trading. I like to trade long term trends, focusing primarily on continuation setups. I am dedicated to sharing my knowledge of trading and take great pleasure in simplifying technical analysis for newer traders.
C00kie
I started trading crypto in 2017 and immediately started coding a bunch of tools to improve my quality of life. Some definitely worked out better than others. Like to trade the higher timeframes and drawing horizontal lines on charts. I am also pretty much obligated to like cookies. Indicators. Here you can purchase one of our packages which include indicators, market scanner bots and a large Discord community. You will also find educational content and how to guides for our indicators.

Momentum Signal Moving AverageThis is a script with one modified indicator that mainly tracks and executes positions openings by calculating volume and "enthusiasm" from the exchanges coin pairs. I recommend that it is used on a 15m chart.
When it is a bullish trend it is configured to take profit, but this is of course something you can set values or disable. In bearish trends, the script opens bigger positions, and when a bounce happens the script starts taking profit.
In stagnation, the script used to be week, and made losses. However, with the added scalping feature it seems to at least even it out, or even make profit as I have seen now.
It's still a very 1.0 script and will get updated to make sure the profit keeps getting higher percentage.
I use the Alerts Trader extension to execute orders from Tradingview in Chrome via Bitmex API.
I use it on Bitmex, but surely you can use it on other exchanges that are supported in the Alerts Trader extension, which is extensive.
Important : You will be able to add this script to your chart, but you won't be able to se the source code, so to make it work you need to set the alerts right, with correct code for it to work.
Here is where I come in:
I'll give each user 3 day trial, and after that, if you are satisfied and want to run it longer, you can subscribe for $49/month.
And if you have bigger capital, I will install it and configure it to match the amount of contracts you wish to have.
If you are a person with big capital, you can get 1 week of trial.
And for people with big capital, you can get personal support from me when needed to alter settings or create new alerts. This will cost $50 each time.
But remember, you can also run the trial on the Bitmex testnet, but the volume is very low there so the bot does not preform as well on the testnet as it does on the mainet with big volume.
I am willing to let someone, a 3rd party, with good reputation test it for a few days and make an honest review after.
Disclaimer: I cannot guarantee that this script will make you rich, but after a week of testing, both on testnet and mainnet, the results are good enough for me. (I am no financial expert or professional trader. Any losses from the algorithm is not my issue, use it at your own risk. Always run the script/bot with money you can afford to lose)
All payments to me are made in bitcoin.

BitMEX Swing Trader MillionaireA bitcoin ATM machine on the 4hr
stick .25 bitcoin in an account set it up with an api bot like Autoview, alerts traders or even my very own api bot and avoid paying monthly sub..
ping me for details
Bert LONG BTC Study (Alerts) - Profit 2018: 1319 % (no leverage)Bert LONG Term BTC study (BITMEX) - script for setting alerts and trading bots
This is a revolutionary strategy for bitcoin (XBT) trading. The strategy is perfectly configured for trading on the Bitmex exchange. No further configuration and setup is required.
The strategy itself recognizes a volatile period or whether the market is in downtrend, uptrend or sideways. Accordingly, it applies the appropriate orders to reach maximum profit.
The strategy can be handled manually, you can receive alerts (popup, email, sms) or can be fully automated by bot (works with: Autoview, Gunbot, Profitview, Jubot and others) without any manual intervention.
What is the minimum and maximum capital I can trade with?
You can trade with 0.0001BTC – 1000BTC. That is one of many advantages of using this strategy on XBT. There is enough liquidity to execute the order for the market price with a big investment amount.
What is the recommended setting?
Timeframe: 45m
Chart: Bitcoin/USD Dollar Perpetual Inverse Swap Contract (XBT)
Leverage: 2x
Orders: Long and Shorts
Why was this strategy created?
You have basically two option how to make money in crypto market. HODL (buy the coin and believe it will rise to the moon) and TRADING (only 3-5% traders are profitable, most of them are full time traders with 5+ years of experience in trading).
If you HODL btc in this year, you are -70 % this year
If you are TRADING, the results depend on how good you are (think about this, if you decide to be a heart surgeon, rocket star or NBA player, do you think you can be? Yes, you can but the chances are very small. The same probability you have that you will be in the 3-5% profitable traders 😊). It takes time, you need experience and still 96% all of you will never be a profitable traders!
If you use Bert BTC long term strategy, you are + 1319 % this year
How well the Bert BTC strategy performs?
Profit in 2018 was 1319 % / 13x (without leverage)
Profit in 2018 was 11 477 % / 115x (with leverage 2)
If you invested (with leverage 2) 1 000 USD you have now 114 766 USD
If you invested (with leverage 2) 10 000 USD you have now 1 147 660 USD
Detailed trades report for 2018 (you can calculate your own profit with specific investments and leverage) – download excel here
Notes:
You will hardly find better strategy on the market which achieves similar results with minimal risk and can operate in any market condition (downtrend, uptrend, sideways).
We guarantee the strategy does not repaint, and we use real candles (not heikin ashi or renko which does not reflect real prices).
We wish you to become financially independent and all your secret wishes to be fulfilled.
And in case if you still want to HODL or you want to be TRADING all the days watching to your monitors, consider to try our strategy at least with a minimum capital invested, you will see that you will not regret in long run. Be patient and the money will come to you!
For access to this strategy visit website: www.cryptobert.io
inwCoin HMA AlertSimple alert to go along with the inwCoin HMA Strategy
Please not that the alerts are persistent 2.70% , if you already enter the position,
just ignore the rest of the same alert until the opposite alert show up
( long then short / or short then long , if change, just close and enter opposite position )
You can set the alert and let it tell you to iOS app via TradingView app ( yey! )
Please note that, if you don't have bot to track your trailing start/stop. you have to enter the TP/SL manually ( also tracking the position )
So... be careful to follow this alert. just try it with small amount of money first.
and make sure to set stop loss every time because OKEX is a portfolio killer if you don't have any stop loss.
** if you cannot trailing stop bot, just uncheck the "Aggressive Strategy" in both strategy and alert to reduce alert to minimum level.

Most Profitable HelloEpicWorld v2.0[Eric] This is the most profitable un-repaint fully support auto trading Algo on earth.
Usage:
Buy and Sell && Stop Loss
1. When it shows buy, you can buy it immediately or wait for a small dump to buy it, stop loss at the red cross below.(Both buy and stop signal support alert autoview bots auto trading)
2. When it shows sell, you can sell it immediately or wait for a small pump to sell it, stop loss at the green cross above.(Both buy and stop signal support alert autoview bots auto trading)
Background Color:
It can be turn on and off in the settings. When it is green, you have a 78% probability to get a win trade on buying the pullback. And a 73% probability to get a win trade on selling the pullback when it's red. So, even missed the buy and sell signal, you can still open a trade in the middle, but I don't recommend this kind of trades, it's no good for Risk/Reward ratio. The best ratio is when the signal show up. Background color is more suitable using to hold your trades after entering.
Forex:
Bitcoin:
Altcoin:
MarketSpeed:
RSIC:

MACs EasyMoney - LongTermSignalsIntroducing " MACs EasyMoney - LongTermSignals " Indicator. Specially designed for weekly and 1 Month duration charts . Picks the calls perfectly :)
Latest other updates:
BOT Trading Integration is completed for the following indicators,
1) MACs EasyMoney - Swing Trade Signals
2) MACs EasyMoney - Scalp Trade Signals
Strategy Test Report for the BOT script shows the following results,
* Profitable Percent = 99.42%
* Profitable Factor = 93.76
Thanks,
Mac.
Pharoceus PT-V2 CryptoScalper RSI+BB+SRSI+Stochastic IndicatorThis is the updated Version of the ProfitTrailerV2 RSI+BB+StochRSI+Stochastic Oscillator Signal+Alerts
Description
This is an all-in-one indicator with alerts that most people call signals and it's designed for Cryptocurrency leverage trading. This indicator features, the most popularly used indicators in technical analysis and are the basic technical analysis indicators any successful trader should master before going into more advance technical analysis tools. The Pharoceus ProfitTrailerV2 CryptoScalper RSI+BB+SRSI+Stochastic Oscillator Signal+Alerts features the Bollinger Bands, Relative Strength Index, Stochastic RSI and Stochastic Oscillator, and it was designed for use with Pharoceus ProfitTrailerV2 CryptoScalper and can also be used with all other trading bots or on its own as a powerful market leveraging and trading indicator using alerts.
The ProfitTrailerV2 RSI+BB+SRSI+Stochastic Oscillator Signal+Alerts can be customized to any trader specific trading patterns and offers the ability to choose a combination of indicators from the featured ones to use. With the Buy and Sell Signal feature, trading on any cryptocurrency exchange can be automated and with the alerts feature, the Pharoceus ProfitTrailerV2 CryptoScalper RSI+BB+SRSI+Stochastic Oscillator Signal+Alerts will automated buying and selling signals for any crypto trading bot but I'll always recommend using for making buys only when using with any bot. This indicator/script can be used with any base pair; BTC, ETH, and USD or USDT.
As mentioned above, all four indicators can be combined to find a very safe and secure buy and profitable sell signals, which maximizes your profit margins and overall earnings over time. Also, 2 or 3 could be combined as well, depending on the traders knowledge on how to use each indicator independently to find its best settings. My recommendation would be to test all independently and or together with very little capital to find what works best for you. I recommend this because the cryptocurrency market in a very volatile market and unpredictable, some combination of indicators would work for some certain coin pairs and not all, while others would work better with a different setting and a particular coin pair.
As with all script use at your own risk and only trade what you can afford to lose, while this indicator isn't designed to lose you money and I will not be held liable for any losses due to misuse. I am also not a financial advisor and the ProfitTrailerV2 RSI+BB+SRSI+Stochastic Oscillator Signal+Alerts will be made available soon as it's still undergoing rigorous testing and it's in no way and manner affiliated with any group of individuals or bot.
Trade Smart and with only what you can afford. Donations are also welcome to encourage my work, This is a totally free to use script to help traders, small time or big time that works towards making the indicator sharing world accessible to all who will not definitely be ripped-off and support a community of sharing.
discord.gg
BTC: 199qMzu4gvr3bUXWEpLG5uS6TEKKvw5pbe
ETH: 0xf8339952a224a228f2f8c58a5666a8ffleddebfb
BCH: qqmmds8u3f8m6ek387jtefg07525dvaxzqrshd86gz

ProfitTrailerV2 RSI+BB+SRSI+Stochastic Oscillator Signal+AlertsThis is an all-in-one indicator with alerts that most people call signals and it's designed for Cryptocurrency leverage trading. This indicator features, the most popularly used indicators in technical analysis and are the basic technical analysis indicators any successful trader should master before going into more advanced technical analysis tool. The ProfitTrailerV2 RSI+BB+SRSI+Stochastic Oscillator Signal+Alerts features the Bollinger Bands, Relative Strength Index, Stochastic RSI and Stochastic Oscillator, and it was designed for use with ProfitTrailer V2 and can also be used with all other trading bots or on its own as a powerful market leveraging and trading indicator using alerts.
The ProfitTrailerV2 RSI+BB+SRSI+Stochastic Oscillator Signal+Alerts can be customized to any trader specific trading patterns and offers the ability to choose a combination of indicators from the featured ones to use. With the Buy and Sell Signal feature, trading on any cryptocurrency exchange can be automated and with the alerts feature, the ProfitTrailerV2 RSI+BB+SRSI+Stochastic Oscillator Signal+Alerts will automated buying and selling signals for any crypto trading bot but I'll always recommend using for making buys only when using with any bot. This indicator/script can be used with any base pair; BTC, ETH, and USD or USDT.
As mentioned above, all four indicators can be combined to find a very safe and secure buy and profitable sell signals, which maximizes your profit margins and overall earnings over time. Also, 2 or 3 could be combined as well, depending on the traders knowledge on how to use each indicator independently to find its best settings. My recommendation would be to test all independently and or together with very little capital to find what works best for you. I recommend this because the cryptocurrency market in a very volatile market and unpredictable, some combination of indicators would work for some certain coin pairs and not all, while others would work better with a different setting and a particular coin pair.
As with all script use at your own risk and only trade what you can afford to lose, while this indicator isn't designed to lose you money and I will not be held liable for any losses due to misuse. I am also not a financial advisor and the ProfitTrailerV2 RSI+BB+SRSI+Stochastic Oscillator Signal+Alerts will be made available soon as it's still undergoing rigorous testing.

PT Magic Triggers So its me again. I have decided to create Trend Trigger Script for PT Magic addon for a trading bot Profit Trailer. If you do not own this bot and Addon the following explanation will not help you.
For each Trend you define number of minutes and it then calculates the percentage change between the close price now and X candles before.
Same calculation is for all 6 Triggers i beleive that is all you need :)
Hope it helps you all.
LTC: LYHj4WDN7BPu5294cSpqK3SgWSWdDX56Qt
BTC: 1NPVzeDSsenaCS9QdPro877hkMk93nRLcD

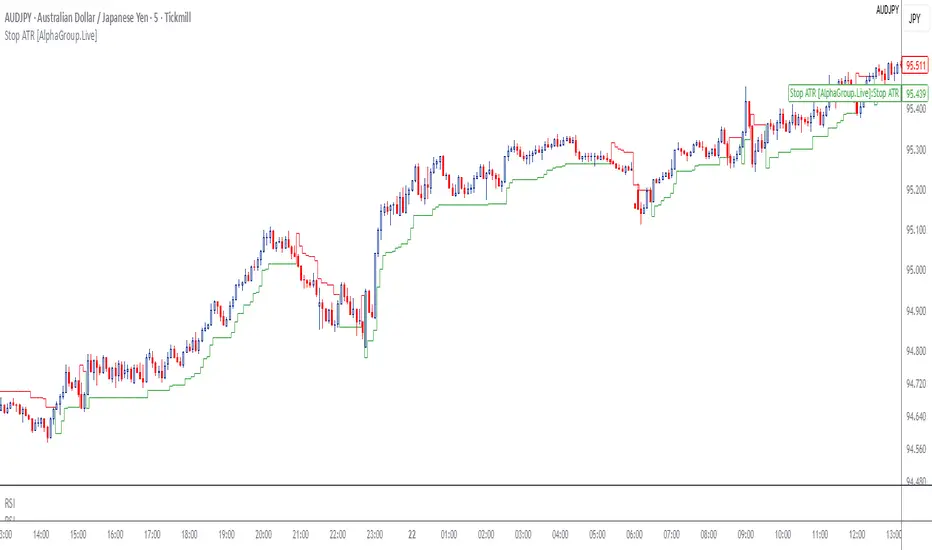
Stop ATR Indicator [AlphaGroup.Live]Tralling Stop tool! Perferct for Prop Firm Traders
The Stop ATR is a volatility-based trailing stop that adapts dynamically to market conditions.
It uses the Average True Range (ATR) to plot a continuous “stair-step” line:
• In uptrend , the stop appears below price as a green line, rising with volatility.
• In downtrend , the stop appears above price as a red line, falling with volatility.
Unlike fixed stops, the Stop ATR never moves backward . It only trails in the direction of the trend, locking in profits while leaving room for price to move.
Key features:
• ATR-based trailing stop that adapts to volatility.
• Clean “one line only” design — no overlap of signals.
• Adjustable ATR period and multiplier for flexibility.
• Color-coded visualization for quick trend recognition.
How traders use it:
• Manage trades with volatility-adjusted stop placement.
• Identify trend reversals when price closes across the stop.
• Combine with other entry signals for a complete strategy.
About us:
AlphaGroup.Live develops battle-tested trading systems and tools for real traders — indicators, bots, dashboards, and strategy manuals.
Visit alphagroup.live to get our free eBook: The Ultimate 100 Trading Strategies .
HiLo Stop Indicator [AlphaGroup.Live]Don't give your money back!
The HiLo Stop is a classic trend-following tool designed to keep trading simple and disciplined.
It plots a single continuous “stair-step” line that switches sides when the trend changes:
• In uptrend , the line appears below price as a green stop.
• In downtrend , the line appears above price as a red stop.
This indicator is commonly used as:
• A trailing stop to protect open profits.
• A trend filter to confirm buy/sell direction.
• A visual guide to avoid trading against the trend.
Key features:
• Clean “one line only” design — never plots both sides at once.
• Adjustable HiLo period for sensitivity control.
• Color-coded trend visualization for quick decision making.
How traders apply it:
• Take trades in the direction of the HiLo line.
• Place stop-loss orders at or near the line.
• Close or reverse positions when price closes across the stop.
About us:
AlphaGroup.Live develops battle-tested trading systems and tools for real traders — indicators, bots, dashboards, and strategy manuals.
Visit alphagroup.live to get our free eBook: The Ultimate 100 Trading Strategies .

Support Resistance Interactive Title: Support & Resistance Interactive PRO
Description:
This indicator allows traders to easily plot and customize up to 10 Support & Resistance levels with full flexibility.
Features include:
Choose between Zone or Line mode for each level.
Adjustable Zone Size (%) to control the width of each area.
Custom labels & names for every level (e.g., Call Entry, Bot Target, Take Profit).
Automatic price display on each level for better clarity.
Highlighted zones/lines with shadows for a more visual and professional charting experience.
This tool is designed for daily market analysis, making it easier to identify reaction levels, breakout points, and trading zones. Perfect for traders who want a clean, customizable, and visually attractive chart.
✍️ الوصف بالعربية (Arabic)
العنوان: مؤشر الدعم والمقاومة التفاعلي PRO
الوصف:
هذا المؤشر يساعد المتداولين على رسم وتخصيص حتى 10 مستويات دعم ومقاومة بكل سهولة ومرونة.
أهم الميزات:
إمكانية التبديل بين عرض المناطق (Zone) أو الخطوط (Line).
التحكم في حجم المنطقة (Zone Size %) لتكبير أو تصغير نطاق كل مستوى.
تخصيص أسماء لكل مستوى (مثل: نقطة دخول كول، هدف بوت، جني ربح).
عرض السعر تلقائيًا على كل مستوى لزيادة الوضوح.
مناطق وخطوط مميزة مع ظل بصري لزيادة احترافية الشارت.
هذا المؤشر مصمم من أجل التحليل اليومي للسوق، لمساعدة المتداول على تحديد مناطق الارتداد، الاختراقات، وأهم المستويات الفعّالة بشكل واضح ومرن.

Auto Entry/SL/TP Zones + Dashboard (Fib + MACD Filter)📊 Auto Entry/SL/TP Zones + Dashboard (with MACD Filter)
This indicator automatically builds Entry, Stop Loss, and Take Profit zones based on price action and Fibonacci extensions.
It also provides a dashboard with real-time market conditions and signals.
🔑 Features:
Automatic Zones:
Entry point is set when a trading signal appears.
Stop Loss is placed at the nearest local support/resistance.
Take Profit levels (TP1, TP2, TP3) are calculated using Fibonacci multipliers (0.618, 1.0, 1.618).
Signal Logic (Multi-confirmation):
✅ RSI (Relative Strength Index)
✅ SMA50 trend filter
✅ MACD confirmation (histogram & signal line alignment)
Dashboard Panel:
RSI value with dynamic color zones
Trend direction (Up / Down / Sideways)
Divergence (Bullish / Bearish)
Volume state (High / Low / Neutral)
MACD status
Final signal: LONG / SHORT / WAIT
Visual Objects on Chart:
Colored zones for Entry, Stop Loss, and TP levels
Labels with price levels (Entry, SL, TP1, TP2, TP3)
🎯 How to Use:
Wait for a signal (LONG or SHORT).
Zones (Entry, SL, TP1-TP3) will automatically appear on the chart.
Use the dashboard to confirm market conditions.
Enter only if RSI, Trend, and MACD confirm the same direction.
Manage your position using TP levels or add your own Trailing Stop.
⚠️ Notes:
Works on any timeframe and any market (Forex, Crypto, Stocks).
The strategy is not a trading bot – it’s an assistant to help identify optimal entries and exits.
Always combine with risk management and your own market analysis.
👉 If you like this tool – add it to favorites and use it in your trading setup! 🚀

KAMA Trend Flip - SightLing LabsBuckle up, traders—this open-source KAMA Trend Flip indicator is your ticket to sniping trend reversals with a Kaufman Adaptive Moving Average (KAMA) that’s sharper than a Wall Street shark’s tooth. No voodoo, no fluff—just raw, volatility-adaptive math that dances with the market’s rhythm. It zips through trending rockets and chills in choppy waters, slashing false signals like a samurai. Not laggy like the others - this thing is the real deal!
Core Mechanics:
• Efficiency Ratio (ER): Reads the market’s pulse (0-1). High ER = turbo-charged MA, low ER = smooth operator.
• Adaptive Smoothing: Mixes fast (default power 2) and slow (default 30) constants to match market mood swings.
• Trend Signals: KAMA climbs = blue uptrend (bulls run wild). KAMA dips = yellow downtrend (bears take over). Flat = gray snooze-fest.
• Alerts: Instant pings on flips—“Trend Flip Up” for long plays, “Down” for shorts. Plug into bots for set-and-forget domination.
Why It Crushes:
• Smokes static MAs in volatile arenas (crypto, stocks, you name it). Backtests show 20-30% fewer fakeouts than SMA50.
• Visual Pop: Overlays price with bold blue/yellow signals. Slap it on BTC 1D to see trends light up like Times Square.
• Tweakable: Dial ER length (default 50) to your timeframe. Short for scalps, long for swing trades.
Example Settings in Action:
• 10s Chart (Hyper-Scalping): Set Source: Close, ER Length: 100, Fast Power: 1, Slow Power: 6. Catches micro-trends in crypto like a heat-seeking missile. Blue/yellow flips scream entry/exit on fast moves.
• 2m Chart (Quick Trades): Set Source: Close, ER Length: 14, Fast Power: 1, Slow Power: 6. Perfect for rapid trend shifts in stocks or forex. Signals align with momentum bursts—check historical flips for proof.
Deployment:
• Drop it on any chart. Backtest settings to match your asset’s volatility—tweak until it sings.
• Pair with RSI or volume spikes for killer confirmation. Pro move: Enter on flip + volume pop, exit on reverse.
• Strategy-Ready: Slap long/short logic on alerts to build a lean, mean trading machine.
Open source from SightLing Labs—grab it, hack it, profit from it. Share your tweaks in the comments and let’s outsmart the market together. Trade hard, win big!
Volatility Zones (VStop + Bands) — Fixed (v2)📝 What this indicator is
This script is called “Volatility Zones (VStop + Bands)”.
It is an ATR-based volatility indicator that combines dynamic volatility bands, a Volatility Stop line (VStop), and volatility spike detection into a single tool.
Unlike moving average–based indicators, this tool does not rely on averages of price direction. Instead, it measures the market’s true volatility and reacts to expansions or contractions in price ranges.
________________________________________
⚙️ How it is built
The indicator uses several volatility-based components:
1. Average True Range (ATR)
o ATR is calculated over a user-defined length.
o It measures how much price typically moves in a given number of bars, making it the foundation of this indicator.
2. Volatility Bands
o Upper band = close + ATR × factor
o Lower band = close - ATR × factor
o The area between them is shaded.
o This gives traders an immediate visual sense of market volatility width — wide bands = high volatility, narrow bands = quiet market.
3. Volatility Stop (VStop)
o A stateful trailing stop based on ATR.
o It tracks the highest (or lowest) price in the current trend and places a stop offset by ATR × multiplier.
o When price crosses this stop, the indicator flips trend direction.
o This creates a dynamic stop-and-reverse mechanism that adapts to volatility.
4. Trend Zones
o When the trend is bullish, the stop is green and the chart background is shaded softly green.
o When bearish, the stop is red and the background is shaded softly red.
o This makes the market’s directional bias visually clear at all times.
5. Flip Signals (Buy/Sell Arrows)
o Whenever the VStop flips, arrows appear:
Green BUY arrows below price when the trend turns bullish.
Red SELL arrows above price when the trend turns bearish.
o These are also tied to built-in alerts for automation.
6. Volatility Spike Detection
o The script compares current ATR to its recent average.
o If ATR suddenly expands above a threshold, a small yellow “VOL” marker appears at the top of the chart.
o This highlights potential breakout phases or unusual volatility events.
7. Stop Labels
o At every trend flip, a small label appears at the bar, showing the exact stop level.
o This makes it easy to use the stop as a reference for risk management.
________________________________________
📊 How it works in practice
• When price is above the VStop line, the market is considered in an uptrend.
• When price is below the VStop line, the market is in a downtrend.
• The bands expand/contract with volatility, helping traders gauge risk and position sizing.
• Flip arrows signal when trend direction changes.
• Volatility spikes warn traders that the market is entering a higher-risk phase, often before strong moves.
________________________________________
🎯 How it may help traders
• Trend following → Helps traders identify whether the market is trending up or down.
• Stop placement → Provides a dynamic stop level that adjusts to volatility.
• Volatility awareness → Shaded bands and spike markers show when the market is likely to become unstable.
• Trade timing → Flip arrows and labels help identify potential entry or exit points.
• Risk management → Wide bands indicate higher risk; narrow bands suggest safer, tighter ranges.
________________________________________
🌍 In what markets it is useful
Because the indicator is based purely on volatility, it works across all asset classes and timeframes:
• Stocks & ETFs → Helps identify breakouts and long-term trends.
• Forex → Very useful in spot FX where volatility shifts frequently.
• Crypto → ATR reacts strongly to high volatility, helping traders adapt stops dynamically.
• Futures & Commodities → Great for tracking trending commodities and managing risk.
Scalpers, swing traders, and position traders can all benefit by adjusting the ATR length and multipliers to suit their trading style.
________________________________________
💡 Originality of this script
This is not just a mashup of existing indicators. It integrates:
• ATR-based Volatility Bands for context,
• A stateful Volatility Stop (adapted and rewritten cleanly),
• Flip arrows and labels for actionable trading signals,
• Volatility spike detection to highlight regime shifts.
The result is a comprehensive volatility-aware trading tool that goes beyond just plotting ATR or trend stops.
________________________________________
🔔 Alerts
• Buy Flip → triggers when the trend changes bullish.
• Sell Flip → triggers when the trend changes bearish.
Traders can connect these alerts to automated strategies, bots, or notification systems.

EMA Trend SuiteThe EMA Trend Suite is a trend-following tool built around a stack of four Exponential Moving Averages (EMAs): 9, 21, 51, and 200. It is designed to help traders quickly identify market bias, potential support/resistance zones, and directional momentum.
🔹 How it works:
EMA 200 – The Trend Boss
Price trading above EMA 200 → bullish bias is prioritized.
Price trading below EMA 200 → bearish bias is prioritized.
EMA 51 & EMA 21 – Dynamic Support & Resistance
These mid-range EMAs behave as adaptive support and resistance.
In bullish bias, pullbacks often respect EMA 21 or EMA 51.
In bearish bias, rallies often fail at EMA 21 or EMA 51.
EMA 9 – The Momentum Guide
The fastest EMA tracks short-term direction.
A clean break and hold beyond EMA 9 signals short-term momentum continuation.
EMA 9 crossing EMA 21 often signals the next move within the bias.
🔹 How to Trade It:
Identify the bias with EMA 200
Above EMA 200 = bullish bias.
Below EMA 200 = bearish bias.
Look for the trigger
In bullish bias: wait until EMA 9 crosses above EMA 21 → potential long signal.
In bearish bias: wait until EMA 9 crosses below EMA 21 → potential short signal.
Manage the trade with EMA 21 & 51
Price often bounces off EMA 21 and EMA 51.
In longs: if price starts closing below EMA 51, it’s often a warning to consider closing or reducing risk.
In shorts: if price starts closing above EMA 51, same idea — momentum might be weakening.
Ride momentum, don’t marry the trade
Sometimes price keeps trending strongly even after a close beyond EMA 51, but often it’s a sign of exhaustion. The suite is best used as a trend filter + timing tool, not a guaranteed entry/exit system.
🔹 Best Timeframes:
Gold, NAS100, US30, S&P500: Best results between 15M, 30M, and 1H.
Currency pairs (Forex): Best results on 1H, 4H, and Daily.
⚠️ Important Disclaimer:
This indicator is not a one-stop shop solution for trading.
It is not reliable in consolidations — EMA crossings can create false signals in sideways markets.
Always combine with other tools like candlestick patterns, market structure, or volume analysis.It should be seen as a guide to bias and momentum, not as a trading bot or automated strategy.
Arpitjainforex.com Trend DeciderHello All, This Indicator Helps you to identify if its going to be a Trending Day or A choppy Day.
Not sure if it can make huge profits, but will definitely save you from big losses when you enter revenge trading on a choppy day.
Decide if its trending or not, And Blindly Follow the Buy/Sell Bot on 5 min Timeframe to make best out of Trading.

Spice • Micro Suite (T/r & B/r)What it is
A single Pine v5 indicator that stacks:
EMA ribbon + a “special” EMA (11 vs 34) line that flips color on trend.
MTF-RSI “pressure” check with simple up/down arrows.
Bollinger-Band re-entry system with Top/Bottom triggers (T/B) and confirmations (r) in the next N bars.
Classic candlestick add-ons: 3-Line Strike and Leledc exhaustion dots.
Your Micro Dots engine (ATR-based regime + Variable Moving Average filter) + an optional VMA trend line.
Alerts for all the above.
Key signals (what prints on the chart)
EMAs (20/50/100/200): plotted faintly; EMA-34 is drawn and colored by the 11>34 trend.
RSI arrows
Checks RSI(6) on the current TF and (optionally) 5m/15m/30m/1h/4h/1D.
Down arrow: current RSI > 70 and the selected higher TF RSIs are also > 70 (pressure cluster just cooled; barssince(redZone)<2).
Up arrow: current RSI < 30 and selected higher TFs also < 30 (barssince(greenZone)<2).
Bollinger Reversals (your update)
T (Top trigger): first close back inside the upper BB (crossunder(close, upper)).
B (Bottom trigger): first close back inside the lower BB (crossover(close, lower)).
r (Confirm): within the next confirmBars bars (input), price also
closes below the T-bar’s low → top r above bar
closes above the B-bar’s high → bottom r below bar
Bar tinting
Only the T/B trigger bars are tinted (yellow/orange). Everything else stays your normal candle colors (unless you add the optional “trend candles” block I gave you).
3-Line Strike
Prints a small green/red circle when the 3-line strike pattern appears (bull/bear).
Leledc Exhaustion
Calculates a running buy/sell index; prints a small ∘ at major highs/lows when exhaustion conditions hit (major==-1 high, major==1 low).
Micro Dots (your second script, merged)
ATR “micro supertrend” defines regime (up/down).
A fast Variable Moving Average + a simple MA(18) filter.
Green dot below bar when: VMA < price, price > MA(18), regime up, and VMA not pointing down.
Red dot above bar for the bearish mirror.
Separate VMA trend line (length = Fast/Med/Slow) that colors green/red/orange by slope.
Inputs you’ll care about
Top/Bot Reversal → confirmBars (how many bars you allow to confirm the T/B trigger).
RSI Timeframes → toggle which HTFs must agree with the OB/OS condition.
EMAs → show/hide and lengths.
BB → show/hide basis/bands (used for T/B even if hidden).
Micro → show dots, show VMA line, choose intensity (Fast/Med/Slow).
Alerts
Prebuilt alerts for: RSI Up/Down, T/B triggers, T/B confirmations, 3-Line Strike bull/bear, Leledc highs/lows, EMA crosses (20/50/100/200), the special 11/34 trend change, Micro Dots, and VMA price cross. (Alert messages are const strings so they compile cleanly.)
How to read clusters (quick playbook)
Reversal short: see T on/near upper band → get an r within your window → bonus confidence if an RSI down arrow or Leledc ∘ high shows up around the same time.
Reversal long: mirror with B then r, plus RSI up arrow / Leledc ∘ low.
Continuation: ignore lone T/B if Micro Dot stays green (or red) and EMA-11 > EMA-34 remains true.
Why your candles look “normal”
By design, the script only colors bars on T or B trigger bars. If you want always-on trend candles, use the small block I gave you to color by EMA(20/50) (or any rule you like) and let T/B override on trigger bars.

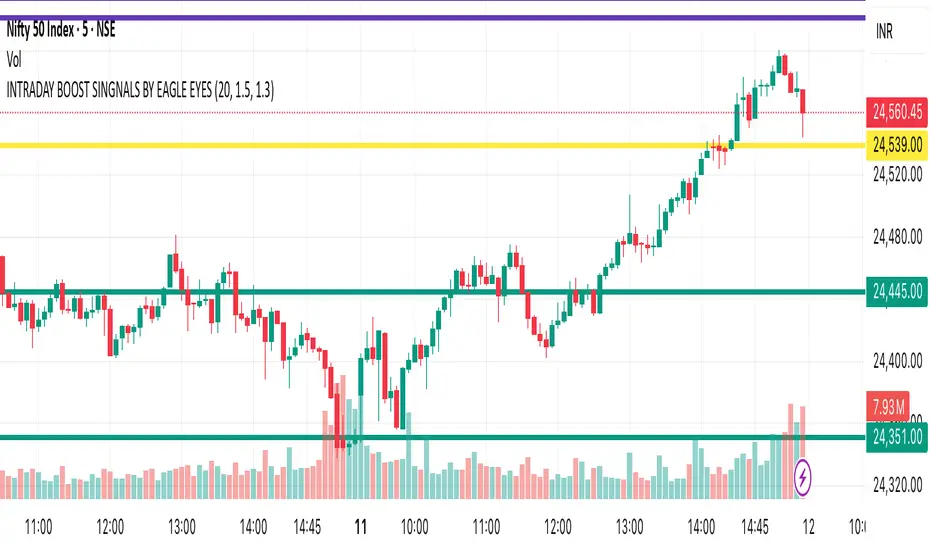
INTRADAY BOOST SINGNALS BY EAGLE EYESPurpose
Designed for short-term, high-activity traders who want quick trade entries and exits during market hours.
Likely focuses on momentum, volume spikes, and trend confirmation to catch intraday moves.
Key Features It Might Include
Signal Generation
Buy Signal: When upward momentum + volume surge + trend confirmation occurs.
Sell Signal: When downward momentum + high selling volume + trend reversal is detected.
Signals are probably marked with green arrows (buy) and red arrows (sell) on the chart.
Core Indicators Inside (probable)
Volume Filters: Detects strong participation behind the move.
Moving Average / EMA crossovers: Confirms short-term direction.
RSI / Stochastic: Filters out overbought/oversold traps.
Supertrend / UT Bot logic: Ensures signals follow a trend, not just noise.
Intraday Optimization
Works best on short timeframes like 1-min, 5-min, 15-min charts.
May include session filters so signals only trigger during active market hours.
Alerts
Configured so TradingView can send alerts for buy/sell signals in real-time.
Visuals
Arrows, colored bars, background shading for bullish/bearish momentum.
Possibly a dashboard showing trend strength, signal count, win ratio.
How It Helps Intraday Traders
Quick decision-making: Immediate visual and alert-based guidance.
Avoids overtrading: Filters false signals during sideways markets.
Momentum-based: Focuses on high-probability moves with strong backing.
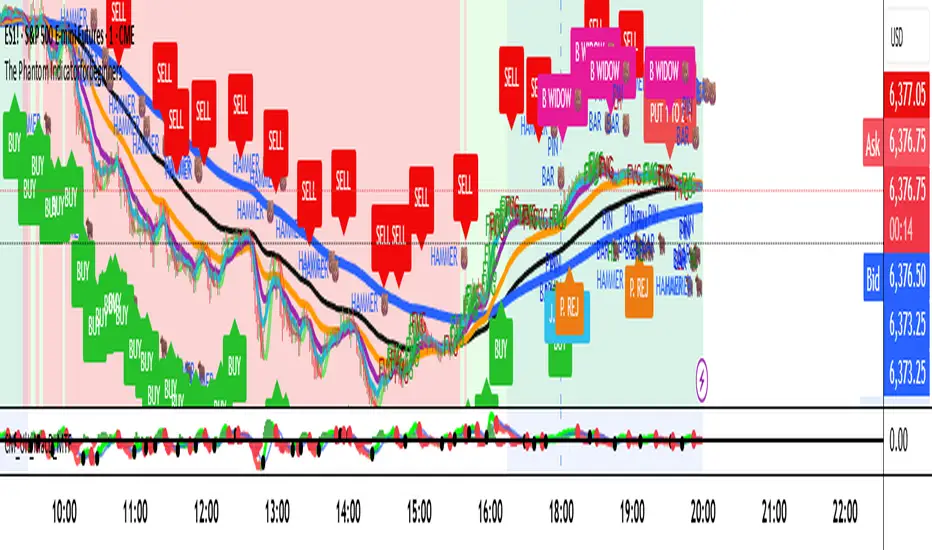
The Phantom Indicator for beginnersThe Phantom Indicator is an original software script written in Pine Script for use on the TradingView charting platform. It is designed as a real-time algorithmic trading and technical analysis toolkit that integrates multiple market signals into a unified framework. The work is a compilation of open-source trading concepts, modified and combined in a novel and proprietary manner, resulting in a unique educational tool.
Key features include:
Dynamic background shading based on price relation to the 200-period Exponential Moving Average (EMA)
Multi-timeframe Hull Moving Averages rendered as ribbons to show directional bias
A custom Fair Value Gap (FVG) detection algorithm
ATR-based trailing stop logic, inspired by UT Bot
Visual markers for candlestick rejection patterns, labeled “J. Wick” (bullish) and “Black Widow” (bearish)
Real-time structural pivot recognition, identifying Higher Highs, Lower Lows, and Break of Structure (BOS)
Interactive label alerts, trend-based visuals, and adaptive ribbon overlays
This indicator is intended to train beginner traders to:
Recognize candlestick reversal patterns
Understand trend creation and breakage
Learn to identify market direction using real-time, rule-based logic