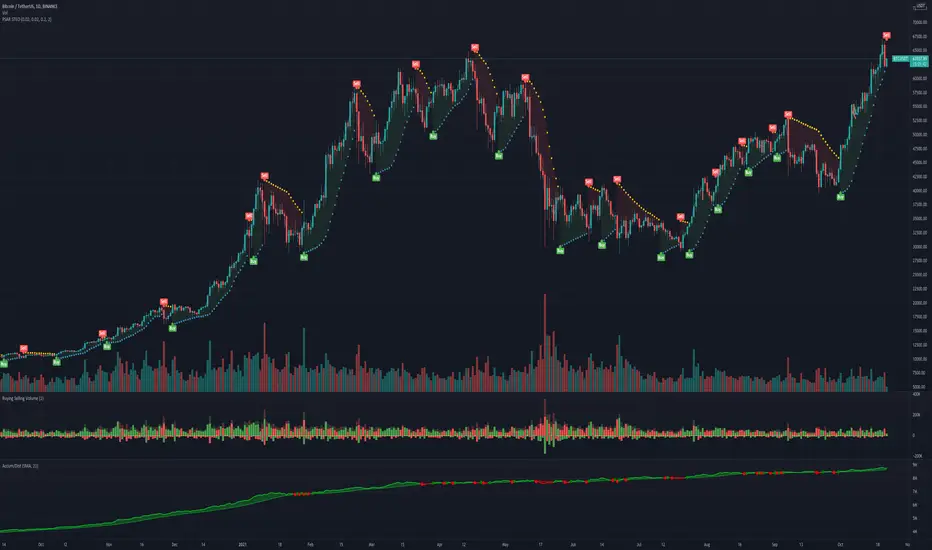
Nearest Percentile Moving Average BandsWhile coding some filters into another indicator for Long/Short I noticed that ta.nearest.percentile might be the most useful tool in pinescript I've ever encountered.
While percentile_nearest can be used for all kind of things I decided to code moving averages from it and made bands for bottom percentage and top percentage.
The indicator will calculate the top % price of the given bar length.
Example settings:
length: 150
percentile: 99
So when using 99% it will draw a green line when price is moving above the top 1% price of the last 150 candles. It then calculates if the price is below the bottom 1% of the last 150 candles.
Trading use:
Use this indicator to check if the market is leaving normal territory. This signals a breakout move for example the dogecoin pump or the top of the range. I use this indicator to catch bull/bear moves for botting purposes. An other use would be to countertrend trade after the move has ended. With price being in top 1% for a while it is very probable that we see a large correction.
Below example of dogecoin pumps:
在腳本中搜尋"bot"

DCA RSI Add funds exit simulatorThis script helps with planning on how to exit DCA deals that are in the negative.
The following deal information is required
- Current average position price
- Funds invested
- Required take profit
Additional indicator settings are
- The date/time on which to start the simulator
- Minimum deviation % to start adding funds
- Expected bounceback from when funds are added
The RSI trigger
Adding funds is triggered when the selected RSI settings yield a value that is at or beyond the selected threshold.
How it works
The amount of funds needed are calculated based on the supplied settings, such that the new average price matches the expected bounceback.
It will also show if the exit strategy has failed to hit the TP (this happens when the RSI threshold is hit again)

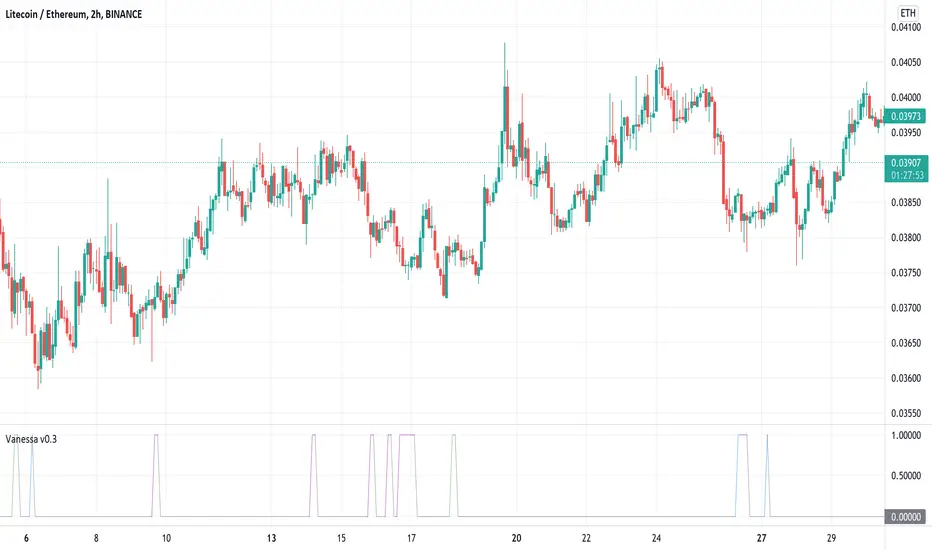
VanessaThis indicator transforms different oscillators to automated trade signals via alerts.
What is included:
Community Channel Index (CCI)
Money Flow Index (MFI)
Bollinger Bands (BB)
Select any or all sources
Change timeframe for the sources
Change threshold level for the sources
Add your Bot ID & Email Token
Select the volume to Add Funds
Backtest compatible
Alerts compatible
Description:
By combining multiple long timeframe Deal Start Conditions you increase the chance of recovering unsuccessful deals. Add this to your toolbox as a complement to the original Deal Start Conditions and Martingale-strategy for Dollar Cost Averaging your deals. The buy signals are accumulated and sent every time any of the chosen conditions are valid. This effectively dollar cost average your position every time the alerts are sent, lowering your average buy price. It is recommended to begin using this indicator with a low volume so you learn how this strategy affects your current deals. It can be useful on your red bags and put your reserve funds to use in an automated way, leaving your feelings on the sideline.
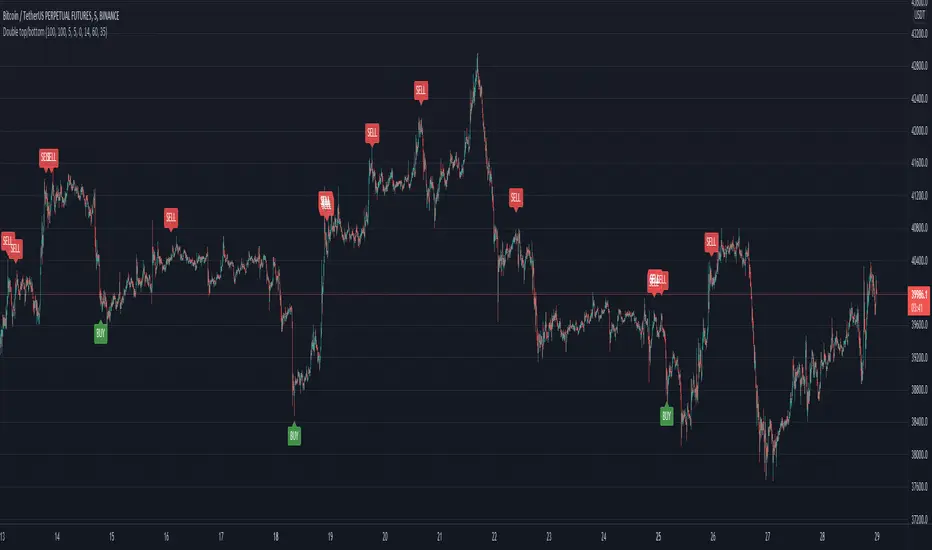
Double top/bottomHello!
This alerts is based on the double bottom pattern - for entering a long position / double top-short
A double bottom pattern is formed when two price bottoms are relatively at the same level and the top acts as resistance. This pattern appears at the end of a downtrend and signals a reversal.
A double top is a bearish reversal pattern that signals the end of an uptrend. It is formed by two price highs forming at the same level and a notch line that acts as local support.
As history and practice show, the double bottom pattern works better. Moreover, in a bull market.
// LOGIC ENTRY:
Period for short and long positions-to search for double bottom as well as double top . the more, the less false.
Change liong and short-channel width for pattern search separately for long and short.
General shift-the overall width of the channel, which changes equally at once for long and short
By default, quiet settings for 1 hour
You can choose the settings you like.
//FILTER SETTING
-RSI
If the checkbox is checked, the filter will be enabled.
The higher the upper bound, the less frequent short entries.
The lower the indicators of the lower border, the less frequent entries to the long
Heikin Ashi Trailing Stoploss ActivationThe Basics
This indicator should be used on regular candle sticks. It is possible to trigger an alert, when the block flips from red to green bar. Or vice versa.
Red block represents a red Heikin Ashi candle.
Green block for green Heikin Ashi candle.
It can be used as a trailing stoploss for (DCA/ TV) bots, when riding trends.
What Makes It Different
The user can preset the price (of the asset e.g. BTC), where it will start looking for Heikin Ashi flips. Every Heikin Ashi flip before this preset price will be ignored. Preset prices could be chosen tactically at resistance levels.
Different time frames of Heikin Ashi flips can be used together. E.g. 10 min, 3 hour or 2 Day time frames. If this is possible within your Tradingview subscription.
Example
The user has a long position (bought at the green arrow.) The user wants to start trailing at price 88 USDT (blue line).
The indicator will only trigger when the following conditions are met:
Cross of red block on the indicator (representing red Heikin Ashi candle)
Price has crossed 88 USDT
If the candlestick turns from a green to a red block, before crossing 88 USDT. It will NOT trigger the alert. Visible as the orange down arrows. In the indicator below it is displayed as a red block.The alert will go off at the red down arrow on 10th Nov (if chosen for Once per bar close). The price condition of 88 USDT was already met at 7th Nov.
Final Words
Disclaimer: Please use it with care and at own risk. The owner of this indicator is not liable for any financial losses.
Past performance is no guarantee of future returns.

Trailing Stoploss Bottom ActivationThe Basics
The indicator is visible on the chart as circles above and below the bar.
It will trigger an alert when the current price goes below, the low of the previous candle.
Or an alert when current price goes above, the high of the previous candle.
The indicator can be used as a trailing stoploss for (DCA/ TV) bots.
The distance between the circles and candlesticks can be adjusted. If the user prefers to set an alert e.g. a few ticks lower than the candle bottom.
What Makes It Different
The user can preset the price (of the asset e.g. BTC), where it will start looking for the condition: current price is below previous candle low (when in long position). Current price is above previous candle high (when short).
Example
In the chart above MATIC/BUSD the user has drawn a blue line at 1.70. Since there is where he expects resistance.
The user has a long position (bought at the green arrow.) The user wants to start trailing at price 1.70.
The alert will only trigger when the following conditions are met:
Condition 1 - Crossed 1.70
Condition 2 - Current candle price is below previous candle low.
In the chart above price crossed above 1.70 on 26th Oct. Current candle price (at that moment) went below previous candle low on 27th Oct, indicated with a red arrow. Here the alert will go off at 1.659 BUSD (indicated in pink).
It ignores the other two lows, indicated with orange arrows. Because condition 1 is not met.
It is possible to use multiple time frames at the same time. Some time frames might not be available depending on your Tradingview subscription.
Final Words
Disclaimer: Please use it with care and at own risk. The owner of this indicator is not liable for any financial losses.
Past performance is no guarantee of future returns.

Supertrend NinjaSupertrend Ninja
The Basics
The Supertrend Ninja is a trend-following indicator. The indicator is optimised for daily, 2 days and 3 days candlesticks and can be used on varying trending markets.
Supertrend Ninja using 2 days candlesticks only gave 7 bullish signals in 2020 and 2 in 2021 for Bitcoin/USDT (based on Binance charts). Greatly reducing false signals. It can be used on lower time frames as well, although you will encounter more noise.
This indicator could be used as a compass for DCA or TV bots as well.
What To Look For
When the background of the candlestick closes green with an upwards pointing pink arrow. It indicates a possible bullish (up)trend. To enter a trade its best to place an order a few ticks above the candle high. This way we only enter a position, when there is trend continuation.
When the background of the candlestick closes red with a downwards pointing black arrow. It indicates a possible bearish (down)trend. To enter a trade its best to place an order a few ticks below the candle low.
Exits can be determined by Fibonacci extensions, orderblocks or other resistances to name a few. Or exit the trade when the opposite background color appears.
Final words
Disclaimer: Please use it with care and at own risk. The owner of this indicator is not liable for any financial losses.
Past performance is no guarantee of future returns.

RSI Levels, Multi-TimeframeThe relative strength index (RSI) is a momentum indicator that measures the magnitude of recent price changes to evaluate overbought or oversold conditions. RSI is normally displayed as an oscillator separately from price and can have a reading from 0 to 100. This indicator takes the RSI and plots the 30 & 70 levels onto the price chart so you can see when price is going to meet the 30 or 70 levels. The reason the 30 & 70 levels are important is because many traders (and bots) use those as signals to buy (at 30 RSI) or sell (at 70 RSI). Additionally, this indicator allows you to display not just the RSI levels of your currently viewed timeframe on the chart, but also shows the RSI levels of up to 6 different timeframes on the same chart. This allows you to quickly see if multiple RSI levels are aligning across different timelines, which is an even stronger indication that price is going to change direction when it meets those levels on the chart. There are a lot of nice configuration options, like:
Style customization (color, thickness, size)
Labels on the chart so you can tell which plots are the RSI levels
Optionally display the plot as a horizontal line if all you care about is the RSI level right now
Toggle overbought (RSI 70) or oversold (RSI 30) on/off completely

WaveTrend 4h/24mWaveTrend 4h/24m is a trading tool based on two WaveTrend timeframes.
For this script the WaveTrend calculations made by LazyBear were used. WaveTrend is a widely used indicator for finding direction of an asset.
The strategy is developed by Youtuber Jayson Casper. The main strategy on the 4 hour and 24 minute timeframes, this will be the default timeframes. Timeframes can be adjusted in the indicator interface.
With Jaysons' we wait for both timeframes to have last printed a green dot for longs, and both timeframes to have last printed a red dot for shorts. When this occurs a green diamond will be printed for longs, a red diamond for shorts.
Make sure to always use the chart from the smallest timeframe you're using, so by defaults use the 24 minute chart.
Features of the indicator:
- WaveTrend Timeframe 1 (Blue/Lightblue wave).
- WaveTrend Timeframe 2 (Blue/Purple line with filled background between the lines).
- VWAP (Yellow wave which is turned off by default)
- Green/Red Diamonds
What to look for?
This script is all about the Green and Red Diamonds.
A Green diamond will be printed when on both the 4 hour and 24 minute timeframe the last printed dot was a green dot.
A Red diamond will be printed when on both the 4 hour and 24 minute timeframe the last printed dot was a red dot.
What are the Green and Red Diamonds based on?
When both VWAP timeframes are ABOVE 0, a green diamond will be printed. This is equivalent to the last dot on both WaveTrend timeframes being a green dot.
When both VWAP timeframes are BELOW 0, a red diamond will be printed. This is equivalent to the last dot on both WaveTrend timeframes being a red dot.
Happy Trading!

RSI Rising Crypto Trending AlertAlert version of the strategy with the same name
This is crypto and stock market trending strategy designed for long timeframes such as 4h+
From my tests it looks like it works better to trade crypto against crypto than trading against fiat.
Indicators used:
RSI for rising/falling of the trend
BB sidemarket
ROC sidemarket
Rules for entry
For long: RSI values are rising, and bb and roc tells us we are not in a sidemarket
For long: RSI values are falling, and bb and roc tells us we are not in a sidemarket
Rules for exit
We exit when we receive an opposite direction.
Cuation: Because this strategy uses no risk management, I recommend you takje care with it.
If you have any questions, let me know !

ProProfits LongStrategy made ready for automated trading based on Wavetrend/VWAP/RSI.
Whenever a 18 minute timeframe wave reaches below -60 is followed by a 3 minute timeframe VWAP cross up, a long signal will be given.
Once an RSI cross on the 10 minute timeframe above 60 is followed by a red dot on the momentum waves on the 1 minute timeframe, a Take Profit signal will be given.
The timeframes are adjustable in the settings interface, so this automated strategy can be used with any timeframe combination for the Wavetrend/VWAP/RSI.
Always make sure to view the chart from the lowest timeframe you're using.

SteO: PSAR with AlertSteO: PSAR with Alert, based on the existing PSAR but with constant long alerts for trading bots
Manuel Trading Starter Script For WunderbitTHIS CODE IS WRITTEN FOR WUNDERBIT TRADING
This script can be used for starting a position entry either it is long or short at any time by using alerts.
You need to setup your long and short alerts than pause them. When you decide to enter a position,
simply run the alert you are willing to open a trade either long or short from the alarms control panel.
The script immediately send the alert message to bot via webhook.
The close price must be greather than 0.0000000000001 to open a position.
Dont forget to turn off the alarm after entering the position. Or it will keep sending the alert message each candle.

Rolling VWAP - Vhunt Scalper botBINANCE:ADAUSDTPERP
Modified VWAP to use scalping in lower timeframe.
Use 1minute TF for best results but can also use up to 30min.
This indicator is made for crypto but may also work for other assets.
The bands serve as support and resistance and used for opening quick profit position if conditions below are met:
Indicators:
Blue - modified rolling vwap
Orange - Band1
Green - Band2
Opening position Conditions:
Long:
Band2 < Band1
Price < Band2
Short:
Band2 > Band1
Price > Band2

AI Crypto Signals BTCUSD 15m Ultimate ScriptBYBIT:BTCUSD
Hello everyone! Sky First Capital in partnership with AI Crypto Signals is proud to introduce the AI Crypto Signals 15M BTCUSD Ultimate Script . This script works well on the 15M, 30M, 45M and 1HR chart using traditional candles. This means no false data or inaccurate entry/exit points such as with the ones using HA candles.
The script is based upon an initial strategy developed by user Bunghole here on TradingView, but we have optimized it, back-tested it with ideal settings, and added alerts that you can use to connect with your trading bot such as Alertatron, Cornix, etc. This script uses BB (Bollinger Bands) and RSI (Relative Strength Index) as indicators for signals.
Back-testing data for the 15M chart from 7/1/2021 to 10/15/2021 showed a 51.19% profit.
Back-testing data for the 1HR chart from 7/1/2021 to 10/15/2021 showed a 191% profit.
This script does not repaint.
Ideal use is to enter and exit at the close of the candle and take-profit/stop-loss once per candle.
This script has Entry/Exit/Take-Profit/Stop-Loss alerts.
We offer consulting and training services if you need help on using this script or getting it configured with an automated trading system.
We offer a 24 hour free trial of the script, send us a message to request access.

Bjorgum AutoTrailOne Time Trade Risk Management
Incorporating the new interactive feature, this script is meant as a one time trailing stop for the active trader to manage positional risk of an ongoing trade. As a crypto trader or Fx trader, many may find themselves in a position late into the evening, or perhaps daily life is calling while a trade progresses in their favor. Adding a trailing stop to a position thats trending can help to keep you in the trade and lock in gains if things turn around when you are unable to react.
To use the trail, the user would add the script to the chart. Once added, a set of crosshairs will appear allowing the user to choose a point to begin. Often choosing to start a trail from a swing high/ low can be an ideal option. This tends to provide some protection for a stop by placing it under support for a long trade or above resistance for a short trade.
Price based trail
The trail will automatically plot and the offset is a factor of the distance from price action selected by the crosshairs. If placed above price action the script will plot a short trail, if placed below it will trail for a long position.
Additionally, there are several other trail types other than price based. There is also percent based, which offsets the trail as a percent from close. A hard stop is placed at the cross hair value, then once the distance is exceeded by the percentage specified, the trail begins.
There are 2 more volatility based trails. There is a PSAR trail which can provide quicker and tighter stops that accelerate with the trend locking in gains faster, and an ATR trail that keeps a distance from price action as a function of volatility. Volatility levels can be adjusted from the menu.
Volatility based trail (ATR)
Volatility based trail (PSAR)
Lastly, within the code for more the more technical savvy, is some starting setups for string alerts to be sent to exchanges via 3rd party or custom API applications. Some string manipulation is required for specific providers to meet their requirements, but there is some building block alerts that will take the ticker symbol, recognize the asset your trading (Fx, Crypto, etc) and take input quantity or exchange names from the settings via inputs.
Complex strings can be built to perform almost any trade related task when to comes to alerts via web hook. A little setup this way with some technology to back your system can mean a semi-automated half man, half machine setup that actually manages your trail stop while you cannot. For those that don’t go this far, there is some basic alert functionality that well trigger when a trail is hit so you can react and make a decision.
Please note that for now, interactive mode is engaged only when the script is added to the chart. Additional stops, or for adjustments to be made it is best to add a new version. Also as real trades could be at play managing an actual position, alerts are designed to go off only once to ensure no duplicate orders are sent meaning alerts are not reoccurring. Once an alert is triggered, a new trail is to be set up.
A modified version of the TradingView built in SAR equation was used in this script. To provide the value of the SAR on the stop candle, it was necessary to alter the equation to extract this value as the regular SAR “flips” at this point. Thank you to TradingView for supplying access to the built in formula so that this SAR could behave the same as the built-in function outside of these alterations
Example of SAR value maintained in trigger candle
Cheers and happy trading.

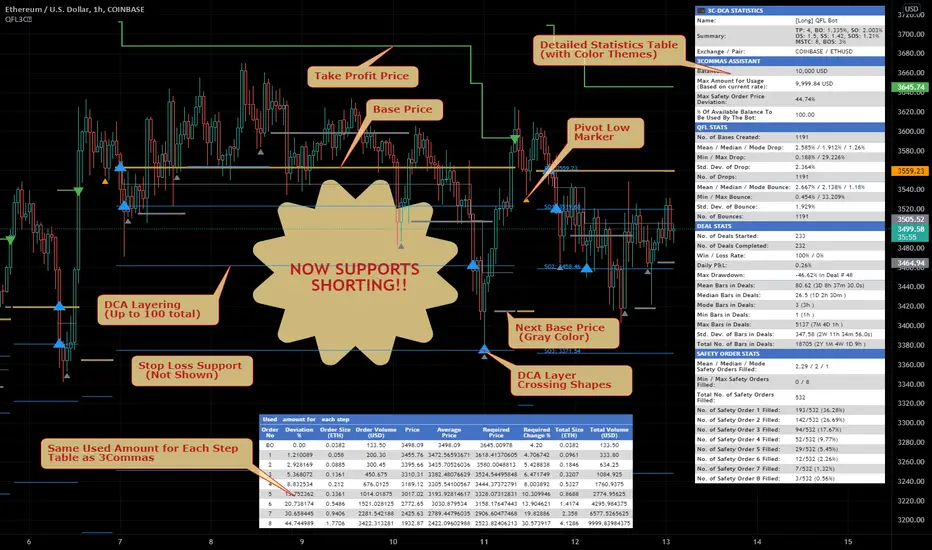
Quickfingers Lucs Base Breaking Indicator v2.5 - 3Commas EditionIntroduction
The indicator attempts to implement a popular price action strategy by Luc Thomas (a.k.a. Quickfingers Luc) typically referred to as a QFL base-breaking strategy specifically for the 3Commas platform. The Input settings have been redesigned to match the same inputs as the 3Commas My Bot Settings page. Only the "Deal Start Condition" section will echo the required QFL-related settings found in the original Quickfingers Luc's Base Breaking Indicator v2.5 to successfully implement the strategy.
The strategy revolves around price action movements that reveal “bases”, which are price levels of support that have a significant, rapid price surges called “bounces”. Once a base is revealed, the base price level is used as reference to implement multiple entries below the base using a layering technique of dollar-cost averaging to place multiple limit orders at various price levels below the base price. As price action breaks below the base price, the limit orders will be filled, and the take profit, breakeven and stop loss prices will be recalculated.
How is it original and useful?
This indicator is unique in that the strategy version fully supports the TradingView backtester, which will enable you to perform experiments with various settings to evaluate performance using the historical chart data. The study version implements the "Start Deal" and "Close Deal" alerts for you to integrate with 3Comma's "Trading View Custom Signal" start condition. Both script versions will provide the same configuration abilities. The following list is a brief description of its usefulness:
The ability to define the QFL base confirmation settings, including volume analysis.
The ability to define your preferred layering strategy of either dollar-cost averaging (DCA) or grid-like layers along with precise layer placement.
The ability to define your trading parameters like take profit and stop loss offsets, exchange commission rates, trading start time, and position size multiplication for each layer.
The ability to define flexible trade eligibility rules that can use other chart indicators, like RSI or EMA, to exclude the selection of base prices for trading.
The ability to set the visibility & color theme of the detailed statistics from the chart history pertaining to trading sessions started and closed, session durations, win rate, price action drops and bounces, as well as layer utilization.
How does it compare to other scripts in the Public Library?
The indicator offers a very detailed, comprehensive settings to implement the QFL base-breaking strategy ion 3Commas. The strategy version leverages the full features of the TradingView backtester to provide informative, detailed performance measurements surrounding this unique trading strategy. The study version will implement the latest alert framework called "Any Alert() Function" where you can create a single alert to handle multiple events, which include:
Deal Start
Deal Close
What does it do and how does it do it?
The strategy can be applied to any chart at any time frame, but the minimum should be no lower than 10 minutes. When applied to the chart for the first time, the default settings will work to render base price levels in orange and 8 DCA layers in thin blue lines. As you scroll through the chart's history you should see price action crossing the DCA layers, denoted with blue triangles, and a green take-profit line will render with green triangle denoting the crossing. Lastly, when a deal session begins upon the crossing of the first layer, the indicator will continue to identify base price levels, but the color of the price lines will be gray. When the trade session concludes upon the crossing of the take profit line, the indicator will switch the most recent base price line from gray to orange to make it active and eligible for trading.
As price action develops, the indicator will use the "Base Confirmation Settings" to look back by counting the number of bars to the left and right of a pivot low point, measure the price drops and bounces, and volume amounts to validate that they are within the specified values. If so, the indicator will draw an orange triangle beneath the candle bar to denote it as the pivot low point and begin rendering the orange line as the base price. The DCA layers will be calculated and offset relative to the base price using thin blue lines.
Optionally, the breakeven price line will be drawn to help visualize the true breakeven price which takes into consideration the exchange fees being applied. Base line, take profit, stop loss and DCA layer crossings will be denoted with colorful shapes to help visually recognize the events on the chart.
The volume is validated only at the pivot low candle. It will measure the volume against the moving average to determine base confirmation. A volume factor of 1 will mean that the volume must be at least the same value as the moving average value. A volume factor of 2 means it must be twice the moving average value.
Lastly, a table of statistics is positioned to the upper-right corner of the chart that summarize all the events that have taken place since the indicator began simulating deal sessions from the chart's history.
Strategy Results
The default settings are designed to define a "weak" QFL base to ensure that the indicator will render chart elements when first loaded as well as to allow the backtester to gather order executions and display performance summary. The strategy version is using $10,000 initial capital, a commission rate of 0.1% for both entries and exits, and a 1 tick slippage setting. It is also using 3.4881% of the equity for the Base Order Size, 4.7097% of equity for the first Safety Order Size. The Maximum Safety Trade Count is 7 with a Safety Order Volume Scale of 1.35, and a take profit of 5% with no stop loss. All other settings are defaults.
It is recommended that the indicator be "tuned" for your specific market in order to best implement the QFL trading strategy and obtain better desirable results. You do so by using the statistics table and observe the Mean Price Drop and Bounce values to learn what the indicator is detecting when it measures from the pivot low points. Using this information, you can adjust the Base Confirmation Settings accordingly, along with any volume specifications you require, to configure the indicator for the chart.
Always keep in mind that past performance may not be indicative of future results. Settings that seem favorable for one market may be found to be disastrous in another. Therefore, do take the time needed to understand how the settings will behave with the given chart symbol.
Enjoy! 😊👍
How to obtain access to the script?
You have two choices:
Use the "Website" link below to obtain access to this indicator, or
Send us a private message (PM) in TradingView itself.
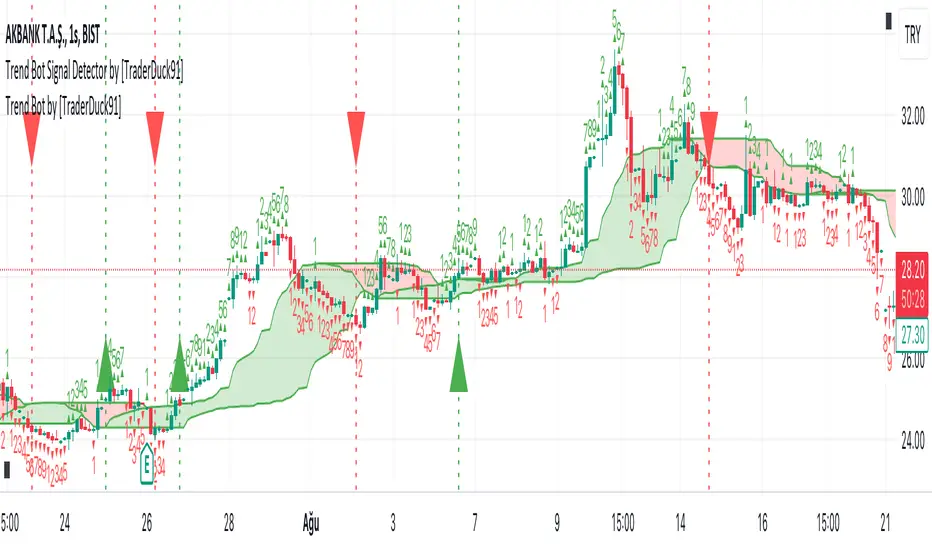
Trend Bot by [ToplaninKizlarUcuyoruz]Description:
1. Just a moving average strategy used in this indicator.
2. If the src2 (you can change it in settings) close above highest MA, appear the long signal.
3. And if the src2 close under the lowest MA, appear the short signal.
How is it using:
Green is an uptrend. Red is a downtrend.
-If you see the green up triangle signal, open long (and close short)
-If you see the red down triangle signal, open short (and close long)
*** Please check signals with your own strategy and your favorite indicators ***
inspired by the original open source indicator and added some new setting options:
(click on the image to open the original indicator's page)
RaBot V1.0.0Rabot is an indicator for new users as well as experienced users.
This indicator tries to predict both buy and sell signals. You can configure it for both scalping and swing trading.
It has two modes, one more "conservative", where the number of entries will be less than the other "greedy" mode.
Based on the famous and complex indicator "Koncorde" that combines both trend and volume knowing the manipulation of strong and weak hands, patterns, and crossing of emas customized by us; for example: a buy signal in conservative mode will only open if the trend is bullish and vice versa.
The user can configure the way they like by opening many positions or few but more secure based on their trading style.
The indicator also has the option to configure which chart we want to obtain the trend from, this is to avoid perhaps opening shorts in a very bullish trend line for example.
Rabot is a fairly complex indicator, which can be used for automatic use of inputs and outputs, as well as manual.
You also have the option of NOT opening a position if there is one currently open, and the option for the next signal to be the opposite of the last one.
5TPs, 1SL, and Breakeven after take profit achieved.
Finally version 1.0.0 is now available! :)
This version does not have backtesting (we have another that yes)
We are continuously working, testing and updating bugs and improvements.
Do not hesitate to get in touch for a feedback, it will be welcome and we will take it into account.

RaBot V1.0.0 - BacktestingRabot is an indicator for new users as well as experienced users.
This indicator tries to predict both buy and sell signals. You can configure it for both scalping and swing trading.
It has two modes, one more "conservative", where the number of entries will be less than the other "greedy" mode.
Based on the famous and complex indicator "Koncorde" that combines both trend and volume knowing the manipulation of strong and weak hands, patterns, and crossing of emas customized by us; for example: a buy signal in conservative mode will only open if the trend is bullish and vice versa.
The user can configure the way they like by opening many positions or few but more secure based on their trading style.
The indicator also has the option to configure which chart we want to obtain the trend from, this is to avoid perhaps opening shorts in a very bullish trend line for example.
Rabot is a fairly complex indicator, which can be used for automatic use of inputs and outputs, as well as manual.
You also have the option of NOT opening a position if there is one currently open, and the option for the next signal to be the opposite of the last one.
5TPs, 1SL, and Breakeven after take profit achieved.
Finally version 1.0.0 is now available! :)
This version contains backtesting with 5000 backbars to see if it is being profitable or not.
We are continuously working, testing and updating bugs and improvements.
Do not hesitate to get in touch for a feedback, it will be welcome and we will take it into account.

[ADOL_]HEART
ENG) Another, spin-off of ARVIS 4, the fourth version of ARVIS BOT. HEART
- Find the most suitable signal for swing trading and generate HEART ♥ notation. The heart signal is used as a swing branch point.
principle)
Features of the new core logic:
- The alert generation (error) of the HEART signal used in ARVIS 4 has been supplemented.
- Only the heart signal that was used in ARVIS 4 was extracted separately. It was created to be combined with the lightweight 4T version.
- We made the signal to be suitable for the concept of swing, excluding attempts to catch the highest and lowest points.
It is defined as marking a spot with a high probability of continuing the direction after the signal is generated with a heart.
option)
- The indicator plotting range indicates the range in which to display the indicator.
- You can set the background color to make the signal stand out.
- Added backtesting statistics. By correcting the part where the statistical label did not fully respond to the signal,
Statistical labels are displayed at the same location as Heart Long and Heart Short. You can view by checking the trade statistics label in the settings.
Backtesting is for reference only. The winning rate can be supplemented by using the trailing function and stop loss to increase the probability of real trading.
Example of principle of core function)
time frame)
- Available in all timeframes. Changing the timeframe does not change the display position.
The recommended timeframe is for the chart's timeframe to float by default. : 15 minutes, 1 hour.
alarm)
- You can set an alert for Heart Long and Heart Short.
trading method)
- Combine with ARVIS 4T.
- Follow the long downtrend and short uptrend as trend criteria.
reference)
You are solely responsible for any trading decisions you make.
How to use)
It is set to be available only to invited users. When invited, tap Add Indicator to Favorites at the bottom of the indicator.
If you click the indicator at the top of the chart screen and look at the left tab, there is a Favorites tab. Add an indicator by clicking the indicator name in the Favorites tab.
----------------------------------------------------------------------------------------------------------------------------------------------------------------------------------------------------------------
KOR) ARVIS BOT의 네번째 버전 ARVIS 4의 또 다른, 스핀오프입니다. HEART
- 스윙매매에 가장 적합성을 지닌 신호를 찾고 HEART ♥ 표기를 발생시킵니다. 하트시그널은 스윙분기점으로 활용합니다.
원리)
새로운 핵심적인 로직의 기능 :
- 기존에 ARVIS 4에서 사용하던 HEART 시그널의 얼러트 발생(오류)을 보완 하였습니다.
- ARVIS 4에서 핵심적으로 사용하던 하트 시그널만 따로 추출하였습니다. 경량화된 4T 버전과 결합하기 위해 만들어졌습니다.
- 최고점과 최저점을 잡기 위한 시도를 배제하고, 스윙의 개념에 적합성을 가지도록 신호를 만들었습니다.
신호발생후 방향이 지속될 수 있는 가능성이 높은 자리를 하트로 표기하는 것으로 정의합니다.
옵션)
- 지표 플로팅 범위는 지표를 표시할 범위를 나타냅니다.
- 배경색을 설정하여 시그널을 돋보이게 만들 수 있습니다.
- 백테스팅의 통계가 추가되었습니다. 통계 표시라벨이 시그널에 완전 대응하지 못했던 부분을 수정하여
하트롱과 하트숏의 위치와 동일하게 통계라벨이 표시됩니다. 설정에서 매매통계라벨을 체크하여 볼 수 있습니다.
백테스팅은 참고사항입니다. 실제 매매에 확률을 더 높이기 위해 트레일링 기능과 스탑로스를 활용하면 승률이 보완될 수 있습니다.
핵심기능의 원리 예시)
타임프레임)
- 모든 시간프레임에서 사용가능합니다. 시간프레임이 바뀌어도 표시하는 위치가 달라지지 않습니다.
추천의 타임프레임은 디폴트로 띄워둘 차트의 시간프레임에 대한 것입니다. : 15분, 1시간.
알람)
- 하트롱과 하트숏에 얼러트를 설정할 수 있습니다.
매매방법)
- ARVIS 4T와 결합하십시오.
- 내림롱과 오름숏을 추세 기준으로 따르십시오.
참고)
귀하가 내리는 모든 거래 결정은 전적으로 귀하의 책임입니다.
사용방법)
초대된 사용자만 사용할 수 있도록 설정이 되어있습니다. 초대를 받을 경우, 지표 하단의 즐겨찾기에 인디케이터 넣기를 누릅니다.
차트화면 상단에 지표를 눌러서 왼쪽탭에 보면 즐겨찾기 탭이 있습니다. 즐겨찾기 탭에서 지표이름을 눌러서 지표를 추가합니다.

Six Moving Averages Study (use as a manual strategy indicator)I made this based on a really interesting conversation I had with a good friend of mine who ran a long/short hedge fund for seven years and worked at a major hedge fund as a manager for 20 years before that. This is an unconventional approach and I would not recommend it for bots, but it has worked unbelievably well for me over the last few weeks in a mixed market.
The first thing to know is that this indicator is supposed to work on a one minute chart and not a one hour, but TradingView will not allow 1m indicators to be published so we have to work around that a little bit. This is an ultra fast day trading strategy so be prepared for a wild ride if you use it on crypto like I do! Make sure you use it on a one minute chart.
The idea here is that you get six SMA curves which are:
1m 50 period
1m 100 period
1m 200 period
5m 50 period
5m 100 period
5m 200 period
The 1m 50 period is a little thicker because it's the most important MA in this algo. As price golden crosses each line it becomes a stronger buy signal, with added weight on the 1m 50 period MA. If price crosses all six I consider it a strong buy signal though your mileage may vary.
*** NOTE *** The screenshot is from a 1h chart which again, is not the correct way to use this. PLEASE don't use it on a one hour chart.

TV signal for DCA backtestThis script allows you to backtest Trading View's "Technical Ratings" (Buy, Strong buy, Sell, Strong Sell) using Gavin's backtest script.
To use it add the backtest script to the chart together with this script and then from the back test settings connect the external indicator. You should select "TV Signal" as the source.
Backtesting works best on the 5m chart, but you can still change this script from its settings to higher timeframes.
Encoding
Buy is 1
Strong Buy is 2
Sell is -1
Strong Sell is -2
In the backtest script you can decide which rating you want to use for open deal and which one for close deal.
For example, if you were backtesting a long bot you could enter a long position when TV signal is Buy (1) and close the deal when TV signal is Sell (-1).
You have the full flexibility to decide which technical rating to use for your backtesting.
Enjoy!
