Pattern Recognition Pullback Strategy profit calculatorThis script has been designed for use in botting Crypto spot / futures.
The intended use is send signals to a 3commas bot setup for the exchange. The bot uses candle measuring percentile nearest rank filters and range
breakouts to decide if the market is trending. When the market is trending it will look for pullbacks below a moving average and buy in the trend direction on a pullback discount. This is the profit calculator part of the script
With this script you will not be able to send tradingview signals, that is because it is a payed premium service and for security reasons I am the only one with access to making signals from this script.
I provided a user manual:
drive.google.com
在腳本中搜尋"bot"

Grid Bot AutoThis script is an auto-adjusting grid bot simulator. This is an improved version of the original Grid Bot Simulator. The grid bot is best used for ranging/choppy markets. Prices are divided into grids, or trade zones, that will trigger signals each time a new zone is entered. During ranging markets, each transaction is followed by a “take profit.” As the market starts to trend, transactions are stacked (compare to DCA ), until the market consolidates. No signals are triggered above the Upper Limit or Below the Lower Limit. Unlike the previous version, the upper and lower limits are calculated automatically. Grid levels are determined by four factors: Smoothing, Laziness, Elasticity, and Grid Intervals.
Smoothing:
A moving average (or linear regression) is applied to each close price as a basis. Options for smoothing are Linear Regression, Simple Moving Average, Exponential Moving Average, Volume-Weighted Moving Average, Triple-Exponential Moving Average.
Laziness:
Laziness is the percentage change required to reach the next level. If laziness is 1.5, the price must move up or down by 1.5% before the grid will change. This concept is based on Alex Grover’s Efficient Trend Step. This allows the grids to be based on even price levels, as opposed to jagged moving averages.
Elasticity:
Elasticity is the degree of “stickiness” to the current price trend. If the smoothing line remains above (or below) the current grid center without reverting but still not enough to reach the next grid level, the grid line will start to curve toward the next grid level. Elasticity is added to (or subtracted from) the gridline by a factor of minimum system ticks for the current pair. Elasticity of zero will keep the gridlines horizontal. If elasticity is too high, the grid will distort.
Grid Intervals:
Grid intervals are the percentage of space between each grid.
Laziness = 4%, Elasticity = 0. Price must move at least 4% before reaching the next level. With zero elasticity, gridlines are straight.
Laziness = 5%, Elasticity = 100. For each bar at a new grid level, the grid will start “curve” toward the next price level (up if price is greater than the middle grid, down if less than middle grid). Elasticity is calculated by the user-inputted “Elasticity” multiplied by the minimum tick for the current pair (ELSTX = syminfo.mintick * iELSTX)
Try experimenting with different combinations of the Smoothing Length, Smoothing Type, Laziness, Elasticity, and Grid Intervals to find the optimum settings for each chart. Lower-priced pairs (e.g. XRP/ADA/DODGE) will require lower Elasticity. Also note that different exchanges may have different minimum tick values. For example, minimum tick for BITMEX:XBTUSD and BYBIT:BTCUSD is .5, but BINANCE:BTCUSDT and COINBASE:BTCUSD is .01.
s3.tradingview.com
DODGEUSDT, 5min. Laziness: 4%, Elasticity 2.5
Number of Grids: 2. Laziness: 3.75%. Elasticity: 150. Grid Interval 2%.
Settings Overview
Smoothing Length : Smoothing period
Smoothing Type : Linear Regression, Simple Moving Average, Exponential Moving Average, Volume-Weighted Moving Average, Triple-Exponential Moving Average
Laziness : Percentage required for price to move until it reaches the next level. If price does not reach the next level (up or down), the grid will remain the same as previous grid (because it’s lazy).
Elasticity : Amount of curvature toward the next grid, based on the current price trend. As elasticity increases, gridlines will curve up or down by a factor of the number of ticks since the last grid change.
Grid Interval : Percent between grid levels.
Number of Grids : Number of grids to show.
Cooldown : Number of bars to wait to prevent consecutive signals.
Grid Line Transparency : Lower transparencies brighten the gridlines; higher transparencies dim the gridlines. To hide the gridlines completely, enter 100.
Fill Transparency: Lower transparencies brighten the fill box; higher transparencies dim the fill box. To hide the fill box completely, enter 100.
Signal Size : Make signal triangles large or small.
Reset Buy/Sell Index When Grids Change : When a new grid is formed, resetting the index may prevent false signals (experimental)
Use Highs/Lows for Signals : If enabled, signals are triggered as soon as the price touches the next zone. If disabled, signals are triggered after bar closes. Enable this for “Once Per Bar alerts. Disable for “Once Per Bar Close” alerts.
Show Min Tick : If checked, syminfo.mintick is displayed in upper-righthand corner. Useful for estimating Laziness.
Reverse Fill Colors : Default fill for fill boxes is green after buy and red after sell. Check this box to reverse.
Note: The Grid Bot Simulator scripts are experimental and works in progress. Please feel free to comment or contact me if you have suggestions/complaints.

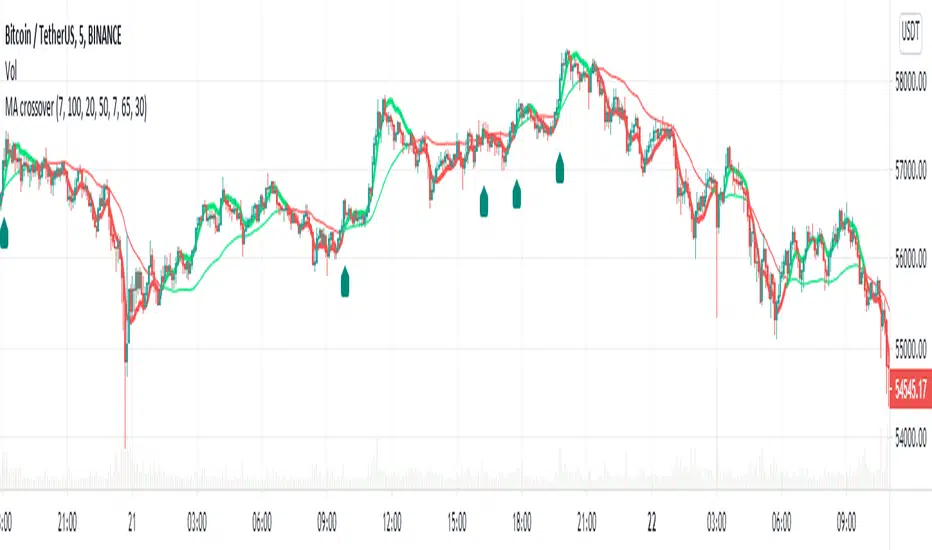
MA Crossover Alerts for Small Quick Profits on 3commas/DCA botDear fellow 3commas users,
This is a the most basic Moving Average crossover technique generating Buy Alerts.
This is especially written for those of you who want to link this basic crossover strategy with your 3commas DCA bot .
Buy Alerts
Moving averages available:
- Simple Moving Average (SMA)
- Exponential Moving Average (EMA)
- Weighted Moving Average (WMA)
- Hull Moving Average (HullMA)
- Volume Weighted Moving Average (VMWA)
- Running Moving Average (RMA)
- Triple Exponential Moving Average (TEMA)
Recommended settings for using with 3commas DCA bot:
Interval:
3m to 15m
3commas bot setup:
- TP/TTP: 0.3%/0.1%,
- Base Order: Your choice ,
- Safety Order: 1.2 * Base order
- Safety Order Volume Scale: 1.2,
- Safety Order Step Scale: 1.5,
- Max Active Deals: Your choice ,
- Price Deviation to Open Safety Order (% from initial order): 0.2%,
- Max Safety Trades Count: 7,
- Simulatenous Deals per Same Pair: 3
> Create Alert with Buy Alert and link it to your bot "Message for deal start signal"
Detect Sequential Trading - Bot DetectorDetect Sequential Trading - Bot Detector.
This tool requires access to volume data .
There are many trading bots out there, that trade 24/7 .
The detector can be used to understand how the bots are configured - to push the market up or down .
Alerts can be set to fire whenever a bot pattern is detected .
They must be configured to run Once per Bar .
It works well with range charts (1R) .
It would work best on 1 second charts or tick charts (currently, TradingView's alert system doesn't work with second charts).
The alternative would be 1 minute charts .
It can be used on higher timeframes but may be less effective.

BTCUSDTPERP MEGABOT 60min [ALERTS VERSION]BINANCE:BTCUSDTPERP
Hello, this is my alerts version of BTCUSDTPERP MEGABOT 60min
THIS BOT IS ONLY FOR BTCUSDTPERP ON BINANCEFUTURES !!!!!!!!!!!!!!!!!!!!!!!!!!!!!!!!!!!!!!!!!
This configs are only for this pair on this market,
It depends of volume , and others indicator
Bot is making amazing results at configs
TP - 4.5%
SL - 7%
Strategy using 4 indicators :
ADX
RSI
VOLUME
MACD
ADX - makes a solid view to trend without any scam wick :
Long only on green bars
Shorts only on red bars
That's helps my strategy to define a right trend
there is also a orange option for unidentified trends
RSI - value helps strategy to stop trade in right time
When RSI is overbought strategy don't open new longs
also when RSI is oversold strategy don't open new shorts
Volume - volume is the most important indicator for the strategy,
to avoid open trades on flat chart, new trades are open after a strong volume
wicks
MACD - this indicator is for define the trend
So the way this bot is working is simple
when every arguments are confirmed , then strategy open trades
Enjoy !!!

Simple and Sinister Scalp BotThis is a dollar cost averaging bot with additional buy algo to ensure you are buying support levels on the time period of your chart.
Signals Generated Based On
RSI
Volume
Cost Basis
Simple Moving Averages
It buys when there is a signal to buy and requires that the price is below your cost basis.
The bot is smart enough to track number of open signals and cost basis.
It features a safety shut off feature based on simple moving averages. This prevents you from opening new trades during market declines. The options are
No Filter
Safe
Safer
Safest
This does not generate a signal to sell based on an algorithm. This generates a sell signal based on your cost basis and open entries. It will not generate a sell signal unless it hit your target profit. The script will continue to DCA down until you are out of the hole. You can configure the Take Profit from the options menu.
The script generates labels in realtime and calculates current position profit and what your profit would have been if you used the bot from the start of the year with the settings set as they are in the options menu.
Authors Notes:
This was designed to work for both stocks and crypto.
Best time period to use it on varies depending on the ticker. Because it displays how much profit would be made in realtime, please adjust the settings/chart period and see what settings work best for that stock/crpto symbol. Please note that past performance does not dictate future results.

UT Bot AlertsUT Bot indicator was initially developer by @Yo_adriiiiaan
The idea of original code belongs @HPotter
These are v4 alerts for my previously published strategy:
Original script:

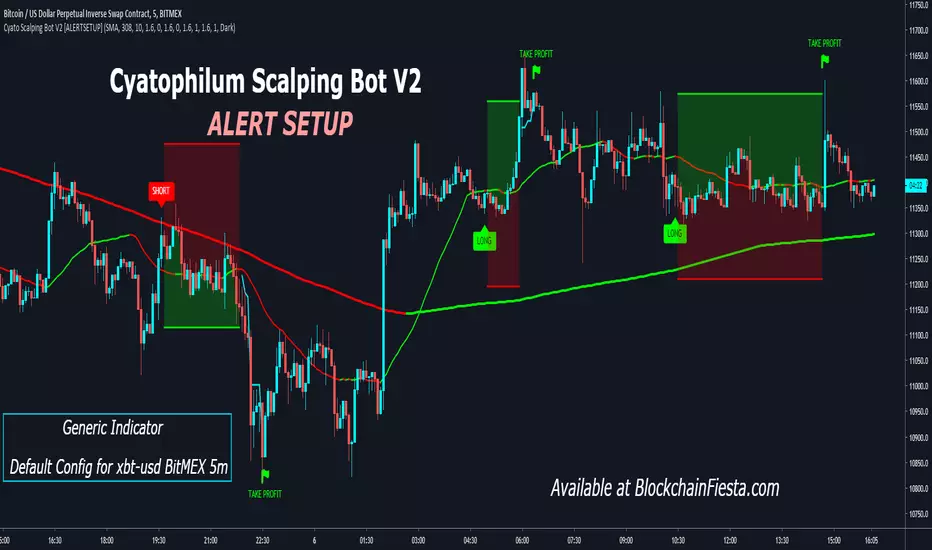
Cyatophilum Scalping Bot V2 [ALERTSETUP]Alert Setup version of Cyatophilum Scalping Bot V2.
Improved version of Cyatophilum Scalping Bot
Default settings for BITMEX:XBTUSD 5m
2% stop loss
2% trailing take profit
Release Notes: Added SMA, EMA and TEMA to the Trend Detector options.
ck - Inner Bars Indicator with Alerts and Trailing Stop v1*** Please check out the matching Strategy to accompany this Indicator to allow you to fully backtest! ***
Inner Bar trading strategy is where the "inside" bar (or candle to the right) within a pair is smaller and within the high to low range of the prior bar, as this pattern tends to be somewhat predictable; especially in "chop" or sideways trading, it is useful to have in your tool box.
Features include:
Complimentary strategy you can add as well as the indicator to backtest and tune your settings before live trading
Trailing Stoploss to wring every cent from a trade
Clear Alert labels have been coded in for use with trading bots, 3commas is recommended.
Enable/Disable Shorts in addition to Longs
Visual chart shapes - Pink Triangle = Long, Purple Triangle = Short, Thin Green Arrow = Profit, Thin Red Arrow = Loss
Realtime Deal Status - Plotlines include Yellow = Entry Price, Green = Trailing Stop Profit, Red - Hard Stoploss
A further feature is that you can disable Shorts (therefore only Longing) for use with exchanges
that only allow you to Long, such as Binance & Coinbase.
Additionally, this Indicator will close a trade before opening the next, so a single exchange
account (BitMEX for example) is all that is required versus having separate accounts to long or
short on the same chart.
This strategy is intended to use $100 of capital, traded at 2.5% per order with 10x lev on Bitmex.
If you like my work, please use my referral links (you will receive discounts!)
3commas trading bots (now with Bitmex support and a lot more!) - 3commas.io
BitMEX - www.bitmex.com
If you have any comments or suggestions, please message me via TradingView.
Based on the core "Inner Bars" concept found at:
backtest-rookies.com
with original inspiration/idea from babypips.com

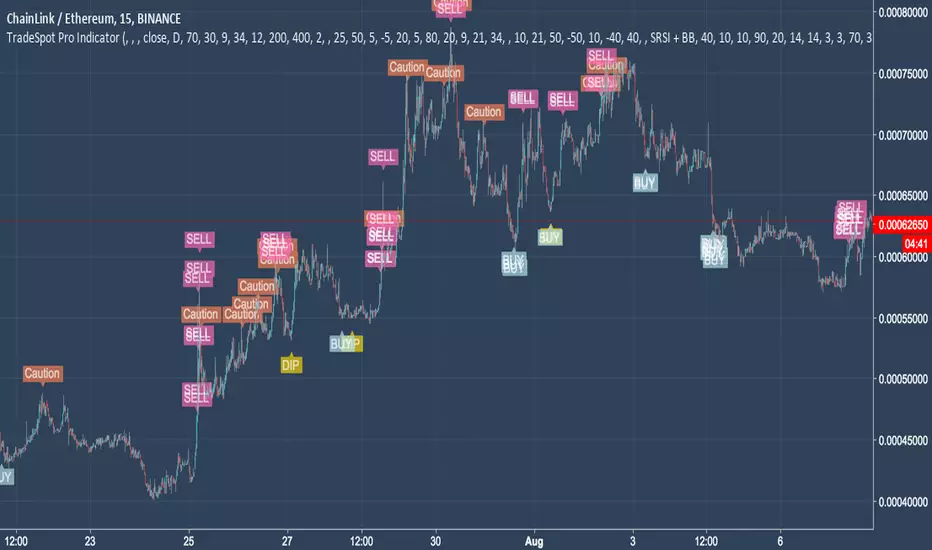
TradeSpot Pro || All Purpose Advanced Trading Indicator & AlertsTradeSpot Pro Indicator
Version: 1.0
TradeSpot Community Website
TradeSpot is a community of traders that specialise in using automated bots to execute spot & margin trading, you can join up via the above link where you too can discuss cryptocurrency, general trading, investments and get informed on the latest botting tools to enhance your day to day trading.
For an in-depth explanation and briefing on what this indicator is capable of, please contact me directly.
Features
Inclusion of all 4 highly regarded indicators previously used by the indicator and combined into one cross-functional powerhouse script sporting different strategies eg. EMA, RMI, RSI, BB based signals (and more!
Neat presentable UI for easily displaying the quality of your current settings.
Incredible customisation, one of the most heavily parameterised scripts on TradingView - this is not a plug and play solution but rather a script you can learn and tweak to really fine tune your strategy, ultimately improving results.
Big list of features listed on the community Discord server that will be developed and added to the indictor in good time (and a backtesting script!).
Combine indicators, a heavily asked for feature finally here - being able to match the signals between included indicators to create an even more robust trading signal.
Scripted with a full array of custom and alerts and more coming for use in manual trading endeavours to never miss a trade or for use with automated bot solutions that can be seen on the community site.
Access
Discord Server
For trial access please follow the link the server above and use the '!trial' command on the chat channel. If you don't use Discord please private message me on here.
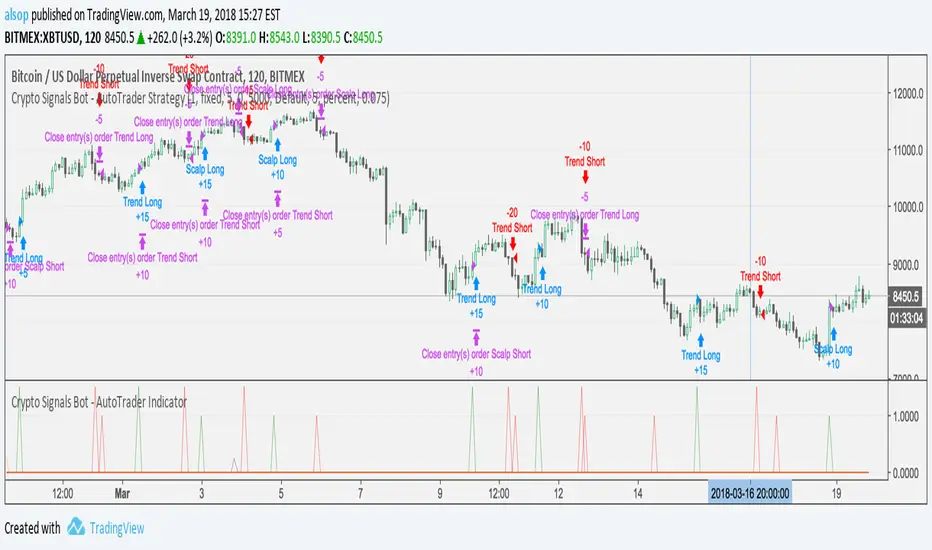
Crypto Signals Bot - AutoTrader IndicatorVery excited to release our new fully automated trading bot specifically for Bitcoin.
We use this system with AutoView to trade on Bitmex and it is specifically designed for Bitcoin on the 2 Hour charts.
It includes everything you will need:
AutoTrader Strategy
AutoTrader Indicator
All Alerts Syntax for AutoView
This has been producing amazing results and is a fully automated trading system that will take buys (long) and sells (short) on Bitcoin with supported crypto exchanges.
To signup, go to this URL: www.cryptosignalsbot.com
AMOGH smc bo/bd - Delta Bot IntegrationAMOGH SMC BO/BD – Delta Bot Integration ek advanced Pine Script indicator hai jo CHoCH ke baad breakout/breakdown (BO/BD) entries detect karta hai. Ye structure flip, SL, aur smart alerts ke sath auto-trading bots ke liye optimized hai. Entry precision aur exit logic strategy-grade hai.

HF Crypto Scalping BotHigh-Frequency Crypto Scalping Bot for ETHUSDT
This bot is designed for scalping ETHUSDT on a 1-minute chart using a blend of technical indicators and market structure logic.
🔍 Strategy Highlights:
Range Mode: Uses RSI and MFI to identify overbought/oversold zones near support/resistance.
Trend Mode: Detects MACD momentum combined with confirmed S/R breakouts.
Smart Risk Management: Dynamic stop loss and take profit based on risk:reward ratio.
Adaptive Market Logic: Automatically switches between trend and range conditions.
Real-Time Table: Displays RSI, MFI, MACD trend, market mode, entry/exit prices, and stop/target levels.
Visual Cues: Buy/Sell/Exit signals plotted directly on the chart with color-coded levels.
Alerts: Integrated long/short entry and exit alerts with live price and indicator values.
Customize the input parameters to fit your risk profile and asset volatility. Ideal for fast-paced scalping with dynamic conditions.

UT Bot + Cooldown + Visual FVGSynopsis – UT Bot + Cooldown + Visual FVG
This TradingView script combines:
✅ UT Bot Reversal Signals
Based on ATR and volatility logic
BUY when trend flips from bearish to bullish
SELL when trend flips from bullish to bearish
✅ Cooldown Filter
Limits signals to 1 per X bars (default 30)
Prevents overtrading during choppy price action
✅ Optional FVG Markers (Fair Value Gaps)
Visually shows bullish or bearish imbalances (3-bar gaps)
Does not affect signal generation — only for confluence
🔍 Ideal for traders who want clean, time-filtered signals with visual price-action context. Suitable for futures, crypto, or forex on intraday charts.

DCA Liquidation Calculation [ChartPrime]The DCA Liquidation Calculator is a powerful table indicator designed for both manual and bot-assisted traders who practice Dollar Cost Averaging (DCA). Its primary objective is to help traders avoid getting liquidated and make informed decisions when managing their positions. This comprehensive table indicator provides essential information to DCA traders, enabling them to plan their trades effectively and mitigate potential risks of liquidation.
Key Features:
Liquidation Price Awareness: The DCA Liquidation Calculator calculates and displays the liquidation price for each trade within your position. This critical information empowers traders to set appropriate stop-loss levels and avoid being liquidated in adverse market conditions, especially in leveraged trading scenarios.
DCA Recommendations: Whether you are executing DCA manually or using a trading bot, the DCA Liquidation Calculator offers valuable guidance. It suggests optimal entry prices and provides insights into the percentage deviation from the current market price, helping traders make well-timed and well-informed DCA decisions.
Position Sizing: Proper position sizing is essential for risk management. The DCA Liquidation Calculator helps traders determine the percentage of capital to allocate to each trade based on the provided insights. By using the recommended position sizing, traders can protect their capital and potentially maximize profits.
Profit and Loss Visualization: Gain real-time visibility into your Profit and Loss (PnL) with the DCA Liquidation Calculator. This feature allows you to monitor your trades' performance, enabling you to adapt your strategies as needed and make data-driven decisions.
Margin Call Indicators: Anticipating potential margin calls is crucial for maintaining a healthy trading account. The DCA Liquidation Calculator's smart analysis helps you identify and manage potential margin call situations, reducing the risk of account liquidation.
Capital Requirements: Before entering a trade, it's vital to know the required capital. The DCA Liquidation Calculator provides you with this information, ensuring you are adequately prepared to execute your trades without overextending your resources.
Maximum Trade Limit: Considering your available capital, the DCA Liquidation Calculator helps you determine the maximum number of trades you can enter. This feature ensures you maintain a disciplined and sustainable trading approach aligned with your financial capabilities.
Color-Coded Risk Indicators:
Green Liquidation Price Cell: Indicates that the position is considered safe from liquidation at the given parameters.
Yellow Liquidation Price Cell: Warns traders of potential liquidation risk. Exercise caution and monitor the trade closely to avoid undesirable outcomes.
Purple Liquidation Price Cell: Shows the liquidation price, but it does not necessarily indicate an imminent liquidation. Use this information to make prudent risk management decisions.
Red Row: Signals that the trade cannot be executed due to insufficient capital. Consider alternative strategies or ensure adequate capitalization before proceeding.
Settings explained:
In conclusion, the DCA Liquidation Calculator equips traders with essential tools to make well-calculated decisions, minimize liquidation risks, and optimize their Dollar Cost Averaging strategy. By offering comprehensive insights into your trading position, this indicator empowers you to navigate the markets with confidence and increase your potential for successful and sustainable trading.

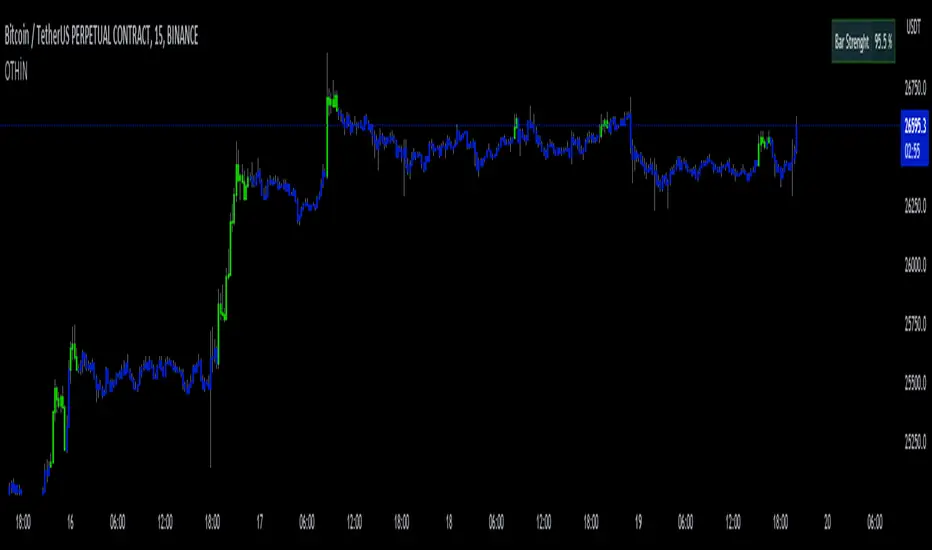
D-Bot Alpha All in One BarsThis indicator, known as "D-Bot Alpha All in One Bars," combines various technical analysis methodologies. It amalgamates a range of oscillator-based and moving average-based measures to determine the 'strength' or 'effectiveness' of a particular bar. This could potentially provide investors with an idea of the direction the market is moving.
Each indicator (such as RSI, Stochastic, WPR, MFI, CCI, ADX, RVI, and Volatility) measures a different market condition, and these conditions are combined to form an overall 'bar strength' value. This value is color-coded based on set threshold values (Lower Threshold and Upper Threshold) to indicate a bullish (green) and bearish (red) market condition.
4h
*The indicator works best on timeframes of 4 hours and below. For higher timeframes, you'll need to perform optimization.
The strength of this indicator lies in its ability to provide a broad market view by combining a range of analytical methods. However, its weakness is that each measurement carries equal weight, which can sometimes result in misleading signals.
15m
This indicator is typically used in conjunction with other technical analysis tools. For example, tools that provide a broader market structure, such as trend lines, support and resistance levels, or Fibonacci retracement levels, can be used alongside this indicator.
5m
An example trading strategy could involve monitoring the bar strength of the indicator and making buy trades during green (bullish) bars and sell trades during red (bearish) bars. However, as always, it's important to thoroughly test any trading strategy before implementing it.
***Please follow my profile to access indicators full of original ideas. Happy trading...
1m
Türkçe açıklama:
"D-Bot Alpha All in One Bars" indikatörü çok çeşitli teknik analiz metodolojilerini bir araya getiriyor. İndikatör, bir dizi farklı osilatör ve hareketli ortalama tabanlı ölçütü birleştirerek, belirli bir barın 'gücünü' veya 'etkililiğini' belirlemek için kullanılıyor. Bu, potansiyel olarak yatırımcılara marketin hangi yönde ilerlemek istediğine dair bir fikir verebilir.
Her bir gösterge (RSI, Stokastik, WPR, MFI, CCI, ADX, RVI ve volatilite gibi) kendi başına farklı bir piyasa durumunu ölçüyor ve bu durumlar birleştirilerek genel bir 'bar gücü' değeri elde ediliyor. Bu değer, belirlenen eşik değerlere (Lower Threshold ve Upper Threshold) göre renklendirilerek piyasada bir yükseliş (yeşil) veya düşüş (kırmızı) durumu gösteriyor.
Bu indikatörün güçlü yönleri, bir dizi farklı analitik yöntemi bir araya getirerek geniş bir piyasa görünümü sağlamasıdır. Ancak zayıf yanı, her bir ölçütün ağırlığının eşit olduğu ve bazen yanıltıcı sinyaller verebilecek olmasıdır.
Bu indikatör genellikle diğer teknik analiz araçlarıyla birlikte kullanılmalıdır. Örneğin, eğilim çizgileri, destek ve direnç seviyeleri veya Fibonacci retracement seviyeleri gibi daha genel piyasa yapısı araçları bu indikatörle birlikte kullanılabilir.
Örnek bir işlem stratejisi olarak, indikatörün bar gücünü gözlemleyebilir ve yeşil (yükseliş) barlar sırasında alım, kırmızı (düşüş) barlar sırasında satış yapabilirsiniz. Ancak, her zaman olduğu gibi, herhangi bir trade stratejisi belirlenmeden önce dikkatli bir şekilde test etmek önemlidir.
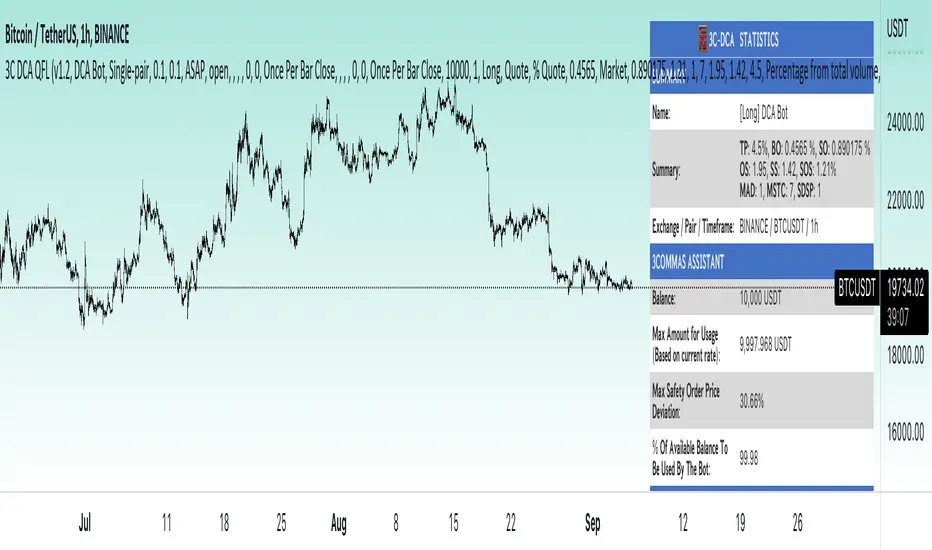
3Commas dollar cost averaging (DCA) QFL IndicatorAs investors, we often face the dilemma of willing high stock prices when we sell, but not when we buy. There are times when this dilemma causes investors to wait for a dip in prices, thereby potentially missing out on a continual rise. This is how investors get lured away from the markets and become tangled in the slippery slope of market timing, which is not advisable to a long-term investment strategy.
Skyrex developed a complex indicator based on dollar-cost averaging in Quick Fingers Luc's interpretation. It is a combinations of strategies which allows to systematically accumulate assets by investing scaled amounts of money at defined market cycle global support levels. Dollar-cost averaging can reduce the overall impact of price volatility and lower the average cost per asset thus even during market slumps only a small bounce is required to reach take profit.
The indicator script monitors a chart price action and identifies bases as they form. When bases are reached the script provides entry alerts. During price action development an asset value can go lower and in this way the script will perform safety entries alerts at each subsequent accumulation levels. When weighted average entry price reaches target profit the script will perform a take profit action alert.
Bases are identified as pivot lows in a fractal pattern and validated by an adjustable decrease/rise percentage to ensure significancy of identified bases. To qualify a pivot low, the indicator will perform the following validation:
Validate the price rate of change on drops and bounces is above a given threshold amount.
Validate the volume at the low pivot point is above the volume moving average (using a given length).
Validate the volume amount is a given factor of magnitude above is above the volume moving average.
Validate the potential new base is not too close to the previous range by using a given price percent difference threshold amount.
A fractal pattern is a recurring pattern on a price chart that can predict reversals among larger, more chaotic price movements. These basic fractals are composed of five or more bars. The rules for identifying fractals are as follows:
A bearish turning point occurs when there is a pattern with the highest high in the middle and two lower highs on each side.
A bullish turning point occurs when there is a pattern with the lowest low in the middle and two higher lows on each side.
Basic dollar-cost averaging approach is enhances by implementation of adjustable accumulation levels in order to provide opportunity of setting them at defined global support levels and Martingale volume coefficient to increase averaging effect. According to Quick Fingers Luc's principles trading principles we added volume validation of a base because it allows to confirm that the market is resistant to further price decrease.
The indicator supports traditional and cryptocurrency spot, futures , options and marginal trading exchanges. It works accurately with BTC , USD, USDT, ETH and BNB quote currencies. Best to use with 1H timeframe charts and limit orders. The indicator can be and should be configured for each particular asset according to its global support and resistance levels and price action cycles. You can modify levels and risk management settings to receive better performance
The difference between core script and this interpretation is that this strategy is specially designed for 3Commas bots
How to use?
1. Apply indicator to a trading pair your are interested in using 1H timeframe chart
2. Configure the indicator: change layer values, order size multiple and take profit/stop loss values according to current market cycle stage
3. Set up a TradingView custom alert using the indicator settings to trigger on a condition you are interested in
4. The indicator will send alerts when to enter and when to exit positions which can be applied to your portfolio using external trading platforms
5. Update settings once market conditions are changed using backtests on a monthly period
Argo I (alerts for 3commas single bots)This script lets users create BUY/SELL alerts for 3commas single bots in a simple way, based on a built in set of indicators that can be tweaked to work together or separately through the study settings. Indicators include Bollinger Bands, Williams %R, RSI, EMA, SMA , Market Cipher, Inverse Fisher Transform.
If the user choses to create both BUY and SELL signals from the study settings, the alert created will send both BUY and SELL signals for the selected pair. Note the script will only send alerts for the pair selected in the study settings, not for the current chart (if different).
How to use:
- Add the script to the current chart
- Open the study settings , insert bot details. Pairs MUST be in capital letters or 3commas will not recognize them.
- Still in the study settings, tweak the deal start/close conditions from various indicators until happy. The study will plot the entry / exit points below the current chart (1 = buy, 2 = sell)
- Ideally, test the settings with a backtesting script. The present script is compatible with the Trading Parrot's backtester.
- When happy, right click on the "..." next to the study name, then "Add alert'".
- Under "Condition", on the second line, chose "Any alert () function call". Add the webhook from 3commas, give it a name, and "create".
Happy tweaking!

Trend Bot Signal Detector by [ToplaninKizlarUcuyoruz]- This indicator working as a detector to receive my previous indicator's (Trend Bot, below) signals and appear all of the coins' signals in one table.
- You can also set alarms to receive notifications when signals.
- The indicator allow only 4 coins and four time intervals for each coins. (15 min - 1 hour - 4 hour - 1 day)
- You can add the indicator multiple times to keep track of coins more than 4 or track different exchanges.
** You can see a more descriptive page in my website. (Link is below and on my profile) **
The indicator (Trend Bot) which signals were received:
(you can also find more information about how it works, click on this chart picture)

TFi Simple Moving Average Bot V1 - PUBLICThe bot is using 2 moving averages for detecting the trend; the type of moving average is configurable; if the 2 moving averages are crossing it enters a long or short position. A stop-loss and profit-target can be configured; if reaching the profit-target, the bot is closing 50% (configurable) of the position, from this time on it is using a trailing-stop to close the position if the trailing-stop has been crossed.
The following moving-averages can be configured:
DEMA
EMA
HMA
RMA
SMA
TEMA
VWMA
WMA
Overview of features:
Optional stop-loss and profit-target/trailing-stop
Built-in backtesting engine with start balance, position size and pyramiding; each year will be evaluated separately
Inputs for a percentage entry and exit slippage, entry/exit and daily funding fees
Configurable alerts, which follow the exact position of the entry/exit marker
Alert messages contain predefined trading instruction to execute orders via TradeFab's proprietary trading server, which supports Alpaca-Markets, TD Ameritrade, Oanda, CCXT API's, or can be defined by the user
The script renders a performance/status table, which shows the current position status and result of the built-in trading simulation results. The following statistics are shown:
Current position PnL - also background turns green if position is in profit and red if in loss
Average entry price and number of positions
Current percentage distance to the optional stop-loss level
Current Maximum Draw Down
Number of wins and losses and the win/loss ratio per year and overall
Profit and loss amount, paid fees per year and overall
Profit-ratio and Maximum Draw Down per year and overall
Balance and ROI per year and overall

Dump AlertsNYSE:BRK.B
By popular demand: An inverted version of my first indicator Pump Alerts in Pine Script with two alert conditions for trading bots and automated stock trading setups.
It's originally based on "Pump Catcher" by @joepegler
I modified some parts, hopefully improved the usability and enabled alerts, so you can use it to trigger bots like 3commas via webhooks or stock brokers partnering with TradingView.
Dump Alerts 📉 attempts to detect moments of abnormal and accelerating increase in volume concurrent with falling prices AKA "dumps". Small and big dumps.
I recommend trying different timeframes and tinkering with the lookback period as well as both threshold values.
Other than that it's pretty self-explanatory and beginner-friendly.
Free and Open Source. Let me know how you use it!

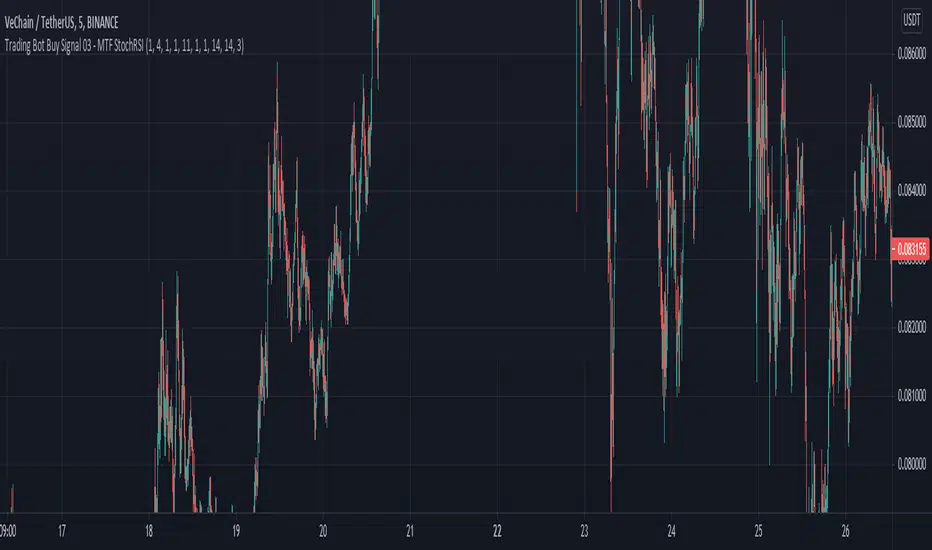
Trading Bot Buy Signal 03 - MTF StochRSIWelcome to our third Tradingview buy signal indicator.
We develop signals which have been specially developed for crypto trading bots. We publish new indicators at regular intervals.
This indicator is based on our "Trading Bot Buy Signal 03 Strategy - MTF StochRSI" strategy, so that you can apply and test this strategy to your charts/pairs.
The basic idea of this script is to use the stochastic RSI indicator in multiple Timeframes. When all selected timeframes show an oversold and in 5 Min Timeframe is an crossover, it triggers a solid buy signal. This strategy is relatively robust against false breakouts, even if these can of course never be avoided. These signals occur relatively rare, but you can set an alarm up on different pairs simultaneously. The strategy needs to be set up in 5 min chart cause of an additional crossover buy condition. It wasnt tested in Forex etc. but feel free to test it.
We recommend to base your sell strategy on trailing stop-loss and not indicator based. A traling stop-loss arming at 1% and trailing stop-loss percentage at 0.3% works well. Our goal was it to reduce the average coin holding time to a minimum. We recommend this procedure cause we believe in the power of long term uptrending crypto, compounding and dont want to sell at a loss in a false breakout. But you can handel it like you prefere.
This indicator using different timeframes so it is sending a repainting warning. Cause it calculates values in a different timeframe. But thats normal and it wont recalculate results.
Feel free to adjust the parameters to your preferences:
- Adjust the values of Stoch - K and Length of RSI and Main Stoch to change the sensitivity of the indicator
- Turn on different timeframes or leave default timeframes
- Adjust the oversold Limit of the StochRSI indicator to change results
We sell this indicator so it is invite only. But of cause you can test it before buying. Also you can freely test the strategy before. Simply check out our profil and look for "Trading Bot Buy Signal 03 Strategy - MTF StochRSI".
If there are questions, write them into the comments or contact us directly over the direct message. Happy Trading!
All-In-One Trading Bot Buy SignalsWelcome to our first Tradingview buy signal indicator.
We develop signals which have been specially developed for crypto trading bots. We publish new indicators at regular intervals.
At the moment our all-in-one indicator includes the following indicators:
- "Crypto Bot Signal 01 - Optimized RSI Momentum"
- "Trading Bot Buy Signal 02 - MTF Stochastic"
The basic idea of this all-in-one indicator is to decrease the needed number of alarms and to provide an all-in-one script for our users. You can freely choose which indicators you want to include into your signal generation. We only include indicators which are relatively robust against false breakouts, even if these can of course never be avoided. These signals alone occur relatively rare, but you can set an alarm up on different pairs simultaneously. The strategy works best in 5 min chart and in crypto pairs. It wasnt tested in Forex etc. but feel free to test it, with the published strategies.
We recommend to base your sell strategy on trailing stop-loss and not indicator based. A traling stop-loss arming at 1% and trailing stop-loss percentage at 0.3% works well. Our goal was it to reduce the average coin holding time to a minimum. But of cause you can adjust it to your needs and test it before with the help of our strategies. We recommend this procedure cause we believe in the power of long term uptrending crypto, compounding and dont want to sell at a loss in a false breakout. But you can handel it like you prefere and set your own sell alarms.
We sell this indicator so it is invite only. But of cause you can test the single indicators before buying. Also you can freely test the strategies before. Simply check out our profil for it.
If there are questions, write them into the comments or contact us directly over the direct message. Happy Trading!
