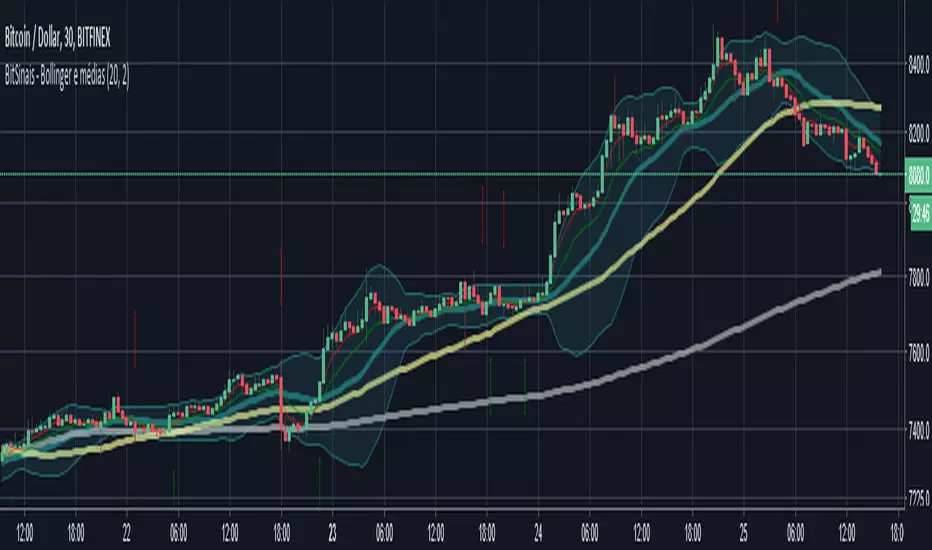
BitSinais - Bollinger and Moving AveragesBollinger Bands and Moving Averages with arrows pointing long/short entries.
MA 20 (middle of Bollinger Bands)
MA 50 (yellow)
MA 200 (white)
Works on low time frames for scalping as well as on bigger time frames for position.
It's part of our trading bot. (in development)
Private use. To get access, send me a private message and we can talk about.
//
Bandas de Bollinger e médias móveis com setas apontando entradas de long/short.
MA 20 (meio das bandas de Bollinger)
MA 50 (amarelo)
MA 200 (branco)
Funciona em tempos mais curtos para scalp e em tempos mais longos para position.
É parte do nosso bot, que ainda está em desenvolvimento.
Uso privado. Para ter acesso, me envie uma mensagem no chat privado.
在腳本中搜尋"bot"
BitSinais - Simple version of our indicatorSimple indicator with arrows pointing long or short entries.
Works on low time frames for scalping as well as on bigger time frames for position.
It's part of our trading bot. (in development)
Private use. To get access, send me a private message and we can talk about.
//
Versão simples do nosso inicador, com setas indicando entradas long ou short.
Funciona em tempos mais curtos para scalp e em tempos mais longos para position.
É parte do nosso bot, que ainda está em desenvolvimento.
Uso privado. Para ter acesso, me envie uma mensagem no chat privado.

Miscbot 5m 2.2aAn automated strategy utilizing Autoview and Bitmex on the 5m.
Use at your own risk. I take no responsibility lost currency using this.
Link to strategy:

SmartWave Algorithm v2We've updated a fan favorite with some more kick ass features!
Version 2 of SmartWave Algorithm brings additional options such as :
- Take Profit - Set your profit target percent - Can be used along with AutoView alerts or any other similar bot
- Stop Loss - Set a stop loss target percent - Same as above, plays nice with AutoView
- Trend Filters - Disable Buy and/or Sells in either up trends or down trends
See the original SmartWave Algorithm here :
Want Access? Visit CryptoProTools.com For More Info
Have Questions? Message here or join our Discord via the link on our websites contact page


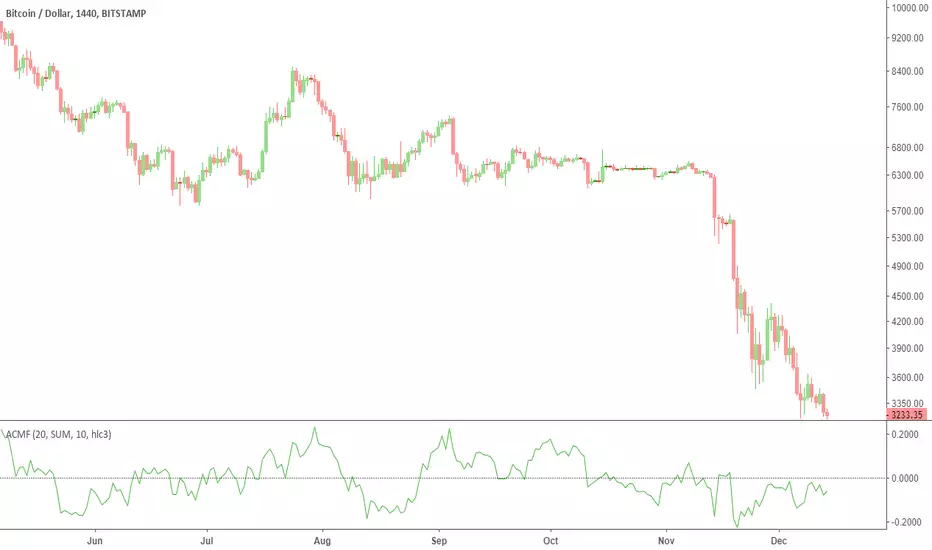
Advanced Chaikin Money Flow (CMF)TL;DR: change the aggregation to EMA to achieve similar results to Twiggs Money Flow. Play with the rest of parameters to get the desired results.
This script allows customization of CMF. It also includes all the improvements made by Twiggs Money flow.
Regular CMF does not take price gaps into account as you can see in the chart below. True range fixes this issue, as done in Twiggs Money flow (TMF).
More info here: www.incrediblecharts.com
Customization Options:
- You can change the effect of volume by setting volume exponent. 0 to 10 reduces the effect and 10+ increases it. In exchanges with too much wash trading, you may want to reduce volume effect.
- You can factor in price in CMF. It gives you a slightly different results. See my Volume x price (VxP) indicator for why it might be useful.
- The range can be changed to percentage (similar to RSI)
PS: I do not recommend using CMF in today's Crypto markets. Chaikin uses the same multiplier in CMF and Accumulation/Distribution Line (ADL). ADL is a totally broken indicator for BTC. If you look at the period after ATH (chart below), you will notice that ADL keeps increasing implying accumulation. While it is clear that there was distribution going on. The reason might be the artificially inflated prices in Crypto that is achieved by the help of bots and having "certain" exchanges as a price reference. So, my reasoning is that if ADL is a broken indicator, so should be CMF. CMF diverges from BTC price frequently. This is a double edged sword IMO. Still CMF is a much better indicator than ADL because it works relative to prior periods which covers some of its flaws.
Note for super nerds: Twiggs Money Flow includes true range and Welles Wilder's Moving Average (WWMA). I have seen some other scripts using their own calculations for WWMA which is not efficient. WWMA is equal to built-in RMA/SMMA which is equal to EMA with length 2x-1.
Fibonnaci Support/Resistance BandsThe Bollinger Support/Resistance Bands were created with the purpose of identifying possible entries and exits for day or swing trading. This custom indicator works well on all time frames and on any market found on TradingView. As you can see in in the image above, BNB bounces between the two first green bands while testing the yellow line.
Several different strategies can be used with this custom indicator. First, you could trade the yellow line, meaning when a bar closes above it, you buy and then sell at once it touches the first or second green band. You could also buy the channels on the lower bands, as they act and support lines.
Like this indicator? Check us out at www.scriptandbotmarketplace.com
Join our discord and talk about scripting and bots: discord.gg
Here are more examples of this indicator working on different time frames:
BTC/USDT, 3 Minute:
EUR/USD, 1 Hour:
Apple, 4 Hour:

Spicytrader V4 [LONG and SHORT signals + Trendline]NEW VERSION : JUNE 2018
LONG and SHORT signals (with alerts)
Trendline : Bullish and bearish market (with alerts)
Compatible with Autoview bot (Open Long/Short)
Working with 1min* interval and more (1min to Month)
TRY IT FOR FREE : spicytrader.com
* Market has to be enough volatile to use it with 1min interval (Ok with ETHER for instance).
Use these scripts together to maximize profit
Spicytrader V4
Squeeze Momentum Indicator
Pivot Point High Low
How to use the script
Add the scripts to your chart
Select a time interval from 1min to 1 month which shows great trends (Multiple following colored candles)
Don't go if trends are not well defined
LONG position
The BLUE* candle is CLOSED and BULLISH (Green candle)
Squeeze Momentum Indicator is BULLISH
Trendline is BULLISH (Green)
Candle close above Trendline
Pivot Points are below or far enough
Don't go if trends are not well defined
* Dark blue is a strong buy signal
* Ligh blue is a weak buy signal but can be ok depending of the market
SHORT position
The YELLOW candle is CLOSED and BEARISH (Red candle)
Squeeze Momentum Indicator is BEARISH
Trendline is BEARISH (Red)
Candle close bellow Trendline
Pivot Points are above or far enough
Don't go if trends are not well defined
When to close a trade ?
Trend is over (New closed candle is NOT colored)
or Market direction is changing
or Pivot Point is reached and failed to cross
or You feel it
WARNING :
The purpose of these signals is to HELP/SUPPORT you to take a decision.
You need to analyse the general trend before placing an order.
Don't trust FOMO or FUD and do your own research
TRY IT FOR FREE : spicytrader.com
TRY IT FOR FREE : spicytrader.com
TRY IT FOR FREE : spicytrader.com
How to use it with Autoview
Add an alert (OPEN LONG or OPEN SHORT) and set it to "Once Per bar Closed" in order to place an order after the confirmation.
Refer to the official website (Autoview) bit.ly to get more information.

NGRN MACD-X & RSI v3.1 MACD-X, RSI & Volume Indicator & Alerts Study - Version 3.1
Overview
This study and it's associated strategy were modeled after the famous Philakone described algorithms on his now defunct instructional video series.
This indicator allows for full customisation of parameters and interaction between three indicators that allow users to shape their trading methods to their desired goals.
This associated strategy also allows users to backtest the study alerts script and find the best settings towards that end.
MACD + RSI + VOLUME - are of the most powerful and widely usded indicators, MACD/Histogram crosses, coupled with RSI & Volume increases/decreases will detects areas of deeply oversold / overbought and buys/sells on the reversal
Features
Full customisation - All parameters are open for customising to allow the trader to build their own strategy and adapt from market to market.
Clean/Simple UI - Facilitating ease of use.
Enable Buying or Selling, - or have them both active at the same time.
Toggle off and on ALTERNATING Buy and Sell feature (pyramiding) - to allow for consecutive DOLLAR COST AVERAGING style buys or SCALING out of an entry (partial sell).
Customizable Stop-Loss plot - to enable users to create a STOP-LOSS alert option or other alert(s) based on the plot location. See settings screenshot.
Study and associated Strategy - to use the TradingView ‘Strategy Tester’ back-testing features to find the best alert settings for specific coins in bear, bull and sideways markets.
Ideal for use with the Autoview trading bot
Changes Version 3.1
UI consolidates reduntant script inputs making the script easier to use.
Fixes STOP-LOSS algorithm.
Adds a STOP-LOSS Plot (red line) to enable users to create a STOP-LOSS alert option or other alert(s) based on the plot location. See settings screenshot.
Access
Full Access is 0.1 ETH , one time fee for LIFETIME access to the STUDY indicator, STRATEGY and future updates as well as support and SETTINGS for various markets on the Binance Exchange.
Settings
BUY SETTINGS: prntscr.com
SELL SETTINGS: prntscr.com
STOP-LOSS SETTINGS: prntscr.com

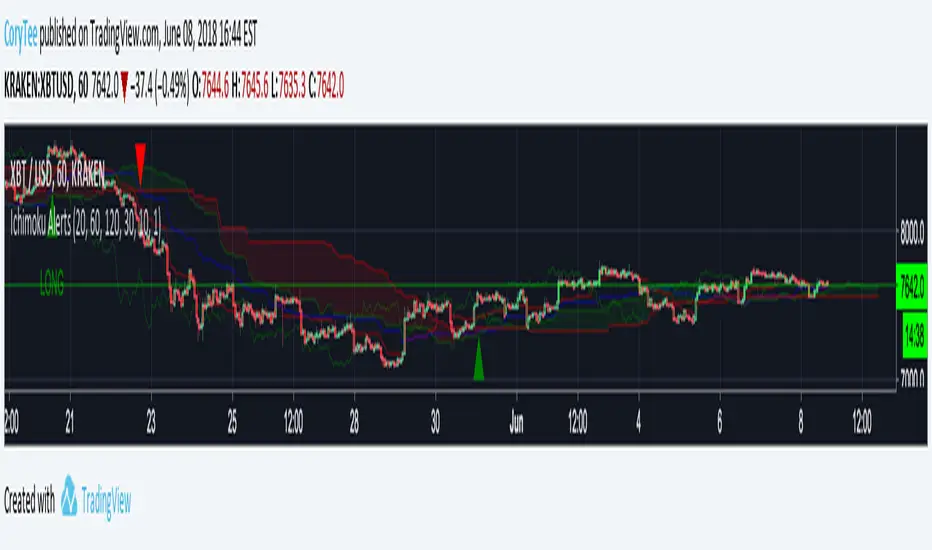
CoryT's Noro's Ichimoku AlertsA few months ago I took Noro's Ichimoku Cloud and used the AV bot template to throw stops on it. I took some code from JustUncleL
to make it not so hideous. Trailing Stops are turned off, stop losses are turned off (you really don't need them with this), and this is currently a Long/Short strategy, the Longs Only and Shorts Only options are broken right now, I'm tired and you guys can either fix it yourselves or deal with it like this for now.
Hint: If you wanna use this as a long-only strategy just have AV close your buy orders whenever a short is triggered.
Spicytrader [BUY and SELL signals + Breakouts + Trendline]
BUY and SELL signals (with alerts)
Support and resistant breakout (with alerts)
Auto trendlines : Bullish and bearish market (with alerts)
100% Compatible with Autoview bot (Buy, Sell, Takeprofit, Stop loss)
TRY IT FOR FREE : spicytrader.com


Buy Sell signal by Spicytrader
Get on board before going to the moon !
Spicytrader instantly identifies when a potential pump or dump is beginning.
Compatible with Autoview bot
GET ACCESS : spicytrader.com

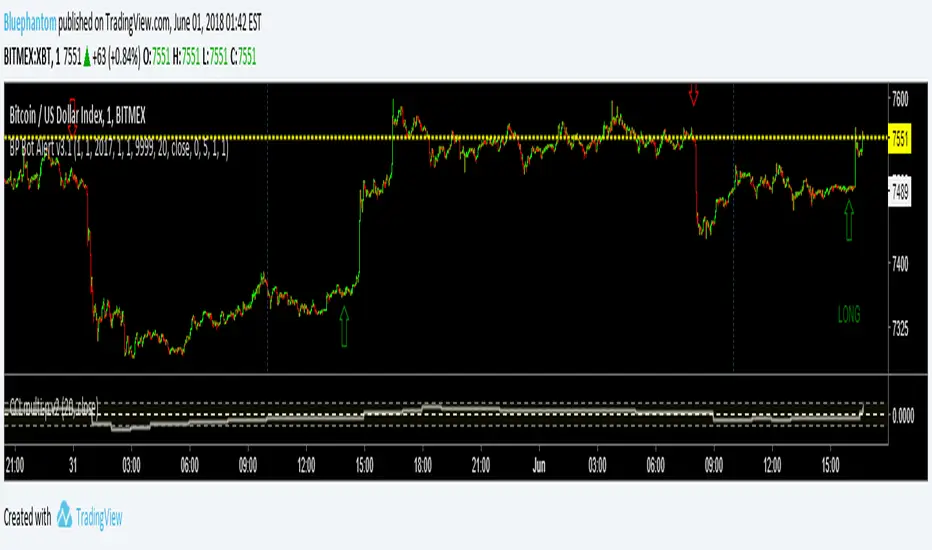
Autoview Bot Alert v3.1 By BluephantomThis Alert Script is invite only. To be considered you must contact me through the Autoview Discord group.
It uses an EMA smoothed Heikin-Ashi and an average CCI based on multi time frames.
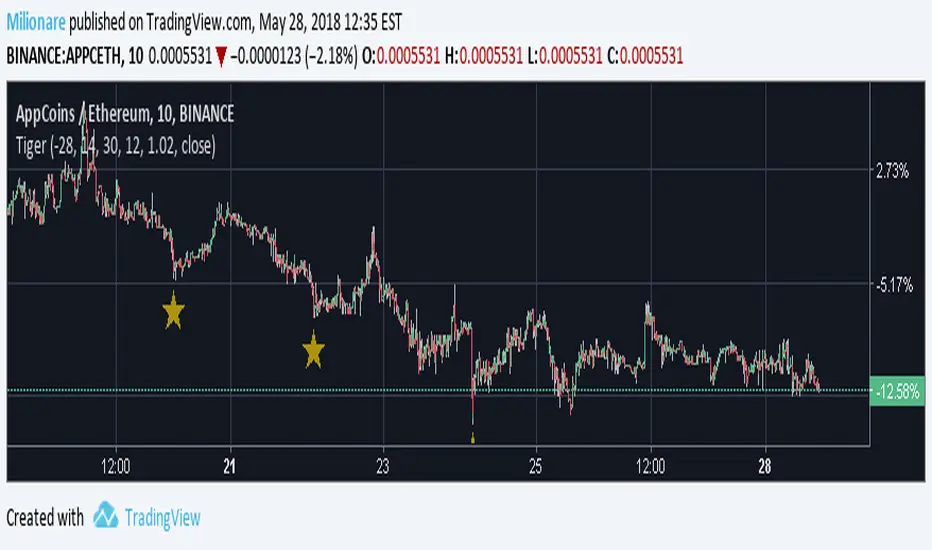
TIGER Pro - buy alert script - finders bottomScript with many trending oscillators and trend filter. It can be set to all tradable coins. Perfectly works for 5-30 min.Script has a Alert for purchase built in. Autoview is used for purchase and the sale is controlled via PT. It is important to use stop loss and sales strategy .Using these signals is at your own risk.
An invitation is up to 200 people. This is a test version.
example alert for Binance : e=binance s=APPCETH b=buy u=currency q=0.017 t=limit p=0.1%
e=binance s=APPCETH b=buy delay=150 c=order
Option alert:Buy
:Once Per Bar Close
For more info PM
Draculapresley Daytrading STRAT O' DOOM 1.3Very excited with my results after extensive testing I present the Strat O Doom version 1.3!
Using some custom settings with a few indicators and a custom movement algorithm I have fine tuned my strat even further. The strat now lends itself to quick trades but also better at finding longer movements as well.
I appreciate everyone participating and engaging with my last version and anyone who has donated will get access to the new settings!
For access please consider a donation...
BTC
19sbyzKm9PqYizeFgTkT1gSRvyfBNa2bn7
ETH
0x6b8ef9f4979df6efd51e745ba996299349d67306
LTC
LLMUH5v5DeurLZEeX2Atu9W36vLA1pTX7o
For donation confirmations or script purchase you can email draculapresley@gmail.com

Hull - Moving Average spreadAn idea i had using the trend indicator Hull Moving Average for bot trading. I am using a lot of EMA Spread indicators lately and i just wanted to make a Hull like Spread for comparision.
In General if combined with CandleStick Patterns / Momentum like StochRSI etc. You will receive pretty decent signals for Panic DIPS that have a high change of rebound.
ToDo ... Enhance the Script with Offset so that it reacts to market moves.

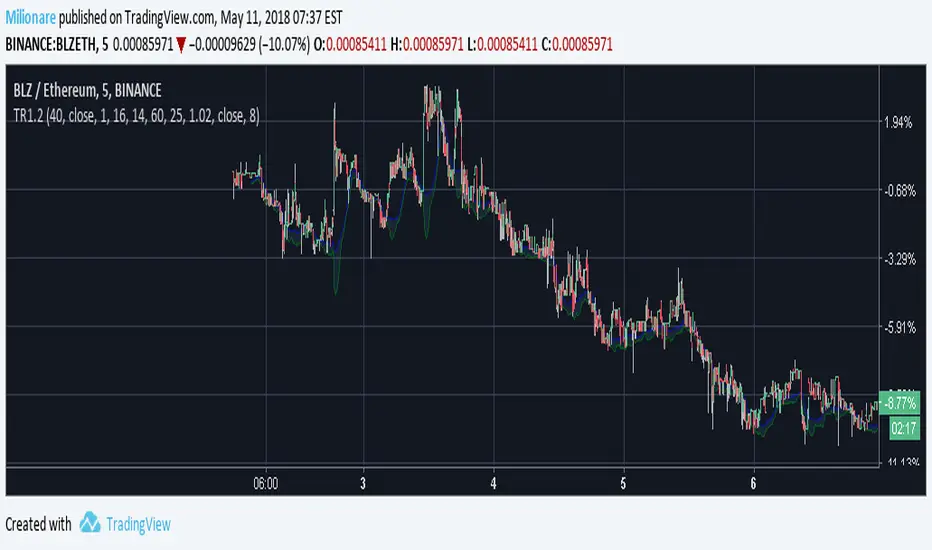
TIGER Crypto script for bot trading. It contains two oscillators, bblow and two filters for cleaning the input.
Only for 100 people to test for 1 week.
Pm me for invite
Trade in uptrend and downtrend. gl
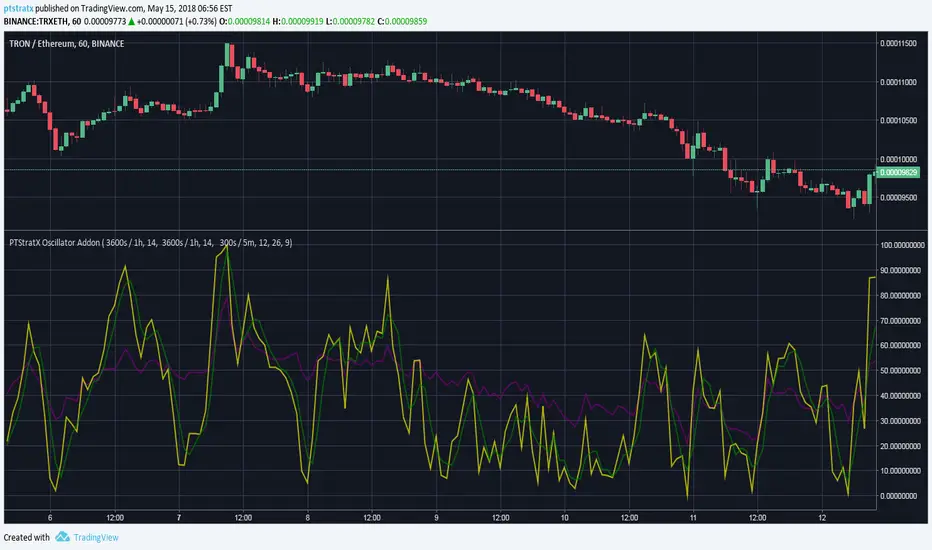
PTStratX Trial - Multi Oscillator AddonPTStratX Trial - Multi Oscillator Addon
The PTStratX multi period oscilator is the perfect complement to visually set and optimize the indicators used in PTStratX
You can display RSI, StochRSI and MACD with different time periods in a seperate diagram below the chart with this Addon.
For example you can display in an 1m candle chart a RSI with candle size of 1h, a StochRSI (PT2 implementation) with 30 minutes and a MACD with 15 minutes
Please visit ptstratx.com for further information.
This is only a Testversion!
Testcoin ADABTC -2.94%
TestDate 04/07/18 - 04/21/18
EMAGAIN + RSI Buy Signals with alerts for AutoviewThis indicator uses the lower of the fast & slow EMA together with RSI to plot buy signals. Alerts can then be created for bots like Autoview to automatically place orders at exchanges supported by the bot.
To create alerts:
- New Alert
- Select the EMAGAIN + RSI Buy Signals with alerts for Autoview", "Buy" and "Buy Signal" under condition
- Select "Once per Bar" or if you want to avoid repainting "Once per Bar close". Note that "Once per bar close" will place the buy order a bit later in most cases where "Once per bar" will buy earlier
Comments & suggestions welcome
---------------------------------------------------------------------
Informational videos on my Tradingview scripts below:
www.youtube.com

LOWBB & RSI Buy Signals with alerts for AutoviewThis indicator uses the lower bollinger band together with RSI to plot buy signals. Alerts can then be created for bots like Autoview to automatically place orders at exchanges supported by the bot.
To create alerts:
- New Alert
- Select the "LOWBB & RSI Buy Signals with alerts for Autoview", "Buy" and "Buy Signal" under condition
- Select "Once per Bar" or if you want to avoid repainting "Once per Bar close". Note that "Once per bar close" will place the buy order a bit later in most cases where "Once per bar" will buy earlier
Comments & suggestions welcome
---------------------------------------------------------------------
Informational videos on my Tradingview scripts below:
www.youtube.com

