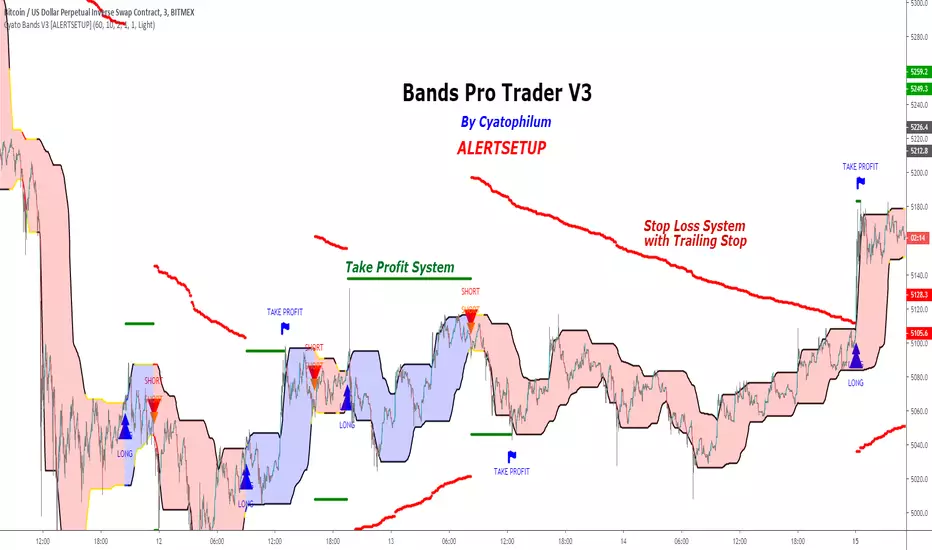
Cyatophilum Bands Pro Trader V3 [ALERTSETUP]An Original Automated Strategy that can be used for Manual or Bot Trading, on any timeframe and market.
>> Presentation <<
This script comes with a Backtest Version
How it works
No, these are NOT Bollinger Bands..
The Cyatophilum Bands are an original formula that I created. You will probably never find it anywhere else.
Their behavior is the following:
When they are horizontal it means the trend is going sideways and they represent supports (lower band) and resistances (upper band).
When they are climbing or falling it means the trend is either bullish or bearish and they represent Trend Lines.
The strategy enters Long on a Bull Breakout and enters Short on a Bear Breakout.
The exits are triggered either on a Trend Reversal, a Stop Loss or a Take Profit.
FEATURES
Take Profit System
Stop Loss System
Show Net profit Line
More features here
Finding a profitable configuration is GUARANTEED
0. Choose your symbol and timeframe. Then add the Backtest version to your chart. If at any time you decide to change your timeframe, go back to step 1.
1. Open the strategy tester and look at the buy & hold line.
If it is mostly climbing (last value greater than 0) then it means we are in a bull market. You should then opt or a long only strategy.
If it is mostly dropping (last value lower than 0) then it means we are in a bear market. You should then opt or a short only strategy.
Note : This first step is really important. Trading against the market has very little chances to succeed.
2. Go into the Strategy Input Parameters:
check "Enable Long Results" and uncheck "Enable Short Results" if you are in a long only strategy.
check "Enable Short Results" and uncheck "Enable Long Results" if you are in a short only strategy.
3. Open the Strategy Tester and open the Strategy Properties.
We are going to find the base parameters for the Bands.
The "Bands Lookback" is the main parameter to configure for any strategy. It corresponds to how strong of a support and resistance the bands will behave. The lower the timeframe, the higher lookback you will need. It can move from 10 to 60. For example 60 is a good value for a 3 minute timeframe. Try different values, and look at the "net profit" value in the Overview tab of the Strategy Tester. Keep the Lookback value that shows the best net profit value.
Then play with the "Bands Smoothing" from 2 to 20 and keep the best net profit value.
The "Band Smoothing" is used to reduce noise.
Usually, the default value (10) is what gives the best results.
From this point you should already be able to have a profitable strategy (net profit>0), but we can improve it using the Stop Loss and the Take Profit feature.
4. To activate the Stop Loss feature, click on the "SECURITY" checkbox
You should see horizontal red lines appear.
A Long/short exit alert will be triggered if the price were to cross this line. (A red Xcross will appear)
Choose the Stop Loss percentage.
On top of that, you can enable the feature "Trailing Stop". It will make the red line follow the price, at a speed that you can configure with the "Trailing Speed" parameter.
Now, sometimes a stop is triggered and it was just a fakeout. You can enable "Re-entries after a stop" to avoid missing additional opportunities.
5. To activate the Take Profit feature, click on the "TAKE PROFIT" checkbox
You should see horizontal green lines appear.
A Long/short exit alert will be triggered if the price were to cross this line. (A flag will appear)
Choose the Take Profit percentage.
A low takeprofit will provide a safer strategy but can reduce potential profits.
A higher takeprofit will increase risk but can provide higher potential profits.
6. Money Management
You can configure the backtest according to your own money management.
Let's say you have 10 000 $ as initial capital and want to trade only 5%, set the Order Size to 5% of Equity.
You can increase net profit by increasing the order size but this is at your own risk.
How to create alerts explained here
Sample Uses Cases
Use it literally anywhere
This indicator can be used on any timeframe and market (not only cryptocurrencies).
About the Backtest below
The Net Profit (Gross profit - Gross loss) is calculated with a commission of 0.05% on each order.
No leverage used. This is a long strategy.
Each trade is made with 10 % of equity from an inital capital of 10 000$. The net profit can be bigger by increasing the % of equity but this a trader's rule to minimise the risk.
I am selling access to all my indicators on my website : blockchainfiesta.com
To get a 2 days free trial, just leave a comment , thanks !
Join my Discord for help, configurations, requests, etc. discord.gg
在腳本中搜尋"bot"
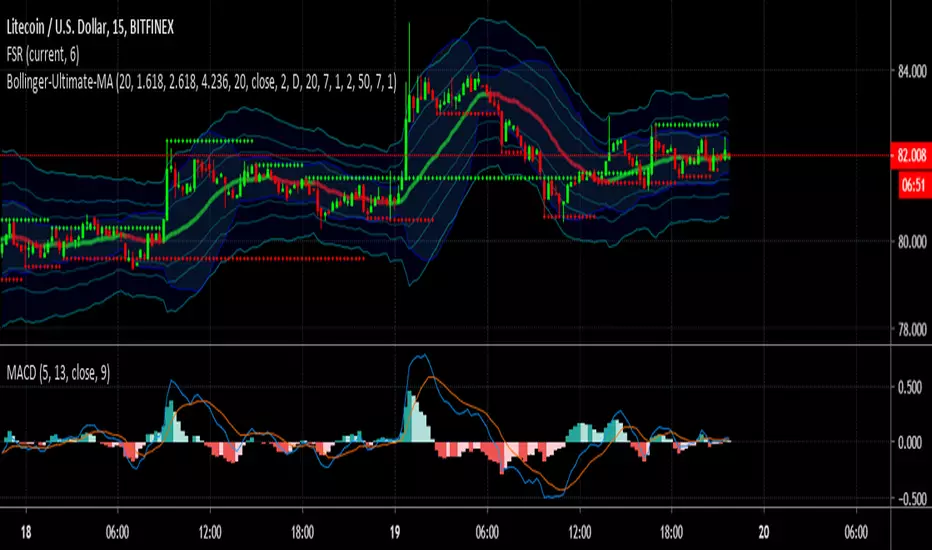
Bollinger-Ultimate-MAThis script combine Bollinger Band , Fibonacci and CM_Ultimate_MA_MTF_V2
To integrate with Trading Bot ;
Add alert, in the first drop down, either "Buy Condition" or "Sell Condition", and then your frequency and so on.
Dragon-Bot - Default ScriptDragon-Script is a framework to make it as easy as possible to test your own strategies and set alerts for external execution bots. This is the alerts version of the script.
The script has many features build in, like:
1) A ping/pong mechanism between longs and shorts
2) A stop-loss
3) Trailing Stops with several ways to calculate them.
4) 2 different ways to flip from long to short.
The script is divided into several parts.
The first part of the script is used to set all the variables. You should normally never change the first part except for the comments at the top.
The second part of the script is the part where you initialise all your indicators. Several indicators can be found on Tradingview and on other sites. Please keep in mind that all the variable names used in the indicator should be unique. (all the … = … parts)
The third part of the script, is the most important part of the script. Here you can create the entry and exit points.
Let’s look at the OPENLONG function to explain this part: The first variables are all the possible entries; These are longentry1 till longentry5. You can add many more if you like.
The variables are all initialised as being false. This way the script can set a value to true if an entry happens.
The if function is the actual logic: You could say “if this is true” then (the line below the if function) longentry1 := (becomes) true.
In this case we have said: “if this is true” then (the line below the if function) longentry1 := (becomes) true when the current close is larger than the close that is 1 back.
The last part is the makelong_funct. This part says that if any of the entries are true, the whole function is true.
The last part of the script is the actual execution. Here the alerts are plotted and the back test strategies are opened and closed.
We hope you guys like it and all feedback is welcome!

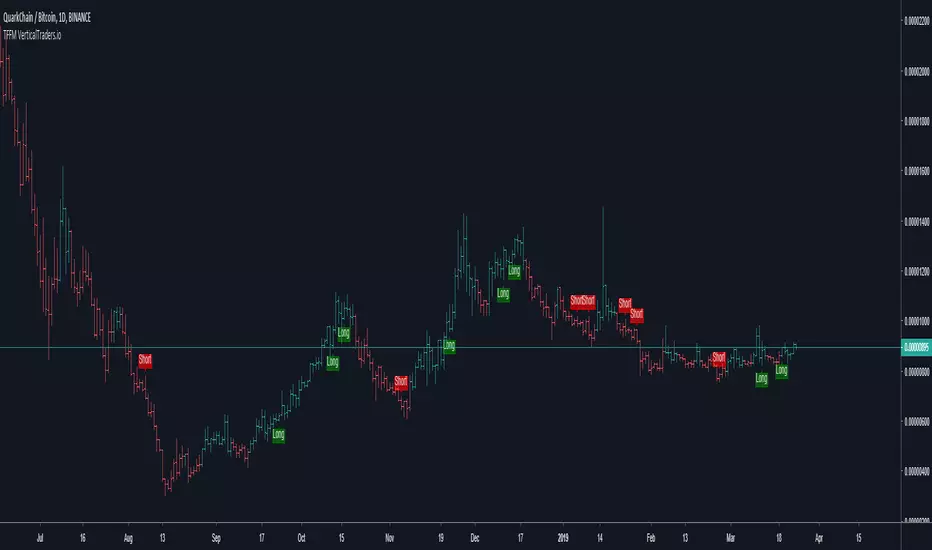
TFFM-This algorithm takes in consideration Media averages, Volatility Movements, trend direction and other Mathematical Properties.
-After adding this signal on TradingView, you will get notified every of potential long and short points triggered by the indicator.
-This signal alerts you anytime bars form a bullish or bearish pattern and price start to move in the suggested direction.
-It works in any time frame or market like Forex, Crypto, Commodities even Stocks.
-Recommended for bots or manual trading.
Do you need an Script or an expert adviser for Forex, contact our coding service:
Get this indicator today! contact us
Entry Bars -This algorithm takes in consideration Media averages, Volatility Movements and other Mathematical Properties.
-After adding this signal on TradingView, you will get notified every of potential long and short points triggered by the indicator.
-This signal alerts you anytime bars form a bullish or bearish pattern and price start to move in the suggested direction.
-It works in any time frame or market like Forex, Crypto, Commodities even Stocks.
-Recommended for bots or manual trading.
Do you need an Script or an expert adviser for Forex, contact our coding service
Get this indicator today! contact us

Premium 2-This algorithm takes in consideration Media averages, Volatility Movements, trend direction and other Mathematical Properties.
-After adding this signal on TradingView, you will get notified every of potential long and short points triggered by the indicator.
-This signal alerts you anytime bars form a bullish or bearish pattern and price start to move in the suggested direction.
-It works in any time frame or market like Forex, Crypto, Commodities even Stocks.
-Recommended for bots or manual trading.
Do you need an Script or an expert adviser for Forex, contact our coding service: coding@verticaltraders.io
Get this indicator today! contact us

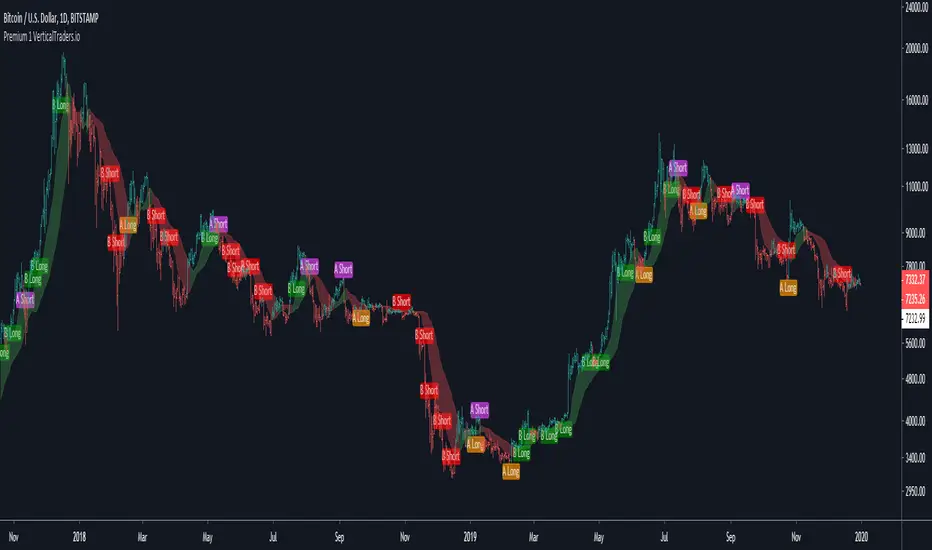
Premium 1-This algorithm takes in consideration Media averages, Volatility Movements and other Mathematical Properties.
-After adding this signal on TradingView, you will get notified every of potential long and short points triggered by the indicator.
-This signal alerts you anytime bars form a bullish or bearish pattern and price start to move in the suggested direction.
-It works in any time frame or market like Forex, Crypto, Commodities even Stocks.
-Recommended for bots or manual trading.
Do you need an Script or an expert adviser for Forex, contact our coding service:
Get this indicator today! contact us
Bitmex HunterBitmex Liquidation Hunter advise you with all the liquidation level from 100x 50x and 25x
so you can be a head of Bitmex market and trade each liquidation Bounce and take your profits
you will see how Bitmex bot and Bitmex Price its all the time moving from one liquidation level to the next
liquidation level hunting all the greedy and retail traders that FOMO in !!

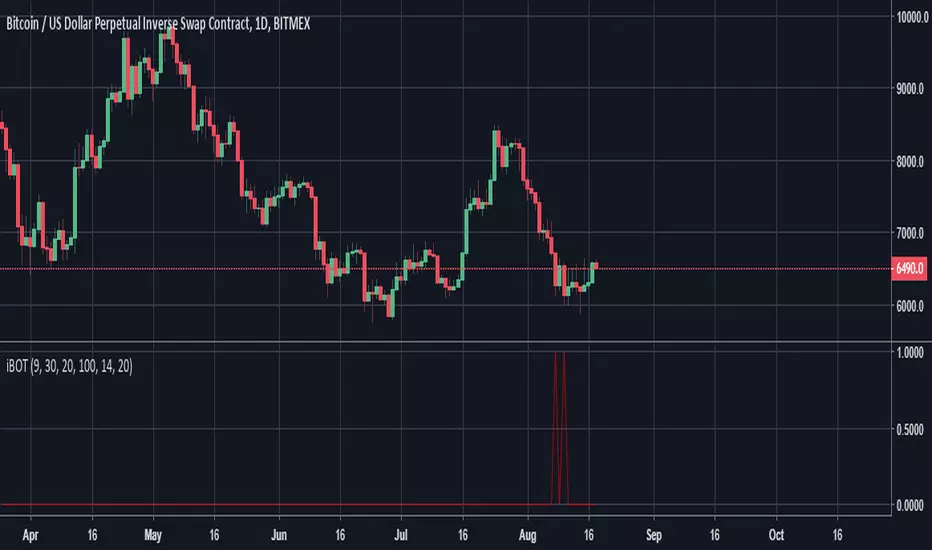
Pivot Point BotHello Fellow Traders!
-------------------------------------------
This is the newest addition to Gnome Alerts PRO!
This Bot Script written for leverage Crypto exchanges like BITMEX & Deribit but also works with Forex.
FEATURES
------------------------
*Autoview Ready*
- Easy to Use
- Backtesting Included
- Stop Loss
More info on how gain access in my profile!

Cyatophilum Crypto Trader 1H [ALERTSETUP]A strategy specificaly engineered for trading altcoins.
Crypto pairs configurations already available: ADA/BTC, BNB/BTC, EOS/BTC, ETH/BTC, ICX/BTC, NEO/BTC, TRX/BTC, XLM/BTC, XMR/BTC, XRP/BTC.
This version allows to create automated alerts for buy and sell signals that can be used for manual or bot trading.
Note: You can use the backtest version for finding the best configuration for your pair if it isn't in the list. I will also be there to help you.
How it Works
The strategy is based upon two Exponential Moving Averages, it captures trend reversals, fakeouts, has a stop loss option and more (see the presentation page for input parameters description).
It should be used in 1 Hour timeframe and on any pair of cryptocurrency.
Backtest
The Net Profit (Gross profit - Gross loss) is calculated with a commission of 0.05% on each order.
Each trade is made with 100 % of equity
Get the indicator today!
Purchase on my website : blockchainfiesta.com

XBT swing-SCALPER-- with alerts-- COIN OBSFor backtested strategy:
This is the same strategy, with alerts for bots.
strategy takes much into consideration,
swings, rsi, mfi, with some safety nets.
For actual use, send me a DM.

[Alerts]QQE Cross v6.0 by JustUncleLDescription:
This is a major upgrade of my original QQE indicator Tool, this version is directed at Forex and Crypto Margin trading. This version can also be used with AutoView/ProfitView Chrome add-on in a semi-automatic (turn on only when conditions are favorable) or automatic way, with Signal to Signal or Signal to Close trading.
This is a Trend following indicator that uses fast QQE crosses to capture swings in direction of the main Trend. Alerts are filtered with Two Moving Average Ribbons and/or Direction of MAs. The QQE or Qualitative Quantitative Estimation is based on the relative strength index (RSI), but uses a smoothing technique as an additional transformation. Three crosses can be selected (all selected by default):
Smooth RSI signal crossing ZERO (XZ)
Smooth RSI signal crossing Fast QQE line (XQ), this is like an early warning swing signal.
Smooth RSI signal exiting the RSI Threshhold Channel (XC), this is like a confirmed swing signal. An optimal Smooth RSI threshold level is between 5% and 10% (default=10), it helps reduce the false swings.
These signals can be selected to Open Short/Long and/or Close a trade, default is XC open trade and XQ (or opposite open) to Close trade.
The (LONG/SHORT) alerts can be optionally filtered by the Moving Average Ribbons:
For LONG alert the Close must be above the fast MA Ribbon and fast MA Ribbon must be above the slow MA Ribbon.
For SHORT alert the Close must be below the fast MA Ribbon and fast MA Ribbon must be below the slow MA Ribbon.
and/or directional filter:
For LONG alert the Close must be above the medium MA and the directional of both MA ribbons must be Bullish.
For SELL alert the Close must be below the medium MA and the directional of both MA ribbons must be Bearish.
This indicator is designed to be used as a Signal to Signal trading BOT in automatic or semi-automatic way (start and stop when conditions are suitable).
For LONG and SHORT alerts I recommend you use "Once per Bar" alarm option
For CLOSE alerts I recommend you use "Once per Bar Close" alarm option
(* The script has been designed so that long/short signals come at start of candles *)
(* and close signals come at the end of candles *)

TREND PRESSURE BOTThis is the BOT version of the TREND PRESSURE script I previously published, optimised for Autoview and other crypto bots. This version is for 1H charts only.

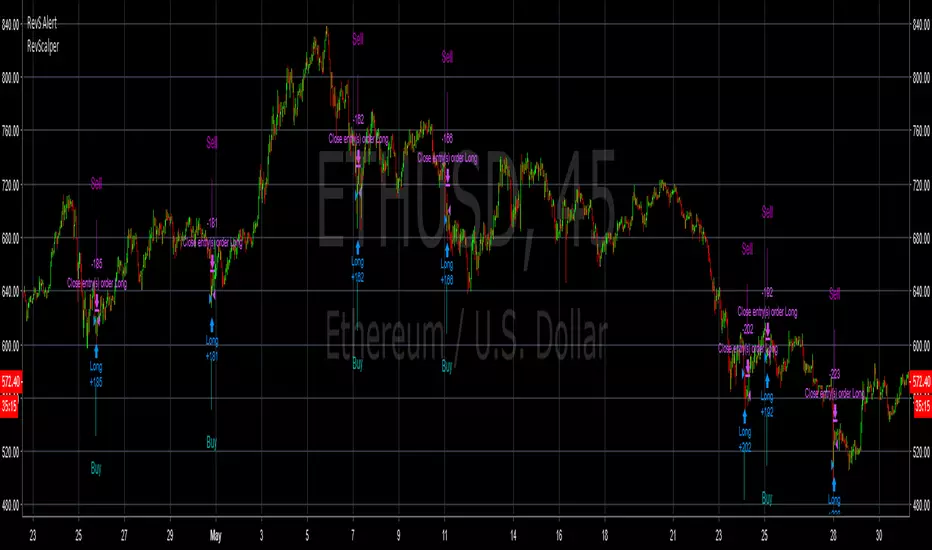
MACs EasyMoney - Advanced BOT VersionHi All,
Publishing the new version of "Advanced BOT Indicator", with some major code changes/updates to Take Profits signals.
(Implementing this Take Profits part is highly competitive and challenging code architecture)
BITMEX:XBTUSD
BITFINEX:BTCUSD
=============================================================================================
Indicator Symbols:
1) "Sell" --> refers to Sell/Short signal.
2) "Buy" --> refers to Buy/Long signal.
3) "⬆" (symbol in lime color) --> refers the Take Profits point with respect to last recent "Buy" signal.
4) "⬇" (symbol in lime color) --> refers the Take Profits point with respect to last recent "Sell" signal.
=============================================================================================
It has 6 Alert Systems:
1) Enter Buy
2) Enter Sell
3) Exit Sell
4) Exit Buy
5) Close Sell
6) Close Buy
Difference between Exit and Close options that mentioned under alerts are,
"Exit" option --> helps to stop the order at safer position - in case if market flips unexpectedly.
"Close" option --> helps to close the orders at local Top/Bottom to come out with very good profits.
==============================================================================================
Happy Trading :)
Thanks,
Mac


MACs EasyMoney - Advanced BOT VersionHi All,
Introducing my next development - The Advanced-BOT Version , with major code updates :)
Symbols in Chart:
1) "S" --> refers to Sell/Short
2) "L" --> refers to Buy/Long
3) "Lime color arrow down" symbol --> refers to take profits location from the last recent "L" signal.
4) "Aqua color arrow up" symbol --> refers to take profits location from the last recent "S" signal.
It has 6 Alert Systems:
1) Enter Buy
2) Enter Sell
3) Exit Sell
4) Exit Buy
5) Close Sell
6) Close Buy
Difference between Exit and Close options are,
--> "Exit" options --> will stop the order at safer position - in case if market flips suddenly.
--> "Close" options --> will close the orders at local Top/Bottom to come out with very good profits.
Happy Trading :)
Thanks,
Mac


Crypto Reversal Scalper AlertsThis is the alerts for
The script that will detect a reversal with two variables. The script will then attempt to scalp against the trend short-term.
Absolutely, NO REPAINTING. Can be used across crypto pairs.
You must use ONCE PER BAR for alerts! Yes it does work! <- MAKE SURE YOU SET ALERTS PROPERLY!
PM me for a trial.
Cost for the bot will be 0.01 BTC/month. Cost can be negotiable.
Alerts for Dragon-Bot beta breakout scriptThis is a work in progress for Alerts for a breakout script

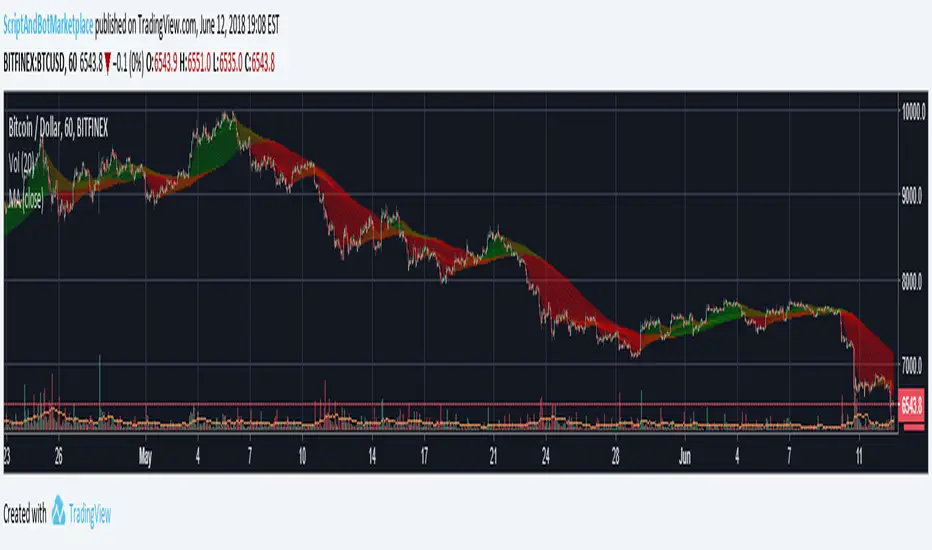
Script and Bot Marketplace's Trend Detector 2.0Use this custom indicator to analyze the current trend of any market that you choose on all time frames. Works great as a secondary indicator while day or swing trading.
Interested? Check us out here: www.scriptandbotmarketplace.com
Join our discord to talk about bots, scripts, and crypto: discord.gg
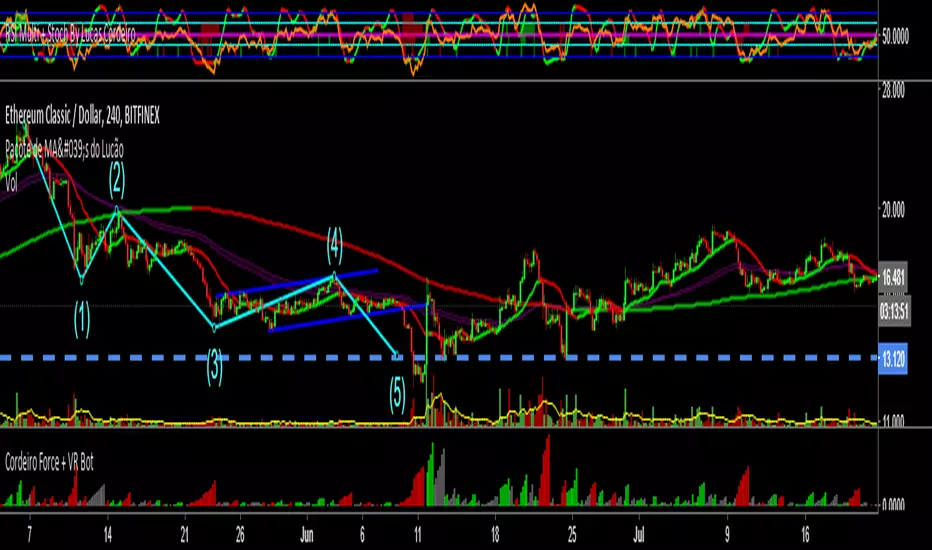
Buy Signal and Entry points (alpha)
Here is some study for my new bot project. 🤖
Indicator shows entry points (buy signals). Bets results on 15M TF and higher. (1H recommended)
Pay attention to how the script gives signals before the pumps. 📈📈📈
You can cut false signals by using stop-loss orders (recommended).
Use on you own risk.
This is alpha version of script. May be updated in the future.
=================================================================
Стратегия разработанная для нашего торгового бота. 🤖
Индикатор показывает точки входа на покупку. Показывает хорошие результаты на ТФ 15М и выше. (Рекомендую 1Ч)
Обратите внимание на то, как скрипт срабатывает перед пампами. 📈📈📈
Чтобы купировать ложные сигналы, рекомендую использовать стоп-лосс ордера.
Это альфа версия скрипта, возможно будет дорабатываться и обновляться. Но это не точно :)
