Bull Flag & Flat Top Breakout DetectorBull Flag & Flat Top Detector - Quick Reference Guide
Pattern Overview
🚩 Bull Flag
╱╲
╱ ╲ ← Pullback (2-5 red candles)
╱ ╲
╱ ╲____
╱ ╲
│ │
│ THE POLE │ ← Strong upward move (3+ green candles)
│ │
└──────────────┘
What to look for:
Strong initial move (the "pole") - 3+ green candles, 3%+ move
Brief pullback - 2-5 candles, less than 50% retracement
Pullback should "drift" lower, not crash
Entry on first candle to make new high after pullback
📊 Flat Top Breakout
════════════════ ← Resistance (multiple touches)
↑ ↑ ↑
╱╲ ╱╲ ╱╲
╱ ╲╱ ╲╱ ╲ ← Consolidation
╱ ╲
╱ ╲
What to look for:
Multiple touches of same resistance level (2+)
Tight consolidation range
Each failed breakout builds pressure
Entry on convincing break above resistance with volume
Signal Types
SignalShapeColorMeaningBull Flag Breakout▲ TriangleLimeEntry signal - go longFlat Top Breakout◆ DiamondAquaEntry signal - go longBear Flag Breakout▼ TriangleRedShort entry (if enabled)Pattern Forming🚩 FlagFaded GreenBull flag developingPattern Forming■ SquareFaded BlueFlat top developing
Level Lines Explained
LineColorStyleMeaningEntryLimeSolidBreakout trigger priceStop LossRedDashedExit if price falls hereTarget 1AquaDottedFirst profit target (2R)Target 2YellowDottedSecond profit target (3R)
Info Table Reference
FieldWhat It ShowsBull FlagScanning / Forming 🚩 / Breakout ✓Flat TopScanning / Forming 📊 / Breakout ✓PullbackCandle count + retracement %Rel VolumeCurrent bar vs averageEMA 20Above ✓ or Below ✗VWAPAbove ✓ or Below ✗Green StreakConsecutive green candles (pole)ResistanceTouch count for flat top
Trading Checklist
Before Entry ✅
Pattern status shows "FORMING" or "BREAKOUT"
Price above EMA (table shows ✓)
Price above VWAP (table shows ✓)
Relative volume 1.5x+ (ideally 2x+)
Stock is in play (up 5%+ on day, has catalyst)
Market direction supportive (not fighting trend)
Entry Execution
Wait for breakout candle to form
Confirm volume spike on breakout
Enter as close to entry line as possible
Set stop loss at red dashed line
Know your target levels
Trade Management
If no immediate follow-through → consider exit ("breakout or bailout")
Take 50% off at Target 1
Move stop to breakeven
Let remainder run toward Target 2
Exit fully if price returns below entry
Bull Flag Quality Checklist
Pole Quality:
FactorIdealAcceptableAvoidGreen candles5+3-4Less than 3Move size10%+3-10%Less than 3%VolumeIncreasingSteadyDecliningCandle bodiesLargeMediumSmall/doji
Pullback Quality:
FactorIdealAcceptableAvoidCandle count2-34-56+RetracementUnder 38%38-50%Over 50%VolumeDecliningSteadyIncreasingCharacterOrderly driftChoppySharp drop
Flat Top Quality Checklist
FactorGood SetupWeak SetupTouches3+ at same levelOnly 2, widely spacedToleranceVery tight (0.2%)Loose (1%+)Duration5-15 barsToo short or too longVolumeDrying upErraticPrior trendUpSideways/down
Common Mistakes to Avoid
❌ Entering too early
Wait for actual breakout, not anticipation
"Forming" ≠ "Breakout"
❌ Ignoring volume
No volume = likely false breakout
Require 1.5x+ relative volume minimum
❌ Fighting the trend
Check EMA and VWAP status
Both should be ✓ for high probability
❌ Wide stops
Stop should be below pullback low
If stop is too wide, skip the trade
❌ Holding losers
"Breakout or bailout" - if it doesn't work, exit
Failed breakouts often reverse hard
❌ Chasing extended moves
If you missed entry, wait for next pattern
Don't chase 5+ candles after breakout
Risk Management Rules
Position Sizing
Risk Amount = Account × Risk % (typically 1-2%)
Position Size = Risk Amount ÷ (Entry - Stop)
Example:
Account: $25,000
Risk: 1% = $250
Entry: $5.00
Stop: $4.70
Risk per share: $0.30
Position Size: $250 ÷ $0.30 = 833 shares
Risk-Reward Targets
TargetR MultipleExample (risk $0.30)Target 12:1+$0.60 ($5.60)Target 23:1+$0.90 ($5.90)
Timeframe Guide
TimeframeProsConsBest For1-minMore patterns, precise entryNoisy, false signalsScalping5-minGood balance, cleaner patternsFewer signalsDay trading15-minHigh quality patternsMiss fast movesSwing entries
Settings Quick Reference
Default Settings (Balanced)
Pole: 3 candles, 3% move
Pullback: 2-5 candles, 50% max retrace
Volume: 1.5x required
Filters: EMA + VWAP ON
Aggressive Settings
Pole: 2 candles, 2% move
Pullback: 2-6 candles, 60% max retrace
Volume: 1.2x required
Filters: VWAP OFF
Conservative Settings
Pole: 4 candles, 5% move
Pullback: 2-4 candles, 40% max retrace
Volume: 2.0x required
Filters: Both ON
Alert Setup
Recommended Alerts
"Bull Flag Forming"
Get early warning as pattern develops
Prepare your position size and levels
"Bull Flag Breakout"
Primary entry alert
React quickly when triggered
"Any Bullish Breakout"
Catch both bull flags and flat tops
Good for watchlist scanning
Alert Setup Steps
Right-click chart → Add Alert
Condition: Select "Bull Flag & Flat Top Breakout Detector"
Choose alert type from dropdown
Set expiration and notification method
Troubleshooting
Q: Patterns not detecting?
Lower the Min Pole Move % setting
Reduce Min Pole Candles requirement
Check that price is in acceptable range
Q: Too many false signals?
Increase volume multiplier to 2.0x
Enable both EMA and VWAP filters
Increase Min Pole Move %
Q: Levels not showing?
Enable "Show Entry Line", "Show Stop Loss", "Show Targets"
Check "Max Patterns to Display" setting
Q: Info table not visible?
Enable "Show Info Table" in settings
Try different table position
Pattern Combinations
Best Setups (A+ Quality)
Bull flag on a gap day (Gap & Go → Bull Flag)
Flat top at pre-market high resistance
Pattern forming above VWAP with 5x+ volume
Avoid These
Bull flag below VWAP
Flat top in downtrending stock
Low volume patterns
Patterns late in the day (after 2pm)
Daily Routine
Pre-Market (7-9am)
Build watchlist of gappers (5%+, high volume)
Apply indicator to top 3-5 candidates
Note pre-market levels
Market Open (9:30-10:30am)
Watch for "FORMING" status on watchlist
Prepare entries as patterns develop
Execute on breakout signals
Manage trades according to plan
Midday (10:30am-2pm)
Look for second-wave patterns
Be more selective (less momentum)
Consider tighter stops
Close (2-4pm)
Generally avoid new patterns
Manage existing positions
Review day's trades
在腳本中搜尋"break"

Hidden Zone Detector AI - Crypto/Forex/StockHidden Zone Detector AI - Crypto Forex Stock
Hidden Zone Detector AI is a professional TradingView indicator designed to find hidden supply and demand zones across markets — crypto, forex and stocks — and surface high-probability areas earlier than classical pivot-only methods. It combines price structure analysis, volatility/ATR sizing, volume profiling and multi-mode AI heuristics (Fast / Balanced / Accurate) to generate prediction zones, highlight tested areas, and visually mark zone breakouts. Built with practical trader workflow in mind: configurable anti-repaint options, adaptable Light/Dark UI, clear labels, and candle-coloring for immediate visual context.
How it works
• Detects hidden zones by scanning pivot formations and finding internal “hidden” bars that represent real institutional activity (not just visible swing points).
• Scores zones by size (ATR-relative), volume, and touch characteristics to produce a strength percentage (Weak/Medium/Strong).
• AI heuristics aggregate price, momentum, moving averages, RSI/MACD signals and volume patterns to propose prediction zones — adjustable for speed vs. accuracy.
• Zones are drawn as persistent boxes with optional midlines, labels, and tailored styling when broken or tested.
Main advantages
• Early edge: finds hidden zones that often act before obvious pivots.
• Actionable visuals: labeled zones, color-coded candles, and breakout styling speed decision-making.
• Flexible AI modes: choose Fast for responsiveness, Balanced for day-to-day use, or Accurate for stricter signals.
• Anti-repaint controls: require confirmed bars for predictions to improve signal reliability.
• Multi-market ready: tuned for crypto, forex and stock chart behavior.
• Light/Dark friendly: UI color handling ensures labels remain readable on any chart background.
• Open & reusable: released under Mozilla Public License 2.0 (MPL-2.0) — use and adapt freely with attribution.
Best practices & tips
• Start with Balanced mode and sensitivity ~5; increase sensitivity for earlier but noisier predictions.
• Use prediction confirmation (Require AI Prediction Confirmation) for lower repaint risk.
• Combine zone reads with higher-timeframe context and orderflow/volume tools for stronger entries.
• Adjust max active zones and opacity to keep charts clean on lower timeframes.
License & author
Mozilla Public License 2.0 (MPL-2.0).
Author: a_jabbaroff — created with care for the TradingView community and fellow traders.

ORB - Openning Range BreakoutORB - Opening Range Breakout (Indicator)
This indicator visualizes the Opening Range Breakout (ORB) for the New York market session (9:30 AM – 4:00 PM NY), highlighting the High and Low of the first 5 minutes of the session.
Key Features:
Automatically calculates the High and Low of the 9:30 AM candle and updates if subsequent candles expand the range within the first 5 minutes.
Plots invisible lines representing the High and Low of the opening range throughout the session.
Fills the area between High and Low with a semi-transparent background, clearly showing the opening range zone.
Works on any intraday timeframe and adapts automatically to the NY session.
Perfect for breakout strategies, visually marking early support and resistance zones.
How to Use:
The shaded area between High and Low indicates the opening range.
Traders can watch for breakouts above the High or breakdowns below the Low for potential entry signals.
Can be combined with trend or volume indicators for confirmation.
Notes:
The session is automatically calculated using New York time.
Background transparency can be adjusted to your preference.

London Breakout Structure by Ale 2This indicator identifies market structure breakouts (CHOCH/BOS) within a specific London session window, highlighting potential breakout trades with automatic entry, stop loss (SL), and take profit (TP) levels.
It helps traders focus on high-probability breakouts when volatility increases after the Asian session, using price structure, ATR-based volatility filters, and a custom risk/reward setup.
🔹 Example of Strategy Application
Define your session (e.g. 04:00 to 05:00).
Wait for a CHOCH (Change of Character) inside this session.
If a bullish CHOCH occurs → go LONG at candle close.
If a bearish CHOCH occurs → go SHORT at candle close.
SL is set below/above the previous swing using ATR × multiplier.
TP is calculated automatically based on your R:R ratio.
📊 Example:
When price breaks above the last swing high within the session, a “BUY” label appears and the indicator draws Entry, SL, and TP levels automatically.
If the breakout fails and price closes below the opposite structure, a “SELL” signal will replace the bullish setup.
🔹 Details
The logic is based on structural shifts (CHOCH/BOS):
A CHOCH occurs when price breaks and closes beyond the most recent high/low.
The indicator dynamically detects these shifts in structure, validating them only inside your chosen time window (e.g. the London Open).
The ATR filter ensures setups are valid only when the range has enough volatility, avoiding false signals in low-volume hours.
You can also visualize:
The session area (purple background)
Entry, Stop Loss, and Take Profit levels
Direction labels (BUY/SELL)
ATR line for volatility context
🔹 Configuration
Start / End Hour: define your preferred trading window.
ATR Length & Multiplier: adjust for volatility.
Risk/Reward Ratio: set your desired R:R (default 1:2).
Minimum Range Filter: avoids signals with tight SLs.
Alerts: receive notifications when breakout conditions occur.
🔹 Recommendations
Works best on 15m or 5m charts during London session.
Designed for breakout and structure-based traders.
Works on Forex, Crypto, and Indices.
Ideal as a visual and educational tool for understanding BOS/CHOCH behavior.

Opening Range Break LRSThis script is designed for a trend-following, opening range breakout strategy. The main idea is to only trade breakouts that happen in the same direction as the short-term trend, which the script identifies using a linear regression slope.
1. Identify the Short-Term Trend
This is the first and most important step. The script does this for you using the Linear Regression and the bar coloring.
• If the bars are colored BLUE: The linear regression slope is positive. This means the script considers the short-term trend to be UP. A trader using this script would only look for long (buy) trades.
• If the bars are colored YELLOW: The linear regression slope is negative. This means the script considers the short-term trend to be DOWN. A trader using this script would only look for short (sell) trades.
This filter is designed to prevent you from trading a "false breakout" against the immediate momentum.
2. Watch the Opening Ranges Form
At the start of the trading session (8:30 AM by default), the script will begin drawing boxes for the 5, 15, 30, and 60-minute opening ranges you've enabled.
• The 5-minute box (e.g., gray) will be set after the 8:30 - 8:35 period.
• The 15-minute box (e.g., blue) will be set after the 8:30 - 8:45 period.
• ...and so on.
These boxes, which extend for the rest of the day, represent the key high and low levels established at the open. The "Live Box Extension" input simply keeps the right edge of the box a few bars away from the current price so you can see it clearly.
3. Look for a Filtered Breakout Signal
This is where the trend filter (Step 1) and the range boxes (Step 2) come together.
Bullish Trade Example (Long):
1. A trader sees the bars are colored BLUE (uptrend). They are now only looking for a break above one of the ORB highs.
2. They will ignore any break below the ORB lows, as that would be trading against the trend filter.
3. The price moves up and finally closes above the 15-minute ORB high.
4. The script will plot a green "Break 15" label. This is the trader's signal to enter a long trade.
Bearish Trade Example (Short):
1. A trader sees the bars are colored YELLOW (downtrend). They are now only looking for a break below one of the ORB lows.
2. They will ignore any break above the ORB highs.
3. The price moves down and closes below the 5-minute ORB low.
4. The script will plot a red "Break 5" label. This is the trader's signal to enter a short trade.
4. Use Multiple Timeframes for Context
The real power of this script is seeing all the ranges at once. A trader wouldn't just trade them in isolation.
• Confirmation: A "Break 5" signal is a quick, early signal. But if the price also breaks the "15" and "30" minute highs, it signals much stronger bullish consensus, which might encourage the trader to hold the trade longer.
• Support & Resistance: The other ORB levels act as a map for the day.
o As Targets: If a trader takes a "Break 15" long signal, the 30-minute ORB high and 60-minute ORB high become logical profit targets.
o As Warning Signs: If the price gives a "Break 5" long signal but is struggling right under the 15-minute high, a trader might wait for that 15-minute level to break before entering, seeing it as a key resistance level.
Summary: A Trader's Workflow
1. Morning (8:30 AM): Watch the script. What color are the bars? (Blue = longs only, Yellow = shorts only).
2. Wait: Let the 5, 15, 30, and 60-minute ranges form. The boxes will be drawn on the chart.
3. Execute: Wait for a "Break" signal (a label) that matches your trend direction.
4. Manage: Use the other ORB levels as potential profit targets or as confirmation of the move's strength.
5. Single Signal: The "Single Signal Only" input, if checked, ensures they only get one signal per timeframe (e.g., one "Break 15" long, and that's it for the day), which helps prevent over-trading in choppy conditions.

Strat 1-2 Break AlertsThe Strat 1-2 Break Alerts
by Yolanda Marie Dixon
This indicator automatically identifies Inside Bars (1) and alerts when price breaks out into a 2-1-2 Bullish or 2-1-2 Bearish setup — two of the most actionable patterns in The Strat methodology created by Rob Smith.
📊 What It Does:
Marks Inside Bars with a yellow triangle below the candle.
Plots a green “2-1-2↑” triangle when a bullish breakout occurs.
Plots a red “2-1-2↓” triangle when a bearish breakdown occurs.
Provides built-in alerts so traders never miss a 2-1-2 setup.
💡 How to Use It:
Add the indicator to your chart, then go to Alerts → Create Alert → Condition: Strat 1-2 Break Alerts, and choose either 2-1-2 Up or 2-1-2 Down.
Perfect for traders who follow The Strat and want simple, reliable visual and alert-based signals for 1-2 setups.
—
🔔 Stay ready, stay Stratified.
Master The Strat with instant alerts for every 2-1-2 breakout.

RSI Breakout Zones█ OVERVIEW
“RSI Breakout Zones” is a technical analysis tool that identifies significant zones on the chart based on the Relative Strength Index (RSI). The indicator maps overbought (OB) and oversold (OS) zones using boxes, then extends them until the next zone of the same type is detected, highlighting breakout points to aid in trade entry decisions. These zones often serve as areas of consolidation, support, or resistance.
█ CONCEPTS
The indicator identifies overbought (above 70) and oversold (below 30) zones, drawing boxes that extend until the next zone of the same type (OB for OB, OS for OS) is detected. Breakout signals are generated when the price crosses the zone boundaries, indicating potential shifts in market momentum.
Why are RSI zones important? These zones represent areas of extreme market sentiment, often leading to corrections or reversals. Overbought zones suggest potential selling pressure, while oversold zones indicate buying opportunities. After a breakout, a zone may switch roles, e.g., from support to resistance or vice versa, making it a key element in price action analysis. Larger zones, formed during high volatility, may attract price for retests due to stronger imbalances in buyer/seller dynamics. Consolidation often occurs within these zones as the market seeks equilibrium before further moves. However, in strong trends, zones may be decisively broken without immediate pullbacks, and their significance depends on their position relative to key support and resistance levels.
█ FEATURES
- RSI Zone Detection: Calculates RSI with a customizable length (default 14) and identifies overbought/oversold zones based on user-defined levels (default 70/30), drawing boxes that dynamically adjust to price action within the zone.
- Customizable Boxes: Zones extend until the next zone of the same type is detected. The indicator draws zones with adjustable colors for overbought (red) and oversold (green) areas, with options for box and zone transparency.
- Breakout Signals: Generates upward (green triangle) and downward (red triangle) breakout signals when the price crosses the top or bottom of a zone. Signals appear below or above the bar, indicating potential trade entry points.
- Midline: Automatically draws a dashed line at the midpoint of each zone, helping traders assess price behavior within the zone and potential halfway retests.
- Box Management: Option to remove outdated boxes.
- Alerts: Built-in support for alerts on breakout signals, enabling traders to receive notifications for key zone crossings.
█ HOW TO USE
Add to Chart: Apply the indicator to your TradingView chart via the Pine Editor or Indicators menu.
Configure Settings:
- RSI Settings: Adjust RSI Length (default 14), Overbought Level (default 70), and Oversold Level (default 30) to tailor zone detection sensitivity—higher lengths smooth signals for longer-term analysis.
- Box Settings: Configure colors and transparency for overbought (red) and oversold (green) zones, including box transparency (default 90) and zone transparency (default 90).
- Signal Settings: Customize breakout signal colors (green for upward, red for downward) and enable/disable keeping boxes after RSI normalization.
Interpreting Signals:
- Upward Breakout Signal: A green triangle below the bar indicates a breakout, suggesting potential bullish momentum and trend continuation or reversal.
- Downward Breakout Signal: A red triangle above the bar indicates a breakout, suggesting potential bearish momentum.
- RSI Zones: If the price re-enters a zone after a breakout, it may signal a false breakout or consolidation; persistent zones can act as future support/resistance levels. Consolidation often occurs within these zones as the market seeks equilibrium.
- Use signals alongside other technical analysis tools for confirmation, such as moving averages (to confirm trend direction), Fibonacci levels (to identify key price zones), or volume indicators (to validate breakout strength). Analyze RSI zones on higher timeframes for stronger signals due to broader market context.
█ APPLICATIONS
- Momentum Trading: Use RSI zones as overbought/oversold filters. In an uptrend, look for buying opportunities on upward breakouts, and in a downtrend, on downward breakouts. Combining with MACD crossovers, Fibonacci levels, or pivot points enhances zone significance.
- Inter-Zone Trading: Utilize breakouts from one RSI zone and hold the position until reaching the next zone, which may act as a target level or reversal point.
█ NOTES
- Test the indicator across different timeframes and markets (stocks, forex, crypto) to optimize RSI length and levels for your trading style.
- For best results, use in trending markets where RSI extremes are more predictive; in ranging markets, additional filters are recommended to reduce false signals.
- Always combine with risk management; RSI zones alone do not guarantee reversals, and false breakouts may occur in low-liquidity environments.

Market Structure ICT Screener [TradingFinder] BoS ChoCh🔵 Introduction
Market Structure is the foundation of every Smart Money and ICT based trading model. It describes how price moves through a sequence of highs and lows, forming clear phases of expansion, retracement and reversal. Understanding this structure allows traders to read institutional order flow and align their positions with the true direction of liquidity.
Two of the most critical components in Market Structure are the Break of Structure (BOS) and Change of Character (CHOCH). A BOS represents trend continuation, confirming strength within the current direction. In contrast, CHOCH also known as a Market Structure Shift (MSS) signals the first sign of a trend reversal or liquidity shift where order flow begins to change from bullish to bearish or vice versa.
Because the market is fractal, structure can exist at multiple levels known as Major (External) and Minor (Internal). Major structure defines the overall trend on higher timeframes while minor or internal structure reveals short term swings and early reversals within that larger move.
🔵 How to Use
Understanding Market Structure starts with identifying how price interacts with previous swing highs and swing lows. Every trend in the market, whether bullish or bearish, is built from a sequence of impulsive and corrective moves. Impulsive legs show strong displacement in the direction of liquidity flow, while corrective legs represent temporary pullbacks as the market rebalances before the next expansion. Recognizing these sequences is essential for reading the story of price and anticipating what may happen next.
A Break of Structure (BOS) occurs when price decisively moves beyond a previous structural point by breaking above the last high in an uptrend or falling below the last low in a downtrend. This event confirms that the current trend remains intact and that liquidity has been successfully taken from one side of the market. A BOS acts as confirmation of continuation and reflects strength within the existing directional bias.
A Change of Character (CHOCH) appears when price violates structure in the opposite direction of the prevailing trend. This is the first signal that market sentiment and order flow may be shifting. For example, during a downtrend if price breaks above a previous high, it indicates that sellers are losing control and a potential bullish reversal may be developing. In an uptrend, when price drops below a recent low, it suggests a possible bearish transition.
Because the market is fractal, structure exists across multiple layers. Major structure reflects the dominant movement visible on higher timeframes and defines the broader directional bias. Minor or internal structure represents smaller swings within that move and helps identify early transitions before they appear on the higher timeframe. When internal and external structures align, they offer a high probability signal for trend continuation or reversal.
By observing BOS and CHOCH across both internal and external structures, traders can clearly visualize when the market is expanding, contracting or preparing to shift direction. This structured understanding of price movement forms the foundation for precise trend analysis and high quality decision making in any Smart Money or ICT based trading approach.
🔵 Settings
🟣 Display Settings
Table on Chart : Allows users to choose the position of the signal dashboard either directly on the chart or below it, depending on their layout preference.
Number of Symbols : Enables users to control how many symbols are displayed in the screener table, from 10 to 20, adjustable in increments of 2 symbols for flexible screening depth.
Table Mode : This setting offers two layout styles for the signal table :
Basic : Mode displays symbols in a single column, using more vertical space.
Extended : Mode arranges symbols in pairs side-by-side, optimizing screen space with a more compact view.
Table Size : Lets you adjust the table’s visual size with options such as: auto, tiny, small, normal, large, huge.
Table Position : Sets the screen location of the table. Choose from 9 possible positions, combining vertical (top, middle, bottom) and horizontal (left, center, right) alignments.
🟣 Symbol Settings
Each of the 20 symbol slots comes with a full set of customizable parameters :
Symbol : Define or select the asset (e.g., XAUUSD, BTCUSD, EURUSD, etc.).
Timeframe : Set your desired timeframe for each symbol (e.g., 15, 60, 240, 1D).
Pivot Period : Set the length used to detect swing highs and lows. Shorter values increase sensitivity, longer ones focus on major structures.
🔵 Conclusion
Mastering Market Structure and understanding the relationship between BOS and CHOCH allows traders to see the market with greater clarity and confidence. These two elements reveal how liquidity moves through different phases of expansion and retracement and how institutional order flow shifts between accumulation and distribution.
By analyzing both internal and external structures, traders can align short term and long term perspectives and anticipate where price is most likely to react. The ability to read these structural shifts helps identify continuation points, reversals and areas where liquidity is engineered or collected.
Incorporating Market Structure into a consistent trading process transforms the way a trader views the chart. Instead of reacting to random movements, each swing, break and shift becomes part of a logical framework that reflects the true behavior of the market. Understanding BOS and CHOCH is not just a concept but a complete language of price that guides every professional decision in Smart Money and ICT based trading.

Trendline Breakouts With Targets [ omerprıme ]Indicator Explanation (English)
This indicator is designed to detect trendline breakouts and provide early trading signals when the price breaks key support or resistance levels.
Trendline Detection
The indicator identifies recent swing highs and lows to construct dynamic trendlines.
These trendlines act as support in an uptrend and resistance in a downtrend.
Breakout Confirmation
When the price closes above a resistance trendline, the indicator generates a bullish breakout signal.
When the price closes below a support trendline, it generates a bearish breakout signal.
Filtering False Signals
To reduce false breakouts, additional conditions (such as candle confirmation, volume filters, or price momentum) can be applied.
Only significant and confirmed breakouts are highlighted.
Trading Logic
Buy signals are triggered when the price breaks upward through resistance with confirmation.
Sell signals are triggered when the price breaks downward through support with confirmation.

Bollinger Keltner Squeeze Indicator (BBKC)Bollinger Keltner Squeeze Indicator (BBKC)This single-pane indicator combines the power of Bollinger Bands (BB) and Keltner Channels (KC) to accurately identify periods of low volatility compression—the famous Squeeze—which often precedes large, directional moves.Designed for traders utilizing Accumulation, Manipulation, Distribution (AMD) strategies, this tool makes spotting the 'Accumulation' phase simple and visually clear, perfect for high BTC Beta equities or futures markets like MES and MNQ.Key Features:Clear Squeeze Visualization:The background of the main chart is shaded Orange when the Squeeze is active (BB is inside KC). This immediately highlights periods of extreme compression.A simple Red/Green Dot below the chart confirms the Squeeze state (Red = Squeeze ON, Green = Squeeze OFF).Momentum Histogram:A built-in momentum oscillator smooths price action and guides the anticipated direction of the breakout.Teal/Orange Bars: Indicate momentum direction while the Squeeze is active (building pressure).Bright Green/Red Bars: Indicate momentum direction after the Squeeze has broken (expansion/breakout).How to Find Maximum Volatility Compression (The "Tightest" Squeeze)To align this indicator with a strategy focused on catching only the most extreme volatility compression—the key to those explosive moves—traders should adjust the Keltner Channel Multiplier setting.Setting Name: KC Multiplier (ATR)Default Value: 1.5Recommended Adjustment: To filter for only the absolute tightest squeezes (where price is least volatile), decrease this multiplier value, typically down to 1.25 or even 1.0.By lowering the KC Multiplier (ATR), you narrow the Keltner Channel boundaries. This requires the Bollinger Bands to compress even further to fit inside, ensuring the indicator only signals the Squeeze state during moments of truly minimal volatility, setting you up for maximum opportunity.

Cycle-Synced Channel Breakout📌 Cycle-Synced Channel Breakout – Detect Breakouts Confirmed by Candles and Momentum Cycles
📖 Overview
The Cycle-Synced Channel Breakout indicator is a precision breakout detection tool that combines the power of:
• Adaptive Keltner Channels
• Dominant Cycle Period Analysis (Ehlers-inspired)
• Candlestick Pattern Recognition (Engulfing)
This multi-layered approach helps identify true breakout opportunities by filtering out noise and false signals, making it ideal for swing traders and intraday traders seeking high-probability directional moves.
⚙️ How It Works
1. Keltner Channel Envelope
A dynamic volatility channel based on the EMA and ATR defines the upper and lower bounds of price movement.
2. Engulfing Candle Detection
The script detects strong bullish and bearish engulfing patterns, which often signal trend reversals or momentum continuations.
3. Dominant Cycle Momentum (Ehlers-inspired)
Using a smoothed power oscillator derived from a detrended price series, the indicator assesses whether momentum is accelerating during the breakout — filtering out weak moves.
4. Signal Confirmation Logic
A signal is only shown when:
• An engulfing pattern is detected, and
• Price breaks out of the Keltner Channel, and
• Momentum (cycle power) is rising
5. Visual Feedback
• Breakout signals are plotted with “BUY” or “SELL” labels
• Faded green/red background highlights confirmed breakouts
• Optional display of engulfing candles with triangle markers
⸻
🛠️ Key Features
• ✅ Adaptive Keltner Channels
• ✅ Bullish/Bearish Engulfing Candle Recognition
• ✅ Ehlers-style Cycle Momentum Confirmation
• ✅ Background highlights for confirmed breakouts
• ✅ Optional candle pattern visualization
• ✅ Lightweight and Pine v6 compatible
⸻
🧪 Inputs
• Keltner Length – EMA period for channel basis
• Multiplier – Multiplied with ATR to determine band width
• Cycle Lookback – Used to calculate smoothed cycle power
• Show Engulfing Candles? – Toggles candlestick signals
• Show Breakout Signals? – Toggles breakout labels and backgrounds
⸻
🧠 How to Use
• Look for “BUY” or “SELL” labels when:
• An engulfing candle breaks through the Keltner Channel
• Cycle momentum confirms strength behind the move
• The background color will faintly highlight the breakout direction.
• Use in combination with other trend or volume indicators for added confluence.
🔒 Notes
• This indicator is not repainting.
• It is designed for educational and research purposes only.
• Works across all timeframes and asset classes (stocks, crypto, forex, etc.)

ORB Breakout Traffic Signal (5/15/30)ORB Breakout Traffic Signal (5/15/30)
This indicator visualizes Opening Range Breakouts (ORB) for the first 5, 15, and 30 minutes of the US regular trading session (09:30–16:00 ET).
It provides a compact, easy-to-read traffic signal table on your chart to show whether price is breaking out, breaking down, or consolidating inside the range.
🔑 Features
Auto-anchors at 09:30 ET (converted to your local time automatically).
Tracks ORB High/Low for:
5-minute window (09:30–09:34)
15-minute window (09:30–09:44)
30-minute window (09:30–09:59)
Displays results in a compact table:
↑ (green) → price has broken above the ORB high
↓ (red) → price has broken below the ORB low
• (gray) → price remains inside the ORB range (optional; can be disabled)
Customizable:
Toggle which ORBs to show (5m, 15m, 30m)
Choose table position (top/bottom left/right)
Adjustable text size
Option to plot the ORB High/Low lines on your chart
📌 Usage
Designed for intraday traders watching US equities/ETFs/futures.
Works best on 1-minute or 5-minute charts with Extended Hours turned OFF (so the session starts exactly at 09:30 ET).
Helps you quickly spot early breakouts (5m), mid-session trends (15m), or confirmed directional moves (30m).
⚠️ Notes
Signals only update during the RTH session
Outside market hours, the last locked ORB and signal remain displayed until the next open.
This tool is for analysis/visualization only; not a buy/sell signal. Always combine with your own trading strategy and risk management.
👉 Perfect for traders who want a quick visual confirmation of whether price is breaking out of the opening range or stuck inside it.

Volumetric Support and Resistance [BackQuant]Volumetric Support and Resistance
What this is
This Overlay locates price levels where both structure and participation have been meaningful. It combines classical swing points with a volume filter, then manages those levels on the chart as price evolves. Each level carries:
• A reference price (support or resistance)
• An estimate of the volume that traded around that price
• A touch counter that updates when price retests it
• A visual box whose thickness is scaled by volatility
The result is a concise map of candidate support and resistance that is informed by both price location and how much trading occurred there.
How levels are built
Find structural pivots uses ta.pivothigh and ta.pivotlow with a user set sensitivity. Larger sensitivity looks for broader swings. Smaller sensitivity captures tighter turns.
Require meaningful volume computes an average volume over a lookback period and forms a volume ratio for the current bar. A pivot only becomes a level when the ratio is at least the volume significance multiplier.
Avoid clustering checks a minimum level distance (as a percent of price). If a candidate is too close to an existing level, it is skipped to keep the map readable.
Attach a volume strength to the level estimates volume strength by averaging the volume of recent bars whose high to low range spans that price. Levels with unusually high strength are flagged as high volume.
Store and draw levels are kept in an array with fields for price, type, volume, touches, creation bar, and a box handle. On the last bar, each level is drawn as a horizontal box centered at the price with a vertical thickness scaled by ATR. Borders are thicker when the level is marked high volume. Boxes can extend into the future.
How levels evolve over time
• Aging and pruning : levels are removed if they are too old relative to the lookback or if you exceed the maximum active levels.
• Break detection : a level can be removed when price closes through it by more than a break threshold set as a fraction of ATR. Toggle with Remove Broken Levels.
• Touches : when price approaches within the break threshold, the level’s touch counter increments.
Visual encoding
• Boxes : support boxes are green, resistance boxes are red. Box height uses an ATR based thickness so tolerance scales with volatility. Transparency is fixed in this version. Borders are thicker on high volume levels.
• Volume annotation : show the estimated volume inside the box or as a label at the right. If a level has more than one touch, a suffix like “(2x)” is appended.
• Extension : boxes can extend a fixed number of bars into the future and can be set to extend right.
• High volume bar tint : bars with volume above average × multiplier are tinted green if up and red if down.
Inputs at a glance
Core Settings
• Level Detection Sensitivity — pivot window for swing detection
• Volume Significance Multiplier — minimum volume ratio to accept a pivot
• Lookback Period — window for average volume and maintenance rules
Level Management
• Maximum Active Levels — cap on concurrently drawn levels
• Minimum Level Distance (%) — required spacing between level prices
Visual Settings
• Remove Broken Levels — drop a level once price closes decisively through it
• Show Volume Information on Levels — annotate volume and touches
• Extend Levels to Right — carry boxes forward
Enhanced Visual Settings
• Show Volume Text Inside Box — text placement option
• Volume Based Transparency and Volume Based Border Thickness — helper logic provided; current draw block fixes transparency and increases border width on high volume levels
Colors
• Separate colors for support, resistance, and their high volume variants
How it can be used
• Trade planning : use the most recent support and resistance as reference zones for entries, profit taking, or stop placement. ATR scaled thickness provides a practical buffer.
• Context for patterns : combine with breakouts, pullbacks, or candle patterns. A breakout through a high volume resistance carries more informational weight than one through a thin level.
• Prioritization : when multiple levels are nearby, prefer high volume or higher touch counts.
• Regime adaptation : widen sensitivity and increase minimum distance in fast regimes to avoid clutter. Tighten them in calm regimes to capture more granularity.
Why volume support and resistance is used in trading
Support and resistance relate to willingness to transact at certain prices. Volume measures participation. When many contracts change hands near a price:
• More market players hold inventory there, often creating responsive behavior on retests
• Order flow can concentrate again to defend or to exit
• Breaks can be cleaner as trapped inventory rebalances
Conditioning level detection on above average activity focuses attention on prices that mattered to more participants.
Alerts
• New Support Level Created
• New Resistance Level Created
• Level Touch Alert
• Level Break Alert
Strengths
• Dual filter of structure and participation, reducing trivial swing points
• Self cleaning map that retires old or invalid levels
• Volatility aware presentation using ATR based thickness
• Touch counting for persistence assessment
• Tunable inputs for instrument and timeframe
Limitations and caveats
• Volume strength is an approximation based on bars spanning the price, not true per price volume
• Pivots confirm after the sensitivity window completes, so new levels appear with a delay
• Narrow ranges can still cluster levels unless minimum distance is increased
• Large gaps may jump past levels and immediately trigger break conditions
Practical tuning guide
• If the chart is crowded: increase sensitivity, increase minimum level distance, or reduce maximum active levels
• If useful levels are missed: reduce volume multiplier or sensitivity
• If you want stricter break removal: increase the ATR based break threshold in code
• For instruments with session patterns: tailor the lookback period to a representative window
Interpreting touches and breaks
• First touch after creation is a validation test
• Multiple shallow touches suggest absorption; a later break may then travel farther
• Breaks on high current volume merit extra attention
Multi timeframe usage
Levels are computed on the active chart timeframe. A common workflow is to keep a higher timeframe instance for structure and a lower timeframe instance for execution. Align trades with higher timeframe levels where possible.
Final Thoughts
This indicator builds a lightweight, self updating map of support and resistance grounded in swings and participation. It is not a full market profile, but it captures much of the practical benefit with modest complexity. Treat levels as context and decision zones, not guarantees. Combine with your entry logic and risk controls.

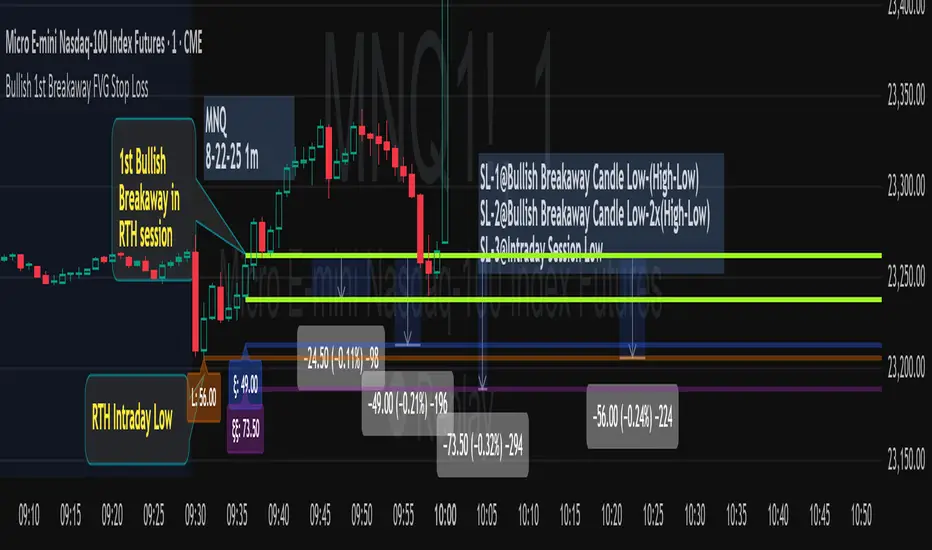
Bullish 1st Breakaway FVG Stop Loss
This indicator provides a defined 3-tier stop loss placement when you want to trade the 1st Bullish Breakaway FVG strategy. The Bullish Breakaway Dual Session FVG indicator is an independent indicator that track all bullish breakaway candles, however this one only tracks the very 1st breakaway candle with a stop loss visual cue.
Introduction of Bullish Breakaway Consolidated FVG:
Inspired by the FVG Concept:
This indicator is built on the Fair Value Gap (FVG) concept, with a focus on Consolidated FVG. Unlike traditional FVGs, this version only works within a defined session (e.g., ETH 18:00–17:00 or RTH 09:30–16:00).
Bullish consolidated FVG & Bullish breakaway candle
Begins when a new intraday low is printed. After that, the indicator searches for the 1st bullish breakaway candle, which must have its low above the high of the intraday low candle. Any candles in between are part of the consolidated FVG zone. Once the 1st breakaway forms, the indicator will shades the candle’s range (high to low).
Session Reset: Occurs at session close.
Choose your own session: use 930 to 1615 for RTH, 1800 to 1615 for ETH. (New York Time Zone)
Repaint Behavior:
If a new intraday (or intra-session) low forms, earlier breakaway patterns are wiped, and the system restarts from the new low.
Product Optimization:
This indicator is designed for CME future product with New York time zone. If you want to trade other products, please adjust your own time session.
Entry:
Long after the 1st Bullish Breakaway Candle in your active session.
However, best position of long is executed by your own trading skill and edge.
Stop Loss: ξ
ξ: This is the 1st stop loss, it is 1 equal size of the breakaway candle below the low.
ξξ: This is the 2nd stop loss, it is 2 equal sizes of the breakaway candle below the low.
L: This is the 3rd stop loss, it is the intraday session low.
Stop loss calculation:
Assuming you enter at the high of the breakaway candle, the SL number is shown as the high minus the stop loss placement.
Last Mention:
If you don't see anything in the indicator, adjust your session to an active session only, and use Tradingview replay function. This indicator is a live indicator with repainting mechanism.
Lumiere’s Indicator BundleThe Lumiere’s Indicator Bundle combines three of Lumiere’s most used tools into one script:
🔹 BOS Mark-out – Marks Breaks of Structure with clear bullish/bearish levels and optional alerts.
🔹 Liquidity Mark-ou t – Draws significant swing highs/lows and automatically removes them once swept.
🔹 Trading Session High/Low – Tracks Asia, London, and New York session ranges with customizable timezone.
Why this bundle?
I made this bundle so everyone can run all my indicators at once without having to pick and choose between them or worry about chart space limits.
Instead of loading 3 separate indicators, this package gives you everything in one place. You can toggle each module (BOS, Liquidity, Sessions) on or off from the settings. All inputs are kept clean and organized in their own sections for easy adjustments.
What to expect
BOS lines always plotted on top for maximum clarity.
Liquidity highs/lows update in real time and get removed when taken out.
Session ranges show the active session’s high/low and can mark sweeps after the session closes.
Default timezone is New York (UTC-4), but you can switch to any TradingView-supported timezone.
BOS alerts are included, so you’ll never miss a structural break.

SmartPlusSmartPlus
Overview
The SmartPlus indicator is a complete framework for intraday traders. It combines key market reference points (VWAP, moving averages, and the first 15-minute high/low range) with predictive levels based on historical daily moves. Together, these elements allow traders to build directional bias, spot breakouts, and manage risk throughout the session.
Key Features
1. VWAP (Volume-Weighted Average Price)
- Plots the intraday VWAP in real time.
- VWAP acts as a central “fair value” reference point for institutional order flow.
- Price trading above VWAP generally suggests bullish bias, while below VWAP leans bearish.
2. Exponential Moving Averages (EMAs)
- Two configurable EMAs are included:
- Fast EMA (default: 21 periods)
- Slow EMA (default: 34 periods)
- Each EMA is plotted with a single, user-selectable color for clarity.
- Crossovers or alignment between price, VWAP, and EMAs help define market structure.
3. Smart Bar Coloring
- Candles automatically change color when conditions align:
- Bull Zone: Price above VWAP, Fast EMA, and Slow EMA.
- Bear Zone: Price below VWAP, Fast EMA, and Slow EMA.
- Fluorescent bar coloring helps highlight momentum zones visually without additional analysis.
4. First 15-Minute High/Low/Mid (Automatic)
- Automatically detects the first 15 minutes of each new trading day (no manual input required).
- Plots horizontal lines for:
- First 15-Minute High (green)
- First 15-Minute Low (red)
- Midpoint of that range (gray)
- Once the initial 15-minute window ends, these levels remain projected throughout the session as breakout or support/resistance zones.
- Alerts trigger when price breaks above the high or below the low after the window.
5. Daily Support/Resistance Forecast
- Uses a rolling lookback of recent daily ranges (default: 126 days).
- Tracks average up moves and down moves from the daily open.
- Optionally incorporates standard deviation for wider confidence bands.
- Plots forecast levels above/below the current day’s open for reference.
Trading Logic (How to Use)
- Bullish Bias:
- Price is above VWAP, above both EMAs, and ideally above the first 15-minute high.
- This setup suggests trend continuation or breakout opportunities on the long side.
- Bearish Bias:
- Price is below VWAP, below both EMAs, and ideally below the first 15-minute low.
- This setup suggests downward pressure or breakout opportunities on the short side.
- Neutral / Caution Zone:
- Price caught between VWAP, EMAs, or inside the 15-minute range often signals indecision.
- Best to wait for confirmation or breakout before committing to trades.
Expectations After Using It
- The script provides context and structure, not trading signals.
- It highlights where price is relative to meaningful market levels so traders can act with greater confidence.
- Combining VWAP, EMAs, and the 15-minute breakout framework helps traders stay aligned with the market’s natural rhythm.
Disclaimer
This script is a tool for market analysis and educational purposes only.
It does not constitute financial advice, trading recommendations, or guaranteed profitability.
Markets are inherently risky, and past patterns do not ensure future results.
Always combine this tool with sound risk management, personal research, and professional guidance before making any trading decisions.

Nifty Smart Zones & Breakout Bars(5min TF only) by Chaitu50cNifty Smart Zones & Breakout Bars is a purpose-built intraday trading tool, tested extensively on Nifty50 and recommended for Nifty50 use only.
All default settings are optimised specifically for Nifty50 on the 5-minute timeframe for maximum accuracy and clarity.
Why Last Bar of the Session Matters
The last candle of a trading session often represents the final battle between buyers and sellers for that day.
It encapsulates closing sentiment, influenced by end-of-day positioning, profit booking, and institutional activity.
The high and low of this bar frequently act as strong intraday support/resistance in the following sessions.
Price often reacts around these levels, especially when combined with volume surges.
Core Features
Session Last-Candle Zones
Plots a horizontal box at the high and low of the last candle in each session.
Boxes extend to the right to track carry-over levels into new sessions.
Uses a stateless approach — past zones reappear if relevant.
Smart Suppression System
When more than your Base Sessions (No Suppression) are shown, newer zones overlapping or within a proximity distance (in points) of older zones are hidden.
Older zones take priority, reducing chart clutter while keeping critical levels.
Breakout Bar Coloring
Highlights breakout bars in four categories:
Up Break (1-bar)
Down Break (1-bar)
Up Break (2-bar)
Down Break (2-bar)
Breakouts use a break buffer (in ticks) to filter noise.
Toggle coloring on/off instantly.
Volume Context (User Tip)
For best use, pair with volume analysis.
High-volume breakouts from last-session zones have greater conviction and can signal sustained momentum.
Usage Recommendations
Instrument: Nifty50 only (tested & optimised).
Timeframe: 5-minute chart for best results.
Approach:
Watch for price interaction with the plotted last-session zones.
Combine zone breaks with bar color signals and volume spikes for higher-probability trades.
Use suppression to focus on key, non-redundant levels.
Why This Tool is Different
Unlike standard support/resistance plotting, this indicator focuses on session-closing levels, which are more reliable than arbitrary highs/lows because they capture the final market consensus for the session.
The proximity-based suppression ensures your chart stays clean, while breakout paints give instant visual cues for momentum shifts.

BTC/USD Confluence Breakout Pro – IST EditionBTC/USD Confluence Breakout Pro – IST Edition is a multi-factor breakout trading system designed for intraday and swing traders.
It combines trend, momentum, price action, volume, and candlestick analysis with time-based volatility windows to deliver high-probability Buy/Sell signals.
Key Features:
Trend Filters: EMA 9/21 crossover + optional EMA 200 bias filter.
Price Action Breakouts: Detects closes above/below the last N bars’ range.
Candlestick Patterns: Bullish/Bearish engulfing, hammer, and shooting star.
Momentum Indicators: RSI (14) with configurable thresholds, MACD (12/26/9).
Volume Confirmation: Volume spike vs 20-period SMA.
IST Breakout Windows: Highlights Early London, London–US Overlap, and US Open momentum periods (Hyderabad/IST time). Optionally restricts signals to these windows.
Risk Management: ATR-based stop-loss + auto-plotted 1R, 2R, and 3R take-profit levels.
Visual Aids: EMA plots, bar coloring, shaded volatility windows, and clear entry/exit labels.
Alerts: Configurable alerts for both Buy and Sell signals.
Best Use:
Apply on 1m–15m charts for intraday trading or 1H–4H for swings.
Works best during high-volatility IST windows (London–US overlap & US open).
Ideal for BTC/USD but adaptable to other crypto or forex pairs.

Zero Lag Liquidity [AlgoAlpha]🟠 OVERVIEW
This script plots liquidity zones with zero lag using lower-timeframe wick profiles and high-volume wicks to mark key price reactions. It’s called Zero Lag Liquidity because it captures significant liquidity imbalances in real time by processing lower-TF price-volume distributions directly inside the wick of abnormal candles. The tool builds a volume histogram inside long upper/lower wicks, then calculates a local Point of Control (POC) to mark the price where most volume occurred. These levels act as visual liquidity zones, which can trigger labels, break signals, and trend detection depending on price interaction.
🟠 CONCEPTS
The core concept relies on identifying high-volume candles with unusually long wicks—often a sign of opposing liquidity. When a large upper or lower wick appears with a strong volume spike, the script builds a histogram of lower-timeframe closes and volumes inside that wick. It bins the wick into segments, sums volume per bin, and finds the POC. This POC becomes the liquidity level. The script then dynamically tracks whether price breaks above or rejects off these levels, adjusts the active trend regime accordingly, and highlights bars to help users spot continuation or reversal behavior. The logic avoids repainting or subjective interpretation by using fixed thresholds and lower-TF price action.
🟠 FEATURES
Dynamic liquidity levels rendered at POC of significant wicks, colored by bullish/bearish direction.
Break detection that removes levels once price decisively crosses them twice in the same direction.
Rejection detection that plots ▲/▼ markers when price bounces off levels intrabar.
Volume labels for each level, shown either as raw volume or percentage of total level volume.
Candle coloring based on trend direction (break-dominant).
🟠 USAGE
Use this indicator to track where liquidity has most likely entered the market via abnormal wick events. When a long wick forms with high volume, the script looks inside it (using your chosen lower timeframe) and marks the most traded price within it. These levels can serve as expected reversal or breakout zones. Rejections are marked with small arrows, while breaks trigger trend shifts and remove the level. You can toggle trend coloring to see directional bias after a breakout. Use the wick multiplier to control how selective the detector is (higher = stricter). Alerts and label modes help customize the signal for different asset types and chart styles.

Opening-Range BreakoutNote: Default trading date range looks mediocre. Set date range to "Entire History" to see full effect of the strategy. 50.91% profitable trades, 1.178 profit factor, steady profits and limited drawdown. Total P&L: $154,141.18, Max Drawdown: $18,624.36. High R^2
█ Overview
The Opening-Range Breakout strategy is a mechanical, session‑based day‑trading system designed to capture the initial burst of directional momentum immediately following the market open. It defines a user‑configurable “opening range” window, measures its high and low boundaries, then places breakout stop orders at those levels once the range closes. Built‑in filters on minimum range width, reward‑to‑risk ratios, and optional reversal logic help refine entries and manage risk dynamically.
█ How It Works
Opening‑Range Formation
Between 9:30–10:15 AM ET (configurable), the script tracks the highest high and lowest low to form the day’s opening range box.
On the first bar after the range window closes, the range high (OR_high) and low (OR_low) are “locked in.”
Range‑Width Filter
To avoid false breakouts in low‑volatility mornings, the range must be at least X% of the current price (default 0.35%).
If the measured opening-range width < minimum threshold, no orders are placed that day.
Entry & Order Placement
Long: a stop‑buy order at the opening‑range high.
Short: a stop‑sell order at the opening‑range low.
Only one side can trigger (or both if reverse logic is enabled after a losing trade).
Risk Management
Once triggered, each trade uses an ATR‑style stop-loss defined as a percentage retracement of the range (default 50% of range width).
Profit target is set at a configurable Reward/Risk Ratio (default 1.1×).
Optional: Reverse on Stop‑Loss – if the initial breakout loses, immediately reverse into the opposite side on the same day.
Session Exit
Any open positions are closed at the end of the regular trading day (default 3:45 PM ET window end, with hard flat at session close).
Visual cues are provided via green (range high) and red (range low) step‑line plots directly on the chart, allowing you to see the range box and breakout triggers in real time.
█ Why It Works
Early Momentum Capture: The first 15 – 60 minutes of trading encapsulate overnight news digestion and institutional order flow, creating a well‑defined volatility “range.”
Mechanical Discipline: Clear, rule‑based entries and exits remove emotional guesswork, ensuring consistency.
Volatility Filtering: By requiring a minimum range width, the system avoids choppy, low‑range days where false breakouts are common.
Dynamic Sizing: Stops and targets scale with the opening range, adapting automatically to each day’s volatility environment.
█ How to Use
Set Your Instruments & Timeframe
-Apply to any futures contract on a 1‑ to 5‑minute chart.
-Ensure chart timezone is set to America/New_York.
Configure Inputs
-Opening‑Range Window: e.g. “0930-1015” for a 45‑minute range.
-Min. OR Width (%): e.g. 0.35 for 0.35% of current price.
-Reward/Risk Ratio: e.g. 1.1 for a modest profit target above your stop.
-Max OR Retracement %: e.g. 50 to set stop at 50% of range width.
-One Trade Per Day: toggle to limit to a single breakout.
-Reverse on Stop Loss: toggle to flip direction after a losing breakout.
Monitor the Chart
-Watch the green and red range boundaries form during the session open.
-Orders will automatically submit on the first bar after the range window closes, conditioned on your filters.
Review & Adjust
-Backtest across multiple months to validate performance on your preferred contract.
-Tweak range duration, minimum width, and R/R multiple to fit your risk tolerance and desired win‑rate vs. expectancy balance.
█ Settings Reference
Input Defaults
Opening‑Range Window - Time window to form OR (HHMM-HHMM) - 0930–1015
Regular Trading Day - Full session for EOD flat (HHMM-HHMM) - 0930–1545
Min. OR Width (%) - Minimum OR size as % of close to trigger orders - 0.35
Reward/Risk Ratio - Profit target multiple of stop‑loss distance - 1.1
Max OR Retracement (%) - % of OR width to use as stop‑loss distance - 50
One Trade Per Day - Limit to a single breakout order per day - false
Reverse on Stop Loss - Reverse direction immediately after a losing trade - true
Disclaimer
This strategy description and any accompanying code are provided for educational purposes only and do not constitute financial advice or a solicitation to trade. Futures trading involves substantial risk, including possible loss of capital. Past performance is not indicative of future results. Traders should assess their own risk tolerance and conduct thorough backtesting and forward-testing before committing real capital.

Pivot and Wick Boxes with Break Signals█ OVERVIEW
This Pine Script® indicator draws support and resistance levels based on high and low pivot points and the wicks of pivot candles. When the price breaks these levels, breakout signals are generated, with an optional volume filter for greater precision. The indicator is fully customizable, allowing users to adjust box styles, pivot length, and signal settings.
█ CONCEPTS
The indicator relies on several key elements to identify and visualize important price levels and trading signals:
Pivot Identification
High and low pivots are detected using the ta.pivothigh and ta.pivotlow functions with a configurable pivot length. Boxes are drawn based on the pivot level and the wick of the pivot candle (top for high pivots, bottom for low pivots).
List of Features
1 — High and Low Pivot Boxes: The indicator draws boxes based on high pivot candles (red) and low pivot candles (green) and their wicks, with options to customize colors, border styles, and background gradient. Boxes are limited to 500 bars back, meaning support and resistance levels older than 500 candles are not displayed to maintain chart clarity.
2 — Breakout Signals: When the price closes above the upper edge of a high pivot box, a breakout signal is generated (green triangle below the bar). When the price closes below the lower edge of a low pivot box, a breakout signal is generated (red triangle above the bar).
Signals can be filtered using volume, requiring the volume at the breakout to exceed the average volume multiplied by a configurable multiplier.
3 — Box Management: The indicator limits the number of displayed boxes (default is 15 for high pivots and 15 for low pivots), removing the oldest boxes when the limit is reached. Boxes older than 500 bars are automatically removed.
Volume Filtering
An optional volume filter allows users to require breakout signals to be confirmed by volume exceeding the moving average of volume (calculated over a selected period, default is 20 days).
█ OTHER SECTIONS
FEATURES
• Show High/Low Pivot Boxes: Enables or disables the display of boxes for high and low pivots.
• Pivot Length: Specifies the number of bars back and forward for detecting pivots (default is 5).
• Max Boxes: Sets the maximum number of boxes for high and low pivots (default is 15).
• Volume Filter: Enables a volume filter for breakout signals, with a configurable multiplier and average period.
• Box Style: Allows customization of border color, background gradient, border width, and border style (solid, dashed, dotted).
HOW TO USE
1 — Add the indicator to your TradingView chart by selecting “Pivot and Wick Boxes with Break Signals” from the indicators list.
2 — Configure the settings in the indicator’s dialog window, adjusting pivot length, maximum number of boxes, colors, and style.
3 — Enable the volume filter if you want signals to be confirmed by high volume.
4 — Monitor breakout signals (green triangles below bars for upward breakouts, red triangles above bars for downward breakouts) on the chart.
LIMITATIONS
• New pivots are detected with a delay equal to the set pivot length. A lower pivot length value results in faster pivot detection but produces pivots with less significance as support or resistance levels compared to those generated with a longer value.
• Breakout signals may produce false signals in volatile market conditions, especially without the volume filter.
• Boxes are limited to 500 bars back, which may exclude older pivots on long-term charts.

Contrarian Market Structure BreakMarket Structure Break application was inspired and adapted from Market Structure Oscillator indicator developed by Lux Algo. So much credit to their work.
This indicator pairs nicely with the Contrarian 100 MA and can be located here:
Indicator Description: Contrarian Market Structure BreakOverview
The "Contrarian Market Structure Break" indicator is a versatile tool tailored for traders seeking to identify potential reversal opportunities by analyzing market structure across multiple timeframes. Built on Institutional Concepts of Structure (ICT), this indicator detects Break of Structure (BOS) and Change of Character (CHoCH) patterns across short-term, intermediate-term, and long-term swings, plotting them with customizable lines and labels. It generates contrarian buy and sell signals when price breaks key swing levels, with a unique "Blue Dot Tracker" to monitor consecutive buy signals for trend confirmation. Optimized for the daily timeframe, this indicator is adaptable to other timeframes with proper testing, making it ideal for traders of forex, stocks, or cryptocurrencies.
How It Works
The indicator combines three key components to provide a comprehensive view of market dynamics: Multi-Timeframe Market Structure Analysis: It identifies swing highs and lows across short-term, intermediate-term, and long-term periods, plotting BOS (continuation) and CHoCH (reversal) events with customizable line styles and labels.
Contrarian Signal Generation: Buy and sell signals are triggered when the price crosses below swing lows (buy) or above swing highs (sell), indicating potential reversals in overextended markets.
Blue Dot Tracker: A unique feature that counts consecutive buy signals ("blue dots") and highlights a "Hold Investment" state with a yellow background when three or more buy signals occur, suggesting a potential trend continuation.
Signals are visualized as small circles below (buy) or above (sell) price bars, and a table in the bottom-right corner displays the blue dot count and recommended action (Hold or Flip Investment), enhancing decision-making clarity.
Mathematical Concepts Swing Detection: The indicator identifies swing highs and lows by comparing price patterns over three bars, ensuring robust detection of pivot points. A swing high occurs when the middle bar’s high is higher than the surrounding bars, and a swing low occurs when the middle bar’s low is lower.
Market Structure Logic: BOS is detected when the price breaks a prior swing high (bullish) or low (bearish) in the direction of the current trend, while CHoCH signals a potential reversal when the price breaks a swing level against the trend. These are calculated across three timeframes for a multi-dimensional perspective.
Blue Dot Tracker: This feature counts consecutive buy signals and tracks the entry price. If three or more buy signals occur without a sell signal, the indicator enters a "Hold Investment" state, marked by a yellow background, until the price exceeds the entry price or a sell signal occurs.
Entry and Exit Rules Buy Signal (Blue Dot Below Bar): Triggered when the closing price crosses below a swing low on either the intermediate-term or long-term timeframe, suggesting an oversold condition and potential reversal upward. Short-term signals can be enabled but are disabled by default to reduce noise.
Sell Signal (White Dot Above Bar): Triggered when the closing price crosses above a swing high on either the intermediate-term or long-term timeframe, indicating an overbought condition and potential reversal downward.
Blue Dot Tracker Logic: After a buy signal, the indicator increments a blue dot counter and records the entry price. If three or more consecutive buy signals occur (blueDotCount ≥ 3), the indicator enters a "Hold Investment" state, highlighted with a yellow background, suggesting a potential trend continuation. The "Hold Investment" state ends when the price exceeds the entry price or a sell signal occurs, resetting the counter.
Exit Rules: Traders can exit buy positions when a sell signal appears, the price exceeds the entry price during a "Hold Investment" state, or based on additional confirmation from BOS/CHoCH patterns or other technical analysis tools. Always use proper risk management.
Recommended Usage
The indicator is optimized for the daily timeframe, where it effectively captures significant reversal and continuation patterns in trending or ranging markets. It can be adapted to other timeframes (e.g., 1H, 4H, 15M) with careful testing of settings, particularly enabling/disabling short-term structure analysis to suit market conditions. Backtesting is recommended to optimize performance for your chosen asset and timeframe.
Customization Options Market Structure Display: Toggle short-term, intermediate-term, and long-term structures on or off, with customizable line styles (solid, dashed, dotted) and colors for bullish and bearish breaks.
Labels: Enable or disable BOS/CHoCH labels for each timeframe to reduce chart clutter.
Signal Visibility: Hide buy/sell signals if desired for a cleaner chart.
Blue Dot Tracker: Monitor the blue dot count and action (Hold or Flip Investment) via the table display, which is fully customizable in terms of position and appearance.
Why Use This Indicator?
The "Contrarian Market Structure Break" indicator offers a robust framework for identifying high-probability reversal and continuation setups using ICT principles. Its multi-timeframe analysis, clear signal visualization, and innovative Blue Dot Tracker provide traders with actionable insights into market dynamics. Whether you're a swing trader or a day trader, this indicator’s flexibility and intuitive design make it a valuable addition to your trading arsenal.
Note for TradingView Moderators
This script complies with TradingView's House Rules by providing an educational and transparent description without performance claims or guarantees. It is designed to assist traders in technical analysis and should be used alongside proper risk management and personal research. The code is original, well-documented, and includes customizable inputs and clear visual outputs to enhance the user experience.
Tips for Users:
Backtest thoroughly on your chosen asset and timeframe to validate signal reliability. Combine with other indicators or price action analysis for confirmation of entries and exits. Adjust timeframe settings and enable/disable short-term structures to match market volatility and your trading style.
Hope the "Contrarian Market Structure Break" indicator enhances your trading strategy and helps you navigate the markets with confidence! Happy trading!

Liquidity Break Probability [PhenLabs]📊 Liquidity Break Probability
Version: PineScript™ v6
The Liquidity Break Probability indicator revolutionizes how traders approach liquidity levels by providing real-time probability calculations for level breaks. This advanced indicator combines sophisticated market analysis with machine learning inspired probability models to predict the likelihood of high/low breaks before they happen.
Unlike traditional liquidity indicators that simply draw lines, LBP analyzes market structure, volume profiles, momentum, volatility, and sentiment to generate dynamic break probabilities ranging from 5% to 95%. This gives traders unprecedented insight into which levels are most likely to hold or break, enabling more confident trading decisions.
🚀 Points of Innovation
Advanced 6-factor probability model weighing market structure, volatility, volume, momentum, patterns, and sentiment
Real-time probability updates that adjust as market conditions change
Intelligent trading style presets (Scalping, Day Trading, Swing Trading) with optimized parameters
Dynamic color-coded probability labels showing break likelihood percentages
Professional tiered input system - from quick setup to expert-level customization
Smart volume filtering that only highlights levels with significant institutional interest
🔧 Core Components
Market Structure Analysis: Evaluates trend alignment, level strength, and momentum buildup using EMA crossovers and price action
Volatility Engine: Incorporates ATR expansion, Bollinger Band positioning, and price distance calculations
Volume Profile System: Analyzes current volume strength, smart money proxies, and level creation volume ratios
Momentum Calculator: Combines RSI positioning, MACD strength, and momentum divergence detection
Pattern Recognition: Identifies reversal patterns (doji, hammer, engulfing) near key levels
Sentiment Analysis: Processes fear/greed indicators and market breadth measurements
🔥 Key Features
Dynamic Probability Labels: Real-time percentage displays showing break probability with color coding (red >70%, orange >50%, white <50%)
Trading Style Optimization: One-click presets automatically configure sensitivity and parameters for your trading timeframe
Professional Dashboard: Live market state monitoring with nearest level tracking and active level counts
Smart Alert System: Customizable proximity alerts and high-probability break notifications
Advanced Level Management: Intelligent line cleanup and historical analysis options
Volume-Validated Levels: Only displays levels backed by significant volume for institutional-grade analysis
🎨 Visualization
Recent Low Lines: Red lines marking validated support levels with probability percentages
Recent High Lines: Blue lines showing resistance zones with break likelihood indicators
Probability Labels: Color-coded percentage labels that update in real-time
Professional Dashboard: Customizable panel showing market state, active levels, and current price
Clean Display Modes: Toggle between active-only view for clean charts or historical view for analysis
📖 Usage Guidelines
Quick Setup
Trading Style Preset
Default: Day Trading
Options: Scalping, Day Trading, Swing Trading, Custom
Description: Automatically optimizes all parameters for your preferred trading timeframe and style
Show Break Probability %
Default: True
Description: Displays percentage labels next to each level showing break probability
Line Display
Default: Active Only
Options: Active Only, All Levels
Description: Choose between clean active-only view or comprehensive historical analysis
Level Detection Settings
Level Sensitivity
Default: 5
Range: 1-20
Description: Lower values show more levels (sensitive), higher values show fewer levels (selective)
Volume Filter Strength
Default: 2.0
Range: 0.5-5.0
Description: Controls minimum volume threshold for level validation
Advanced Probability Model
Market Trend Influence
Default: 25%
Range: 0-50%
Description: Weight given to overall market trend in probability calculations
Volume Influence
Default: 20%
Range: 0-50%
Description: Impact of volume analysis on break probability
✅ Best Use Cases
Identifying high-probability breakout setups before they occur
Determining optimal entry and exit points near key levels
Risk management through probability-based position sizing
Confluence trading when multiple high-probability levels align
Scalping opportunities at levels with low break probability
Swing trading setups using high-probability level breaks
⚠️ Limitations
Probability calculations are estimations based on historical patterns and current market conditions
High-probability setups do not guarantee successful trades - risk management is essential
Performance may vary significantly across different market conditions and asset classes
Requires understanding of support/resistance concepts and probability-based trading
Best used in conjunction with other analysis methods and proper risk management
💡 What Makes This Unique
Probability-Based Approach: First indicator to provide quantitative break probabilities rather than simple S/R lines
Multi-Factor Analysis: Combines 6 different market factors into a comprehensive probability model
Adaptive Intelligence: Probabilities update in real-time as market conditions change
Professional Interface: Tiered input system from beginner-friendly to expert-level customization
Institutional-Grade Filtering: Volume validation ensures only significant levels are displayed
🔬 How It Works
1. Level Detection:
Identifies pivot highs and lows using configurable sensitivity settings
Validates levels with volume analysis to ensure institutional significance
2. Probability Calculation:
Analyzes 6 key market factors: structure, volatility, volume, momentum, patterns, sentiment
Applies weighted scoring system based on user-defined factor importance
Generates probability score from 5% to 95% for each level
3. Real-Time Updates:
Continuously monitors price action and market conditions
Updates probability calculations as new data becomes available
Adjusts for level touches and changing market dynamics
💡 Note: This indicator works best on timeframes from 1-minute to 4-hour charts. For optimal results, combine with proper risk management and consider multiple timeframe analysis. The probability calculations are most accurate in trending markets with normal to high volatility conditions.
