Breakout Strategy with Dynamic SL LabelDescription:
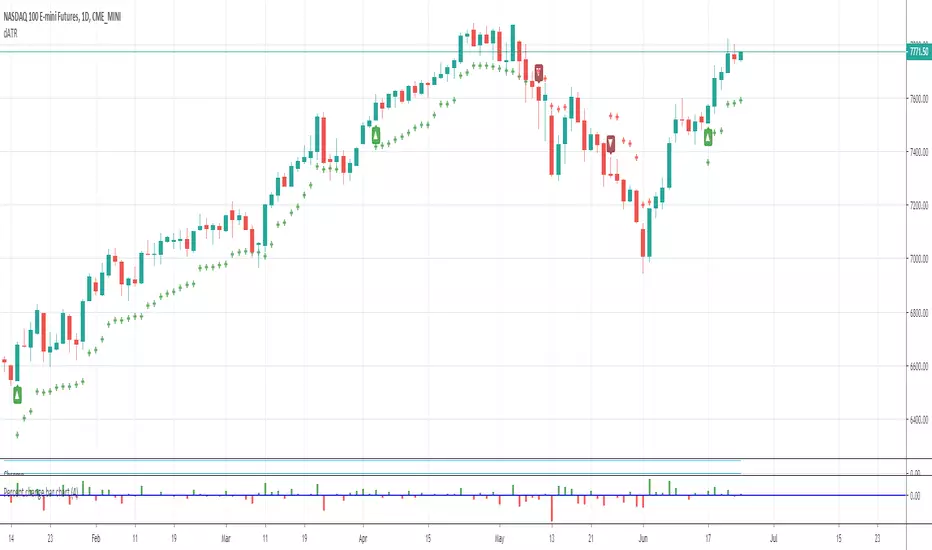
This script identifies breakout trading opportunities using adaptive support and resistance levels, adjusted dynamically based on market volatility. A trade signal is generated only when a breakout candle is followed by a confirming close in the same direction. The signal is displayed on the chart as a labeled marker that includes a suggested stop-loss level based on the highest high or lowest low of the past 10 bars, ensuring structure-aware risk management.
🧩 How it Works:
Adaptive S/R Zones: Based on volatility-normalized swing highs/lows using ATR. These zones automatically adjust to changing market conditions.
Confirmation Logic: Trade signals only appear after the second candle confirms the breakout, helping reduce false signals.
Single Signal Rule: Only one buy or sell label is printed per breakout level, avoiding repeated triggers.
Embedded Stop Loss in Label: SL value is calculated from the 10-bar high (for shorts) or low (for longs) and included in the signal label.
⚙️ User Inputs Explained:
Base Swing Strength: Controls the pivot sensitivity; higher values detect stronger reversal points.
Line Duration: Number of bars that horizontal S/R levels remain visible.
ATR Period: Length used to calculate volatility for adaptive S/R logic.
Volatility Sensitivity: Adjusts how responsive the S/R zone strength is to volatility. Higher = more responsive.
Stop-Loss Lookback (Bars): Defines the number of candles to reference when calculating SL from high/low structure.
Max Lines Stored: Controls chart clutter by limiting how many S/R zones are kept active.
🟩 Ideal for:
Breakout traders who value clean structure, confirmation, and built-in risk logic.
Scalpers and swing traders looking for adaptive, low-latency signals without repainting.
Chartists who want minimal indicators but maximum signal clarity.
在腳本中搜尋"breakout"

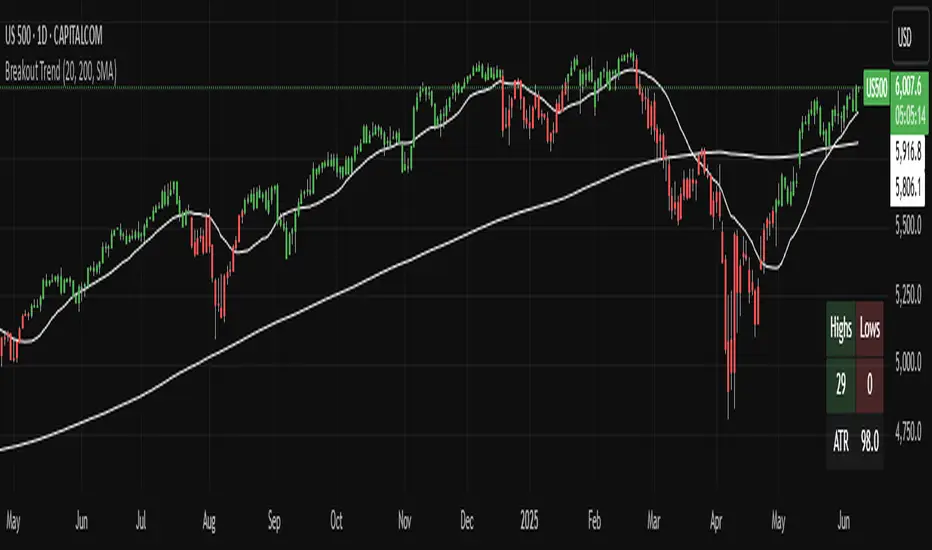
Breakout TrendTiltFolio Breakout Trend indicator
The Breakout Trend indicator is designed to help traders clearly visualize trend direction by combining two complementary techniques: moving averages and Donchian-style breakout logic.
Rather than relying on just one type of signal, this indicator merges short-term and long-term moving averages with breakout levels based on recent highs and lows. The moving averages define the broader trend regime, while the breakout logic pinpoints moments when price confirms directional momentum. This layered approach filters out many false signals while still capturing high-conviction moves.
Yes, these are lagging indicators by design — and that’s the point. Instead of predicting every wiggle, the Breakout Trend waits for confirmation, offering higher signal quality and fewer whipsaws. When the price breaks above a recent high and sits above the long-term moving average, the trend is more likely to persist. That’s when this indicator shines.
While it performs best on higher timeframes (daily/weekly), it's also adaptable to shorter timeframes for intraday traders who value clean, systematic trend signals.
For early signal detection, we recommend pairing this with TiltFolio’s Buying/Selling Proxy, which anticipates pressure buildups—albeit with more noise.
It's easy to read and built for real-world trading discipline.
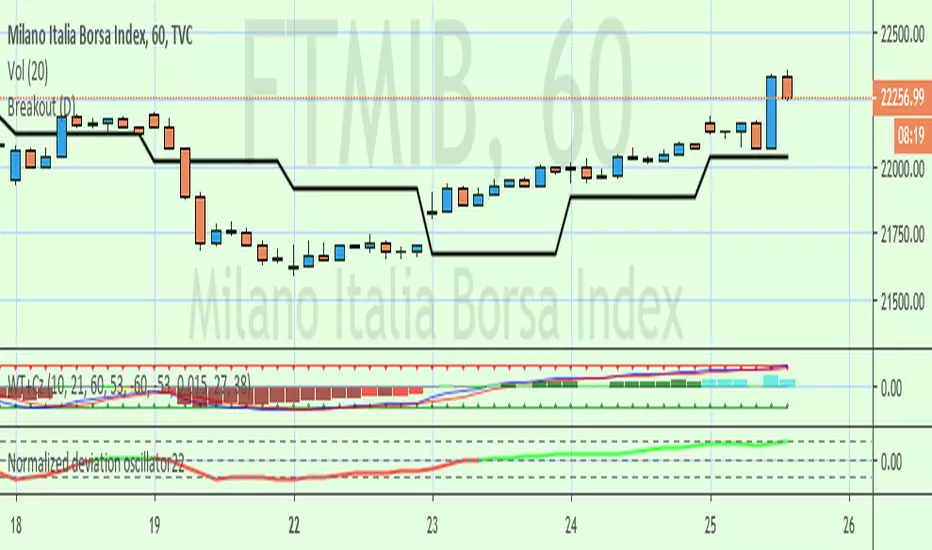
Breakout indicatorThis indicator helps traders identify potential breakout levels based on the highest high and lowest low of the last N candles, inspired by the classic Turtle Trading strategy. The period (N) is fully customizable, allowing you to adapt it to your trading style. For daily charts, a period between 50 and 100 is recommended.
The indicator dynamically plots horizontal lines representing the highest high and lowest low over the selected period. These lines are updated in real-time as price action evolves. A breakout is confirmed when the price closes above the high line (for a bullish breakout) or below the low line (for a bearish breakout).
Customize the appearance of the lines with options for thickness, color, and style (solid, dotted, or dashed) to suit your chart preferences. Perfect for traders looking to implement a simple yet effective breakout strategy!
Key Features:
Editable period (N) for high/low calculation.
Real-time updates of high/low levels.
Customizable line thickness, color, and style.
Usage:
Use on daily charts for swing trading or position trading.
Combine with other indicators or price action analysis for better confirmation.

Breakout Band v1.0This indicator uses a custom source to define a point of relativity to which regions are based off to aid in technical analysis.
Breakout Band's use is:
- Monitoring trends
- Defining trends
- Defining areas of consolidation
- Trend support / resistance levels
- Aid in technical analysis
However, the band provides information different to that of an EMA, as they are not created from the same source, ref Fig 1.
---
Fig 1
Breakout Band compared to an EMA, both with a length setting of 20.
---
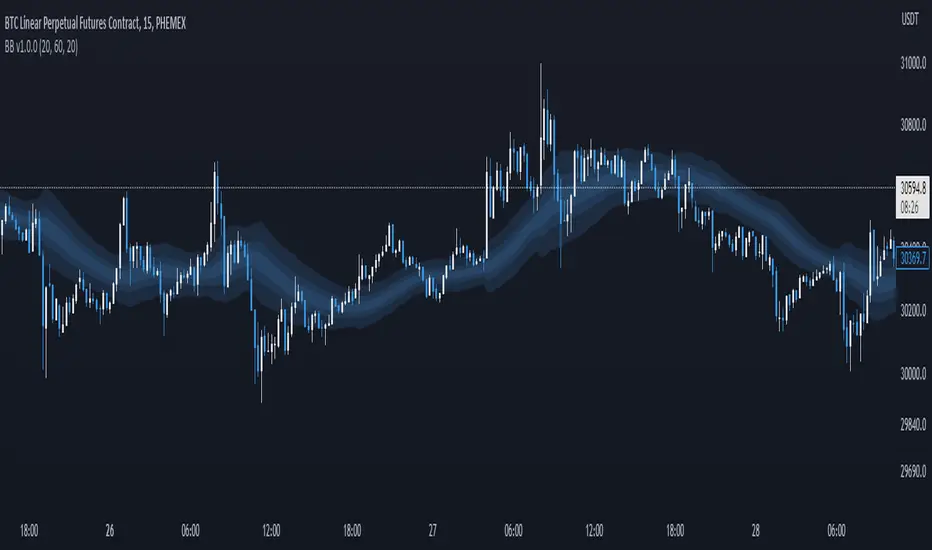
The primary band uses your charts timeframe to plot the band. This can be useful for more immediate information, ref Fig 2.
Fig 2
BTC on a 15m chart with Breakout Band's Chart Timeframe option.
---
There is also a functionality for a higher timeframe band to be plotted ( currently limited to 4 higher timeframes ) which can help to view higher timeframe moves with lower timeframe information, ref Fig 3. The higher timeframe band has an added smoothing effect.
Fig 3.
The same chart as referenced in Fig 2., while using Breakout Bands HTF option ( 60m band ).
---
USING BREAKOUT BAND
The band provides potential areas of consolidation, as seen in Fig 4., and when price action falls outside of the band, it can be considered trending.
Fig 4.
Defining areas of consolidation, trends, and monitor trends with Breakout Band.
---
Different zones are given different colors. The closer to the middle of the band, the higher chance of reactivity. Meaning, there is a greater chance that price will have a reaction within this zone. Whether that be trend continuation or a break of structure, showing signs of weakness of a trend, ref Fig 5.
Fig 5.
Breakout Bands reactivity region showing an area of potential resistance, which price action enters, then the trend continues.
---
NOTE : The same principles apply if you're using the HTF band for monitoring HTF trends.
I hope you enjoy the Breakout Band. Should you encounter any issues or have any suggestions for improving this indicator, let me know.
Any and all feedback is appreciated.
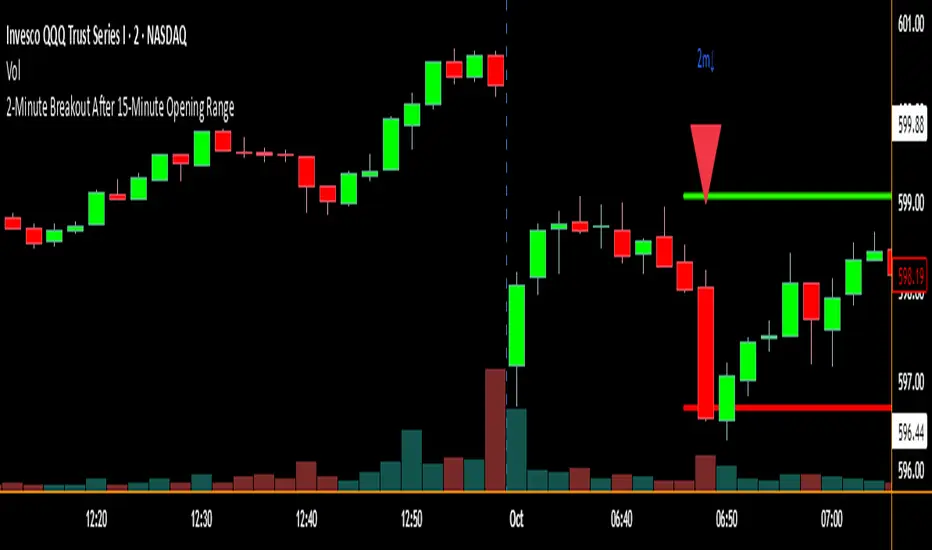
2-Minute Breakout After 15-Minute Opening RangeBreakout must happen before 8 am PST. I used Chat GPT to create this for me so I could do some backtesting on 15 min ORBs.
Breakout Levels Checklist# Description (EN)
## Breakout Levels Checklist — ATR (Classic shown, Active = 5-Day Median or Manual), D1-Fixed, Risk Position Sizing
This script is an on-chart checklist for breakout trades with a daily-fixed ATR core and a simple risk calculator. ATR values are latched on **D1**, so SL/TP remain stable when you switch timeframes. The UI (inputs and panel) is in Russian.
### What it does
- **Checklist**: three groups (Prerequisites, Negatives, Waiting). You tick items; the panel shows a clean list with counters.
- **Breakout calculations**: Entry, Stop-Loss, Take-Profit from your level price, **k × ATR** stop, and an RR preset. A built-in entry offset ≈ **12.5%** of the stop distance is applied.
- **ATR engine (D1)**:
- **Classic ATR** (period selectable; HL or True Range) — **always computed and displayed** for reference and daily progress.
- **Active ATR** = either **5-day median ATR** with optional *paranormal bar* filter (filters both too-big and too-small D1 ranges by percentage thresholds vs a blended reference), **or Manual ATR** if enabled.
- **Risk calculator**: given **Deposit** and **Risk %**, the script outputs the **entry notional (USD)** so an SL hit is approximately equal to your dollar risk; the panel also shows potential PnL to take-profit.
- **Stable visuals**: level / entry / SL / TP lines with automatic cleanup on a new day; panel can be placed in any corner (RU labels).
### How to use
1. Set **Direction** (Long/Short) and the **Level Price**.
2. Tick checklist items as the setup forms.
3. In **ATR**, leave Classic as reference (period + HL/TR), and choose the **Active ATR mode**: *5-day median* (with optional paranormal filter) **or** *Manual* (manual value overrides).
4. Pick **k** for **Stop = k × ATR**; TP is placed by the **RR** preset relative to stop size.
5. In **Calculator**, set **Deposit** and **Risk %** — the panel returns the **entry notional** aligned with your risk.
6. Show/hide panel sections (calculations / ATR / calculator) as needed.
### Quick notes
- Classic ATR is not selectable; it is always calculated and shown for context and D1 progress.
- Active ATR drives stop sizing: *5-day median (with filter)* or *Manual*.
- All ATR computations use **closed D1 bars**; values are cached per day.
---
# Описание (RU)
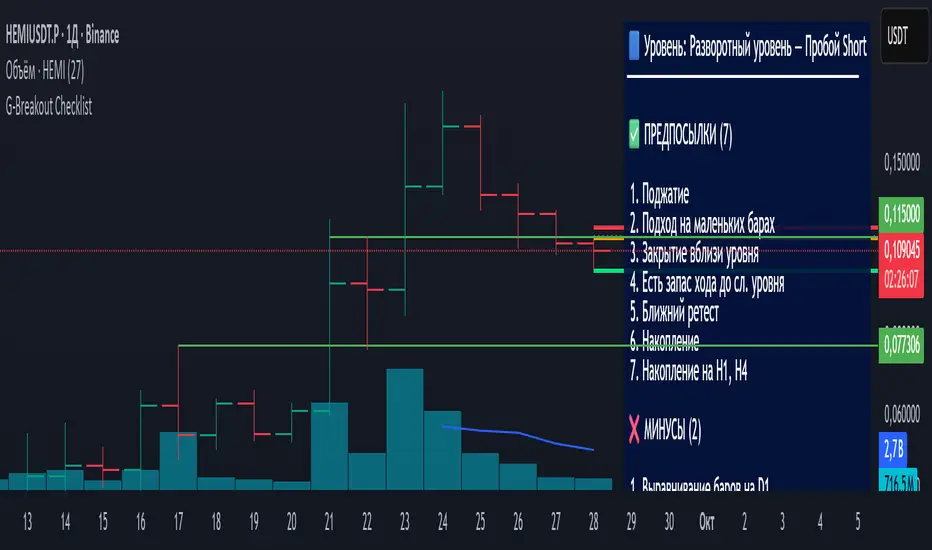
## Чек-лист уровней (Пробой) — ATR (классический показывается, Активный = медианный 5-дневный или Ручной), фиксация D1, расчёт позиции от риска
Скрипт для работы с пробойными сетапами: чек-лист на графике, фиксированный дневной ATR, расчёт ТВХ/SL/TP и простой калькулятор позиции от риска. Значения ATR фиксируются на **D1**, поэтому SL/TP не «плавают» при смене таймфреймов. Интерфейс (входы и панель) — на русском.
### Что делает
- **Чек-лист**: три группы (Предпосылки, Минусы, Ожидаю). Отмечаете галочки — панель выводит список и счётчики.
- **Расчёты пробоя**: ТВХ, Стоп-лосс, Тейк-профит от цены уровня; стоп как **k × ATR**; тейк задаётся пресетом **RR**; встроен люфт входа ≈ **12.5%** от дистанции стопа.
- **ATR (D1)**:
- **Классический ATR** (период, HL или True Range) — **всегда считается и показывается** как справочное значение и для прогресса дня.
- **Активный ATR** = **медианный за 5 дней** с опциональным фильтром *паранормальных* баров (одной галочкой отсекаются одновременно слишком большие и слишком маленькие дневные диапазоны по процентным порогам к смешанному референсу) **или** **Ручной ATR** (ручное значение имеет приоритет).
- **Калькулятор риска**: по **Депозиту** и **Риску %** отдаёт **сумму входа (USD)** так, чтобы убыток по стопу был близок к заданному риску; дополнительно показывает потенциальный PnL по тейку.
- **Стабильная отрисовка**: линии Уровень / ТВХ / SL / TP, авто-очистка на новый день; позиция панели выбирается (русские подписи углов).
### Как работать
1. Задайте **Направление** (Long/Short) и **Цену уровня**.
2. Отметьте пункты чек-листа под текущий контекст.
3. В **ATR** используйте **Классический** как справочный (период + HL/TR), а **Активный ATR** выберите как *медианный 5-дневный* (с фильтром при необходимости) **или** *Ручной* (ручное значение замещает активный).
4. Укажите **k** для **Стоп = k × ATR**; тейк выставляется пресетом **RR** относительно размера стопа.
5. В **Калькуляторе** задайте **Депозит** и **Риск %** — получите **сумму входа**, согласованную с риском.
6. В панели можно скрывать/показывать секции (расчёты / ATR / калькулятор).
### Важные примечания
- Классический ATR не выбирается пользователем — он всегда считается и отображается для контекста и прогресса по дню.
- Активный ATR используется для расчёта стопа: медианный 5D (с фильтром) или ручной.
- Все расчёты ATR делаются по **закрытым барам D1**; значения кэшируются на день.
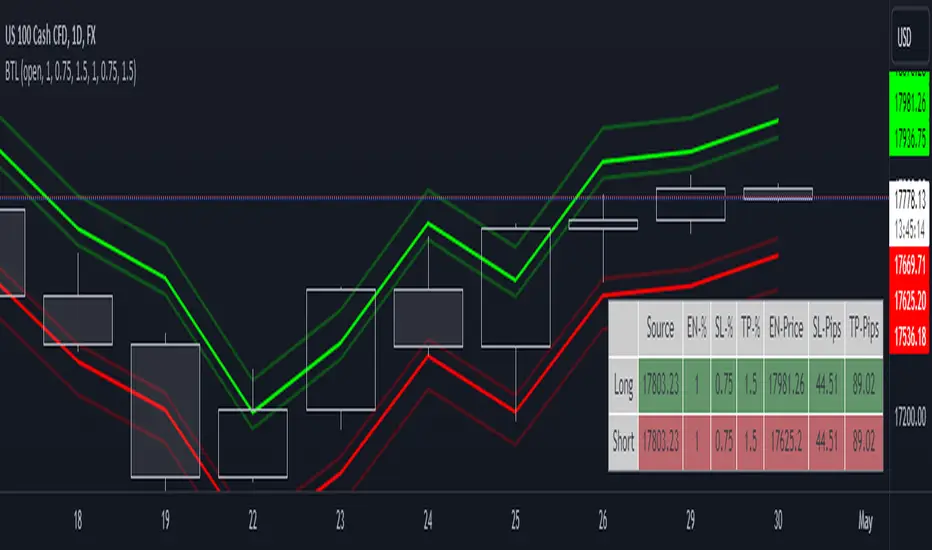
Breakout Trade LevelsThis indicator is designed for trading CFD indices, focusing specifically on breakout strategies.
For instance, utilize this indicator to set up a bracket order at the beginning of the trading day, anticipating a breakout in NAS100 with a movement of 1% in either direction. Utilizing the Open Price, it calculates the Entry Price, Stop Loss (SL), and Take Profit (TP) based on percentage movements.
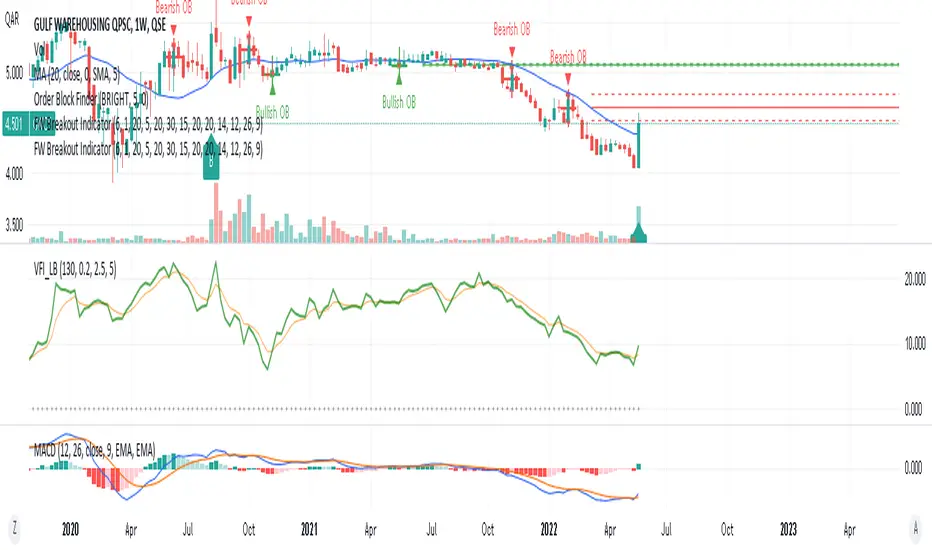
FinancialWisdom Breakout IndicatorBreakout is detected when:
1- Price is higher than previous 6 bars
2- price is above 1% of previous high and below 20%
3- price is above 20 week moving average
4- Volume is higher by 30% of 1 candle before.
5-MACD is positive
Remember indicators/strategies are there to help you in your trading and not to trade based on them solely.
Not a financial advise.
Breakout Machine V2 - Alerts - Bitcoin BeatsHello, Hello, Hello and welcome back to Bitcoin Beats.
As the title suggests, this is Version 2 of The Breakout Machine Alerts version.
Unlike the previous version, this one has been fine-tuned to work best on Binance Futures ( BTCUSDT ).
PLEASE BE CAREFUL WITH YOUR LEVERAGE AND DON'T GET REKT.
Trade at your own risk! Good luck!
This strategy takes MACD and Volume spikes to calculate pumps and dumps in the bitcoin market.
I've also added custom backtesting inputs and leverage for you all to experiment with and see the profitability of the Strategy.
Alerts version coming soon...
Thank you, And goodbye, from Bitcoin Beats.

BreakOut Candle with Alerts [MV]hello everyone this indicator using for automation trading with alerts
here previous Day high low
first candle high low and time frame
Green background it's mean 200 SMA above open candle
red background it's mean 200 SMA below open candle
!!! you can also change any period SMA. buy default add 200 SMA

Breakout lineSimple script to find breakout levels. Set your choise of timeframe. (must to be higher then chart)

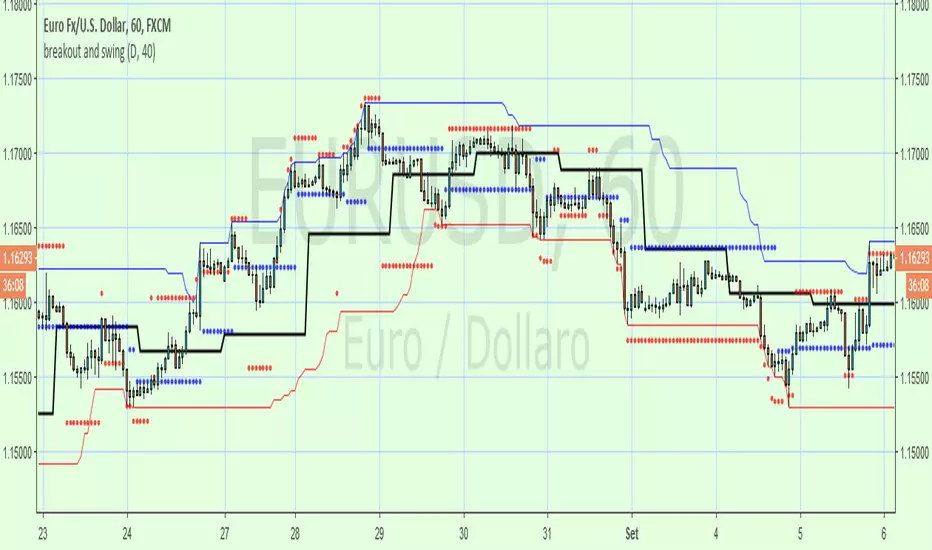
breakout and swingA Price Action system that use swing point and breakout
above the black line (breakout) is long, below short
swing/support/resistance points (blue circles) are displayed after a top or botton, breaking it means an inversion
red circles try to guest a target after a top/bottom or after a swing break.
the main trend is made by the black line that is set on Day period suitable for 1h to 15m time frame , for small TF you can set a smaller period from setting command
By default a set a 40 period channel high/low (the highest and lowest 40 bar back) that is ok for 1 h or smaller tf , but look to long for daily tf, adjust it yourself
Breakout Range LS alert 893 popup trigger ver For Japanese major donchain breakout bot's logic.
it's trigger are price range and highest/lowest price.
this script put on symbol/text in chart when price reach on trigger:)
recommend to use on 1h chart.
include alertcondition for TV alert.

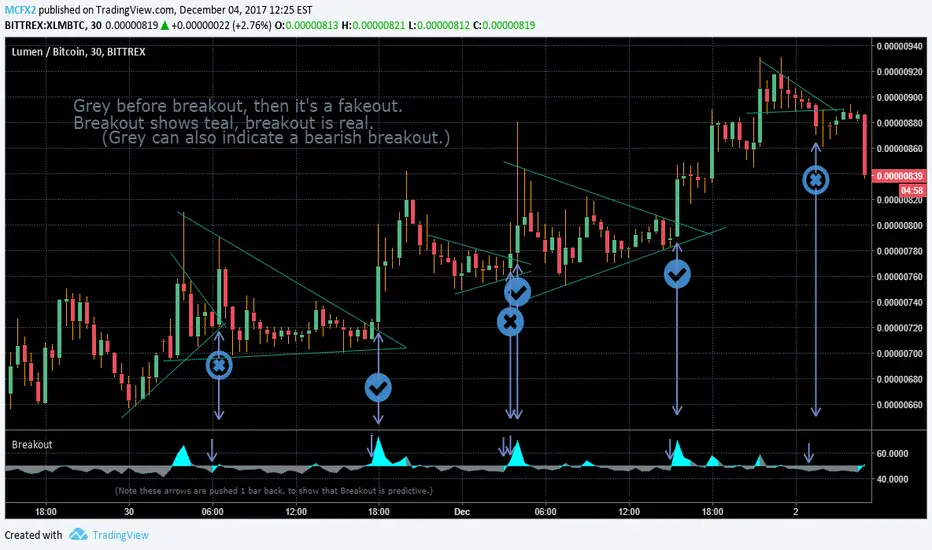
Breakout IndicatorThis indicator aims to predict the direction of a breakout, should one occur. It is specifically designed with pennants and wedges in mind.
You also may use progressively shorter timeframes as a breakout approaches, to get more up-to-the-minute sort of data, please note that breakout is not accurate until after the candle is complete. For this reason, shorter timeframes are necessary to get an accurate read on the market. This is also not intended for candles larger than 1D, but may work with longer candles anyway.
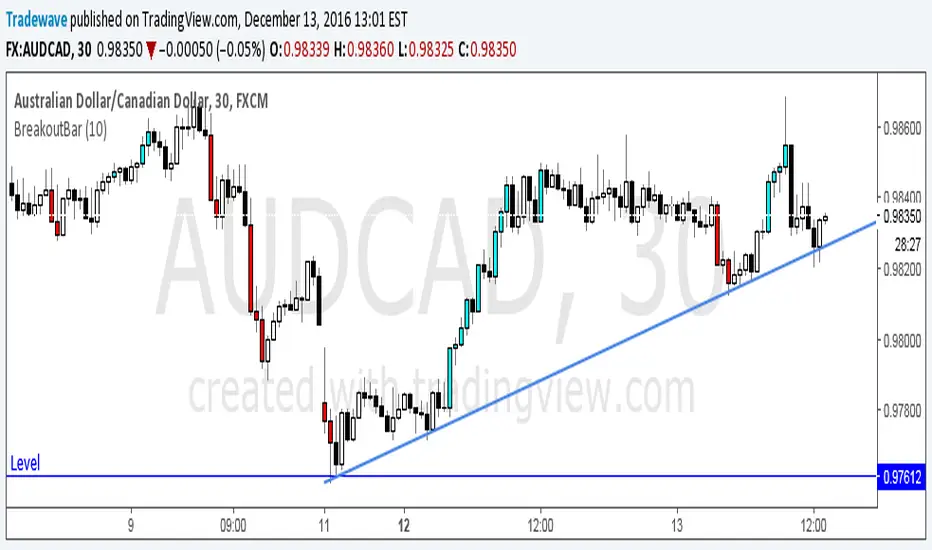
Breakout BarThe following script colors breakout bars.
The user can specify the look back period.
If current close is highest of the past n bars it will color the bar light blue.
If current close is lowest of the past n bars it will color the bar red.
All other bars are black for down bars and white for up bars.
Consecutive Higher/Lower Closes with Breakout LineIndicator Description:
"Four Consecutive Higher/Lower Closes with Auto Breakout Line Timeframe" is a custom TradingView indicator designed to help traders identify key breakout points based on consecutive price action. It combines two main features:
Four Consecutive Higher/Lower Closes – Detects bullish or bearish momentum through consecutive higher or lower closing prices.
Auto Breakout Line – Plots a breakout line that adapts to the timeframe of the chart, helping to visualize potential breakout levels and trends.
Features:
Higher/Lower Close Detection: The indicator tracks and plots lines when there are four consecutive higher closes (bullish) or four consecutive lower closes (bearish). This can signal a trend or momentum in the market.
Breakout Line: It draws an adaptive breakout line that adjusts based on the selected timeframe (i.e., the chart interval), helping traders visually identify breakout levels across different timeframes.
Timeframe Adaptability: The indicator automatically adjusts the breakout line timeframe based on the chart interval (e.g., 15 minutes for lower timeframes and 1 day for higher timeframes).
Customizable Timeframe and Color: The default color for breakout lines is purple, but it is customizable. You can also enable/disable the breakout line through the settings.
How to Use This Indicator for Trading:
1. Trading with Consecutive Higher/Lower Closes:
Bullish Signal: When the indicator detects four consecutive higher closes, it signifies increasing buying momentum. Traders might consider taking long positions when this occurs, especially if the price continues to close higher.
Bearish Signal: When the indicator detects four consecutive lower closes, it signals increasing selling pressure. Traders might consider taking short positions if the price continues to close lower.
Confirmation: The fourth consecutive higher or lower close should be confirmed with additional analysis, such as candlestick patterns, support/resistance levels, or volume.
2. Using the Breakout Line:
The breakout line is designed to help traders identify potential breakout levels. When the price approaches or crosses this line, it could indicate that the market is either breaking out in the direction of the trend or failing to continue the trend.
Bullish Breakout: If the price crosses the breakout line upwards (after four consecutive higher closes), it may confirm that a bullish breakout is in progress. This can be a good opportunity to take a long position.
Bearish Breakout: If the price crosses the breakout line downwards (after four consecutive lower closes), it may confirm that a bearish breakout is occurring. This can be an opportunity to take a short position.
Avoid False Breakouts: It is important not to react to every price move crossing the breakout line. Wait for additional confirmation signals like higher volume, candlestick patterns (e.g., bullish or bearish engulfing), or other technical indicators (e.g., RSI, MACD) to confirm the breakout's validity.
How to Avoid Fake Breakouts:
A fake breakout occurs when the price moves beyond a breakout level but then quickly reverses back inside the range, trapping traders who took positions in the breakout direction.
Here are strategies to avoid fake breakouts:
1. Volume Confirmation:
A valid breakout is often supported by higher volume. If the price crosses the breakout line but the volume is low, it's more likely to be a fake breakout. Always check the volume when a breakout occurs.
Look for volume spikes that accompany the breakout. A surge in volume confirms the market's conviction in the new trend.
2. Candlestick Patterns:
Bullish/bearish engulfing patterns or Doji candles can provide important insights into potential reversals. If a breakout occurs but is immediately followed by a bearish engulfing candle, it's a sign that the breakout may be false.
Also, check for candlestick formations at key support or resistance levels for confirmation.
3. Time Confirmation:
Wait for the close of the current bar to confirm the breakout. A breakout within a single bar without closing above or below a significant level could be a false move.
Sometimes the market will test the breakout level before committing to the direction. This is common in volatile or choppy market conditions.
4. Use of Other Indicators:
RSI (Relative Strength Index): An overbought or oversold condition can indicate a potential reversal after a breakout.
MACD (Moving Average Convergence Divergence): Watch for a MACD crossover that aligns with the breakout direction to confirm the move.
5. Use Stop Losses:
A key rule in avoiding fake breakouts is to always use stop-loss orders. Set your stop-loss just outside the breakout level to avoid excessive losses if the price reverses.
Trailing stops can also help lock in profits if the price moves in your favor but may reverse at a later point.
Summary:
The Four Consecutive Higher/Lower Closes with Auto Breakout Line Timeframe indicator is a valuable tool for identifying strong trends and potential breakouts in the market. By combining consecutive close patterns with dynamic breakout levels, it can help traders spot bullish or bearish momentum and make more informed trading decisions. However, always confirm breakouts with volume, candlestick patterns, and other technical indicators to avoid fake breakouts and reduce the risk of false signals.
By using this indicator along with prudent risk management strategies, traders can improve their chances of entering and exiting trades at the right time while avoiding unnecessary losses from false breakouts.

Volatility Breaker Blocks [BigBeluga]The Volatility Breaker Blocks indicator identifies key market levels based on significant volatility at pivot highs and lows. It plots blocks that act as potential support and resistance zones, marked in green (support) and blue (resistance). Even after a breakout, these blocks leave behind shadow boxes that continue to impact price action. The sensitivity of block detection can be adjusted in the settings, allowing traders to customize the identification of volatility breakouts. The blocks print triangle labels (up or down) after breakouts, indicating potential areas of interest.
🔵 IDEA
The Volatility Breaker Blocks indicator is designed to highlight key areas in the market where volatility has created significant price action. These blocks, created at pivot highs and lows with increased volatility, act as potential support and resistance levels.
The idea is that even after price breaks through these blocks, the remaining shadow boxes continue to influence price movements. By focusing on volatility-driven pivot points, traders can better anticipate how price may react when it revisits these areas. The indicator also captures the natural tendency for price to retest broken resistance or support levels.
🔵 KEY FEATURES & USAGE
◉ High Volatility Breaker Blocks:
The indicator identifies areas of high volatility at pivot highs and lows, plotting blocks that represent these zones. Green blocks represent support zones (identified at pivot lows), while blue blocks represent resistance zones (identified at pivot highs).
Support:
Resistance:
◉ Shadow Blocks after Breakouts:
When price breaks through a block, the block doesn't disappear. Instead, it leaves behind a shadow box, which can still influence future price action. These shadow blocks act as secondary support or resistance levels.
If the price crosses these shadow blocks, the block stops extending, and the right edge of the box is fixed at the point where the price crosses it. This feature helps traders monitor important price levels even after the initial breakout has occurred.
◉ Triangle Labels for Breakouts:
After the price breaks through a volatility block, the indicator prints triangle labels (up or down) at the breakout points.
◉ Support and Resistance Retests:
One of the key concepts in this indicator is the retesting of broken blocks. After breaking a resistance block, price often returns to the shadow box, which then acts as support. Similarly, after breaking a support block, price tends to return to the shadow box, which becomes a resistance level. This concept of price retesting and bouncing off these levels is essential for understanding how the indicator can be used to identify potential entries and exits.
The natural tendency of price to retest broken resistance or support levels.
Additionaly indicator can display retest signals of broken support or resistance
◉ Customizable Sensitivity:
The sensitivity of volatility detection can be adjusted in the settings. A higher sensitivity captures fewer but more significant breakouts, while a lower sensitivity captures more frequent volatility breakouts. This flexibility allows traders to adapt the indicator to different trading styles and market conditions.
🔵 CUSTOMIZATION
Calculation Window: Defines the window of bars over which the breaker blocks are calculated. A larger window will capture longer-term levels, while a smaller window focuses on more recent volatility areas.
Volatility Sensitivity: Adjusts the threshold for volatility detection. Lower sensitivity captures smaller breakouts, while higher sensitivity focuses on larger, more significant moves.
Retest Signals: Display or hide retest signals of shadow boxes

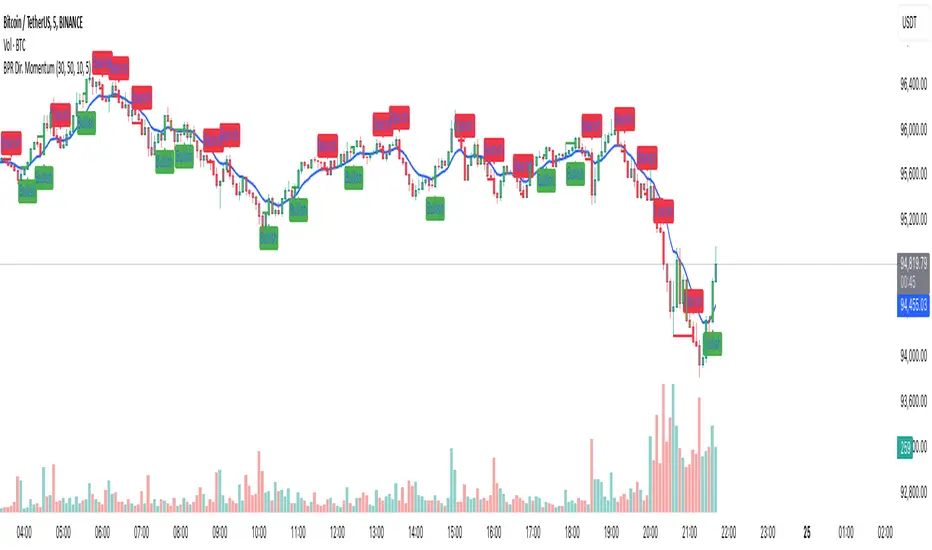
Balance Price Range (BPR) IndicatorOverview
The BPR with Directional Momentum-Filtered Breakouts indicator is designed to identify Balanced Price Ranges (BPR) and d etect high-probability breakouts and breakdowns with directional momentum confirmation . By leveraging historical BPR structures, EMA-based momentum filtering , and a trade cooldown mechanism , this script provides a structured approach to identifying potential trading opportunities while reducing false signals.
This invite-only indicator is ideal for traders who seek precise breakout confirmation, reduced noise, and trend-following logic while maintaining flexibility through adjustable parameters.
How It Works
The script follows a multi-step breakout detection process by integrating multiple key technical components:
1. Balanced Price Range (BPR) Detection:
• A Balanced Candle is identified when the price remains within a specific percentage of its range midpoint.
• These BPR zones represent areas of equilibrium , where a breakout or breakdown is likely to occur.
• The script historically tracks BPR levels across the entire chart to monitor price action around key areas.
2. Momentum-Filtered Breakout & Breakdown Logic:
• Bullish Breakout: Occurs when the price breaks above the historical BPR high with bullish momentum.
• Bearish Breakdown: Occurs when the price breaks below the historical BPR low with bearish momentum.
• Momentum Confirmation: Each breakout requires a strong directional move, measured against the Exponential Moving Average (EMA) .
• Only confirmed breakouts are marked, reducing the likelihood of false signals in choppy markets.
3. Candle-Based Background Visualization:
• Grey Background: Represents a Balanced Price Range (BPR), indicating potential breakout zones.
• Green Background: Indicates a Bullish Breakout when the price successfully breaks and holds above the BPR high.
• Red Background: Indicates a Bearish Breakdown when the price drops below the BPR low.
4. Trade Cooldown Mechanism:
• Prevents consecutive signals from triggering too frequently.
• Default cooldown period: 5 bars (adjustable).
• Ensures that trades are not clustered, improving signal quality.
5. EMA for Trend Direction & Confirmation:
• A 20-period EMA (default, adjustable) is used to confirm trade direction.
• Breakouts above the EMA align with uptrend continuation.
• Breakdowns below the EMA align with downtrend momentum.
Key Features
✔️ Historical BPR Detection – Tracks past BPR levels across the entire chart for structured breakout zones.
✔️ Momentum-Based Breakouts – Ensures breakouts are confirmed by directional price movement before generating signals.
✔️ Candle-Based Background Logic – Subtle candle highlights rather than full background fills, for better chart clarity.
✔️ Trade Cooldown Period – Prevents consecutive buy/sell signals within a defined period, improving signal efficiency.
✔️ Dynamic EMA Confirmation – Ensures trades align with the overall trend, reducing counter-trend trades.
✔️ Customizable Inputs – Adjust breakout thresholds, EMA length, and cooldown periods as per trading style.
✔️ Works Across Multiple Timeframes – Can be applied to intraday, swing, and positional trading strategies.
How to Use
1. Look for Balanced Price Ranges ( BPR )
• These zones highlight equilibrium areas where price is likely to break out.
• Grey-shaded candles indicate potential breakout zones.
2. Monitor for Bullish or Bearish Breakouts
• A green candle background signals a bullish breakout above BPR.
• A red candle background signals a bearish breakdown below BPR.
• The EMA filter helps confirm whether the breakout aligns with the prevailing trend.
3. Follow the Cooldown Logic
• After a breakout signal, wait for the cooldown period before another trade is allowed.
• This helps filter out noisy price action and prevents excessive trading.
4. Use Alongside Other Indicators
• Works well with volume analysis, support/resistance levels, and price action strategies.
• Can be combined with other momentum indicators for further trade confirmation.
Why This Combination?
Unlike generic breakout indicators, this script uniquely combines:
• BPR historical structures for defining potential breakout zones.
• Momentum-based breakout filtering using EMA confirmation.
• Trade cooldown logic to avoid excessive trading signals.
• Subtle candle-based highlights instead of cluttered full-background fills.
This structured approach makes the indicator more robust, adaptive, and reliable in different market conditions.
Why It’s Worth Using?
🔹 Avoid False Breakouts: Built-in momentum confirmation prevents weak or fake breakouts.
🔹 Clean Visualization: No excessive overlays—just precise, meaningful background coloring for breakouts.
🔹 Works in Any Market: Use on stocks, crypto, forex, indices, and commodities across different timeframes.
🔹 User-Friendly & Customizable: Fine-tune parameters to match individual trading styles.
⚠️ Note: This is an Invite-Only script. Access is granted to selected users.
✅ If you find it useful, consider incorporating it into your trend-following & breakout trading strategies.
🚀 Optimize your trading with structured breakout detection! 🚀
Trend Break Targets [MarkitTick]Trend Break Targets
Trend Break Targets is a technical analysis tool designed to assist traders in identifying trendline breakouts and projecting potential price targets based on market geometry. Unlike fully automated indicators that guess trendlines, this tool provides you with precise control by allowing you to manually Pivot Point the trendline to specific points in time, while automating the complex math of target projection and structure mapping.
Theoretical Basis & Concepts
This indicator is grounded in classic technical analysis principles found in foundational trading literature. It automates the following methodology:
Drawing a trend line between two key points to represent dynamic support or resistance.
Identifying a breakout when the price closes above or below this line, potentially signaling a change in trend.
Calculating a price target by measuring the vertical distance between the breakout line and the last high/low (pivot), then projecting that same distance in the direction of the breakout.
This concept is based on methods and "Measured Move" theories explained in classic books such as "Technical Analysis of Stock Trends" by Edwards & Magee, "Technical Analysis of the Financial Markets" by John Murphy, and in Thomas Bulkowski's Price Pattern Studies.
How It Works
Pivot Pointed Trendline Construction The script draws a trendline between two user-defined points in time (Start Date and End Date). It calculates the slope between these points and extends the line infinitely to the right, allowing you to define the exact structure (e.g., a resistance trendline on a wedge).
Breakout Detection The script monitors the "Price Source" (High, Low, or Close) relative to the extended trendline.
A Bullish Breakout (BC) occurs when the Close crosses above a bearish trendline.
A Bearish Breakout (BC) occurs when the Close crosses below a bullish trendline.
Dynamic Target Projection (The Math) Upon a confirmed breakout, the script automatically calculates three distinct targets by identifying the most significant "Swing Point" (Pivot) prior to the breakout.
Distance (D): The vertical distance between the Trendline and the Pivot Price at the specific bar where the pivot occurred.
Target 1 (T1): The Breakout Price +/- (Distance × 1.0). This represents a classic 1:1 measured move.
Target 2 (T2): The Breakout Price +/- (Distance × 1.618). Based on the Golden Ratio extension.
Target 3 (T3): The Breakout Price +/- (Distance × 2.618).
Market Structure (CHOCH) The script includes an optional Change of Character (CHOCH) module. This runs independently of the trendline logic, identifying local Swing Highs and Swing Lows based on the "Swing Detection Length." It plots dashed lines and labels to visualize immediate shifts in market structure.
How to Use This Tool
This is an interactive tool that requires user input to define the setup.
Identify a Setup: Locate a clear trend, wedge, or flag pattern on your chart.
Set Pivot Points: Go to the Indicator Settings. Input the exact Start Date and End Date corresponding to the two main touches of your trendline.
Monitor for Breakout: The script will extend the line. Wait for a "BC" label to appear.
Trade Management: Once "BC" prints, the T1, T2, and T3 lines will instantly render. These can be used as potential take-profit zones or areas to tighten stop-losses.
Settings & Configuration
Indicator Settings
Start/End Date: The timestamp Pivot Points for your trendline.
Price Source: Determines what price (High or Low) Pivot Points the line and triggers the breakout.
Pivot Left/Right: Adjusts the sensitivity for finding the "Pivot Before Break" used for target calculations.
Extend Target Line: How far forward the target lines are drawn.
Visual Style
Colors: Fully customizable colors for the Trendline, Breakout Labels, and each Target level (T1, T2, T3).
Gold Bullish Reversal
This analysis dissects a confirmed bullish reversal on Gold using a custom Trend Break system. The setup identifies a transition from a bearish corrective phase to bullish momentum, validated by a structural break and a geometric target projection.
Trend Identification (The Pivot Points) The descending white trendline serves as the primary dynamic resistance, defining the bearish correction.
Pivot Points: The line is drawn connecting two significant swing highs, marked by Label 1 and Label 2.
Logic: These points represent the "lower highs" characteristic of the previous downtrend. As long as price remained below this trajectory, the bearish bias was intact.
The Trigger: Breakout & Confirmation The transition occurs at the candle marked BC (Breakout Candle).
Breakout Criteria: The indicator logic dictates that a signal is only valid when the bar closes above the trendline. This filters out intraday wicks and ensures genuine buyer commitment.
CHOCH Confluence: Immediately following the breakout, a CHOCH (Change of Character) label appears. This signals a shift in market structure, indicating that the internal lower-high/lower-low sequence has been violated, adding probability to the reversal.
Target Projection: The Measured Move The vertical green lines (T1, T2) represent profit objectives derived from the depth of the prior move. The logic calculates the distance between the breakout line and the lowest pivot prior to the break.
T1 (Standard Target): This is a 1:1 projection of the pre-breakout volatility. We see price action initially stalling near this level, confirming it as a zone of interest.
T2 (Golden Ratio Extension): The second target is calculated as the initial distance multiplied by 1.618 (Fibonacci Golden Ratio). The chart shows the price rallying aggressively through T1 to tap the T2 zone, often considered an exhaustion or major take-profit level in harmonic extensions.
Conclusion Gold has successfully invalidated the 4-hour bearish trendline. The confluence of a confirmed close above resistance (BC) and a structural shift (CHOCH) provided a high-probability long setup. The price has now fulfilled the T2 (1.618) extension, suggesting traders should watch for consolidation or a reaction at this key Fibonacci resistance level.
Bearish Trendline Breakdown
The image displays a Bearish Trendline Breakdown on the Gold (XAUUSD) 4-hour chart. The indicator is actually functioning in "Low" mode here (connecting swing lows to form support), which triggers the bearish logic found in the code. Here is the step-by-step breakdown:
The Setup: Pivot Points & Trendline
Visual: The Blue Labels "1" and "2" connected by a white diagonal line.
Code Logic: These are the user-defined start and end points.
Pivot Point 1 (startDate): The starting pivot of the trendline.
Pivot Point 2 (endDate): The ending pivot.
Trendline: The code draws a line between these two points and extends it to the right (extend.right). In this specific image, the line acts as a Support Trendline.
The Trigger: Break Candle (BC)
Visual: The Red Label "BC" appearing just below the white trendline.
Code Logic: This is the execution signal. The code detects a "Down Break" (dnBreak) because the Price Source was likely set to "Low" and the candle's Close was lower than the Trendline Price at that specific bar (close < currLinePrice). This confirms the support level has been breached.
The Projection: Targets (T1 & T2)
Visual: The Green Labels "T1" and "T2" with dotted horizontal lines projected downward.
Code Logic: These are profit targets based on a "Measured Move."
Pivot Calculation: The script looks back for a recent "Pivot High" (the peak before the crash) to calculate the volatility/distance (dist) between that peak and the trendline.
T1 (Conservative): The price is projected downward by 1x that distance (currLinePrice - dist).
T2 (Extended): The price is projected downward by 1.618x that distance (Golden Ratio extension).
Market Context: CHOCH
Visual: The small Red/Orange "CHOCH" labels appearing above the price action.
Code Logic: This is a secondary confirmation system running independently of the trendline. It detects a Change of Character (structural shift). The red labels indicate a "Bearish CHOCH," meaning the price broke below a significant prior swing low (last_swing_low). This supports the bearish bias of the trendline break.
Disclaimer This tool is for educational and technical analysis purposes only. Breakouts can fail (fake-outs), and past geometric patterns do not guarantee future price action. Always manage risk and use this tool in conjunction with other forms of analysis.

RSI Volatility Suppression Zones [BigBeluga]RSI Volatility Suppression Zones is an advanced indicator that identifies periods of suppressed RSI volatility and visualizes these suppression zones on the main chart. It also highlights breakout dynamics, giving traders actionable insights into potential market momentum.
🔵 Key Features:
Detection of Suppression Zones:
Identifies periods where RSI volatility is suppressed and marks these zones on the main price chart.
Breakout Visualization:
When the price breaks above the suppression zone, the box turns aqua, and an upward label is drawn to indicate a bullish breakout.
If the price breaks below the zone, the box turns purple, and a downward label is drawn for a bearish breakout.
Breakouts accompanied by a "+" label represent strong moves caused by short-lived, tight zones, signaling significant momentum.
Wave Labels for Consolidation:
If the suppression zone remains unbroken, a "wave" label is displayed within the gray box, signifying continued price stability within the range.
Gradient Intensity Below RSI:
A gradient strip below the RSI line increases in intensity based on the duration of the suppressed RSI volatility period.
This visual aid helps traders gauge how extended the low volatility phase is.
🔵 Usage:
Identify Breakouts: Use color-coded boxes and labels to detect breakouts and their direction, confirming potential trend continuation or reversals.
Evaluate Market Momentum: Leverage "+" labels for strong breakout signals caused by short suppression phases, indicating significant market moves.
Monitor Price Consolidation: Observe gray boxes and wave labels to understand ongoing consolidation phases.
Analyze RSI Behavior: Utilize the gradient strip to measure the longevity of suppressed volatility phases and anticipate breakout potential.
RSI Volatility Suppression Zones provides a powerful visual representation of RSI volatility suppression, breakout signals, and price consolidation, making it a must-have tool for traders seeking to anticipate market movements effectively.
