Hyper Squeeze Sniper (Dual Side: Long + Short)Hyper Squeeze Sniper (Dual Side Strategy)
This script is a comprehensive Volatility Breakout System designed to identify and trade explosive price moves following periods of consolidation. It combines the classical "Squeeze" theory with Linear Regression Momentum, Volume Analysis, and an ATR-based Trailing Stop to filter false signals and manage risk effectively.
The script operates on a logic of "Compression -> Explosion -> Trend Following" suitable for both Long and Short positions.
🛠 Detailed Methodology (How it works)
1. The Squeeze Detection (Consolidation) The core concept relies on the relationship between Bollinger Bands (BB) and Keltner Channels (KC).
Condition: When the Bollinger Bands (Standard Deviation) contract and fall inside the Keltner Channels (ATR based), it indicates a period of extremely low volatility (The Squeeze).
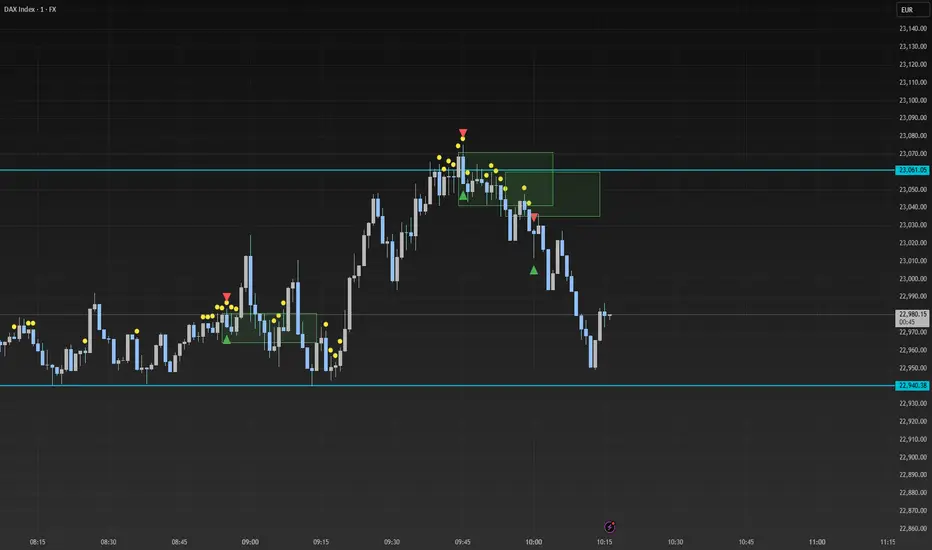
Visual: The background turns Gray to indicate "Do Not Trade / Wait Mode".
2. Momentum Confirmation (Linear Regression) Instead of using standard lagging indicators, this script utilizes Linear Regression of the price deviation to determine the direction of the breakout.
If the Linear Regression Slope > 0, the bias is Bullish.
If the Linear Regression Slope < 0, the bias is Bearish.
3. Volume Validation To avoid fake breakouts, a Volume Spike filter is applied. A signal is only valid if the current volume exceeds its moving average by a defined multiplier (Default x1.2).
4. Risk Management: ATR Trailing Stop Once a trade is entered, the script calculates a dynamic Trailing Stop based on the Average True Range (ATR).
- Long: The stop line trails below the price and never moves down.
- Short: The stop line trails above the price and never moves up.
- Exit: The position is closed immediately when the price breaches this volatility-based safety line.
How to Use
1. Wait: Look for the Gray Background. This is the accumulation phase.
2. Entry:
LONG: Wait for a Green Triangle ▲ (Price breaks Upper BB + Vol Spike + Bullish Momentum).
SHORT: Wait for a Red Triangle ▼ (Price breaks Lower BB + Vol Spike + Bearish Momentum).
3. Exit: Close the position when the "X" mark appears or when candles cross the trailing safety line.
Settings
- BB Length/Mult: Adjust the sensitivity of the squeeze detection.
- Vol Spike Factor: Increase this to filter out low-volume breakouts.
- ATR Period/Mult: Adjust the trailing stop distance (Higher = Wider stop for swing trading).
Pine Script®指標