SNIPER ORB V4SNIPER ORB V4
### What It Does
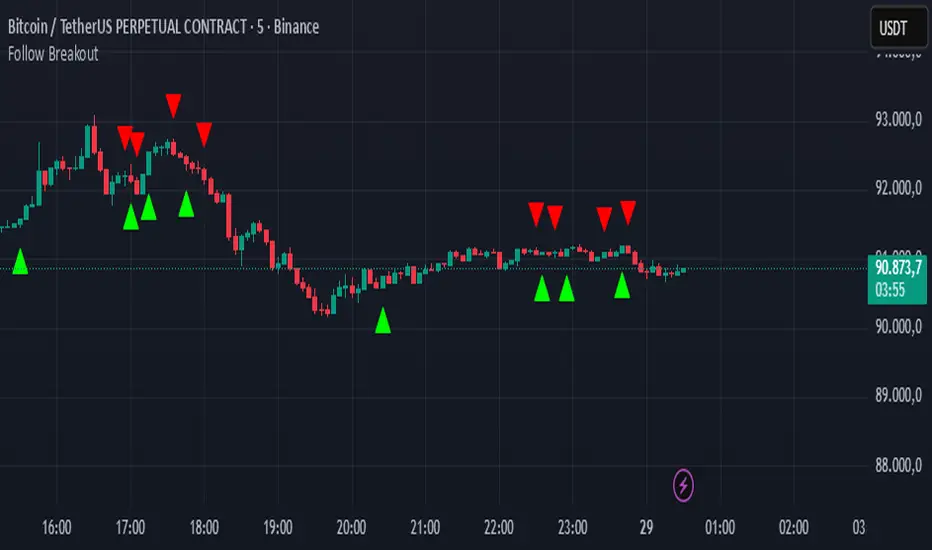
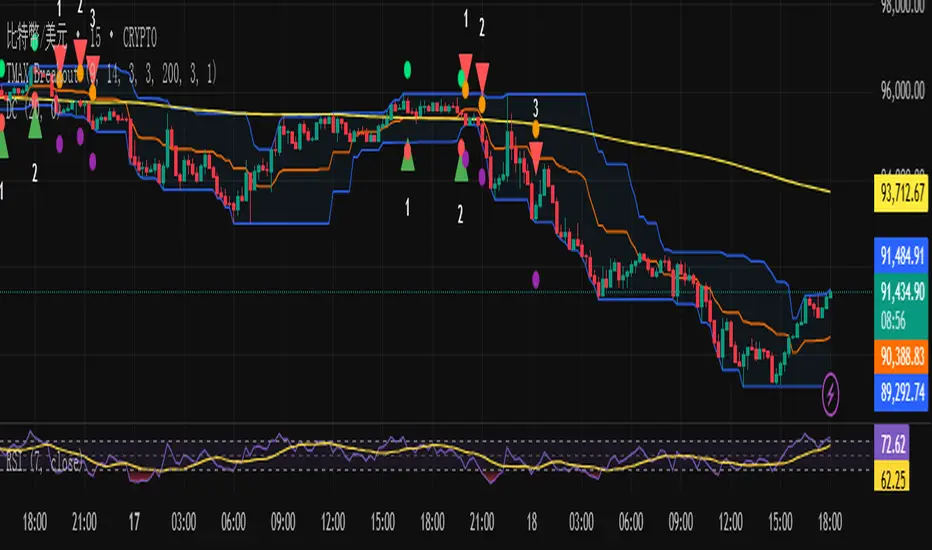
Draws 5/15/30 minute Opening Range Breakout levels with confirmation patterns.
### Session Times
| Session | Hours (ET) |
|---------|------------|
| London | 3:00 - 9:30 |
| New York | 9:30 - 17:00 |
### Levels Drawn
| Level | Color Default | Purpose |
|-------|---------------|---------|
| 5m ORB H/L | Blue | Scalp levels |
| 15m ORB H/L | Cyan | Swing levels |
| 30m ORB H/L | Purple | **Primary levels** |
| Targets 1x-3x | Green/Red | Profit targets |
### Signals
| Signal | Meaning | Priority |
|--------|---------|----------|
| `ORB↑` | Confirmed breakout up | ⭐⭐ |
| `ORB↓` | Confirmed breakout down | ⭐⭐ |
| `RT↑` | Retest long entry | ⭐⭐⭐ **BEST** |
| `RT↓` | Retest short entry | ⭐⭐⭐ **BEST** |
| `FVG↑` | FVG zone long | ⭐⭐⭐ |
| `FVG↓` | FVG zone short | ⭐⭐⭐ |
| `ABS` | Absorption (caution) | ⚠️ Warning |
| `FK!` | Fakeout detected | ❌ Avoid |
### FVG Zones (Blue Boxes)
- **Bullish FVG** = Gap below price → Support zone
- **Bearish FVG** = Gap above price → Resistance zone
- **Best Entry** = Price touches FVG + Engulfing candle
### Bar Colors
| Color | Meaning |
|-------|---------|
| Bright Green | Bullish breakout confirmed |
| Bright Red | Bearish breakout confirmed |
| Light Green | Bullish retest entry |
| Light Red | Bearish retest entry |
### Info Table Key
| Field | Green = Good | Yellow/Orange = Caution |
|-------|--------------|-------------------------|
| Volume | HIGH VOL | Normal |
| Body | STRONG (70%+) | Normal/Weak |
| Status | BROKE HIGH/LOW | IN RANGE |
### Quick Trade Plan
```
LONG:
1. Wait for 30m ORB to complete
2. Watch for ORB↑ breakout
3. WAIT for pullback to ORB High
4. Enter on RT↑ or FVG↑ signal
5. SL = Below 30m ORB Low
6. TP = Target 1x or 2x
SHORT:
1. Wait for 30m ORB to complete
2. Watch for ORB↓ breakout
3. WAIT for pullback to ORB Low
4. Enter on RT↓ or FVG↓ signal
5. SL = Above 30m ORB High
6. TP = Target 1x or 2x
```
---
Pine Script®指標