VWAP + Range Breakout (Pre-Signal for Manual Entry)WHAT IT DOES
This tool highlights potential breakout opportunities when price sweeps the previous day’s high or low and aligns with VWAP and short-term range levels. It provides both pre-signals (early warnings) and confirmed signals (breakout closed) so traders can prepare before momentum accelerates.
Works on all timeframes and across markets (indices, forex, crypto). Especially useful during active London and New York sessions.
---
KEY FEATURES
Daily sweep logic: previous day high/low as liquidity reference
VWAP with cumulative calculation
Adjustable range breakout levels
Optional SMA trend filter
Session filter (London / NY trading hours)
Pre-Signal markers (early alert before breakout)
Confirmed LONG/SHORT signals after breakout close
Alerts for Pre-Long, Pre-Short, and Confirmed entries
---
HOW TO USE
1. Wait for price to sweep the previous day high/low.
2. Look for alignment with VWAP and the defined range breakout levels.
3. Use trend/session filters for higher accuracy.
4. Combine with your own risk management rules.
---
SETTINGS TIPS
Adjust range lookback for different timeframes (shorter for fast intraday, longer for higher timeframes).
Enable/disable session filters depending on your market.
Use SMA trend filter to stay aligned with higher-timeframe bias.
---
WHO IT’S FOR
Scalpers, intraday, and swing traders who want early signals when liquidity is taken and price is preparing for a breakout.
---
NOTES
For educational purposes only. No financial advice.
This script is open-source; redistribution follows TradingView rules.
在腳本中搜尋"breakout"

TF Sys-1Richard Dennis (Prince of the Pit) invested 1,600 dollar and reportedly made 350 Million dollars (within 10 years). The key is that, fortunes are caught by catching the big moves and catching them before they are plainly visible to the crowd.
This Trend Following Indicator combine both Trend Following Calculation and Stage Analysis to provide the clarity of trend direction and the complete plan how to trade by risking only 2%. It provides the position sizing, breakout location, stop loss and Pyramiding strategy (Conservative or Aggressive). I will provide a complete guide how to utilize the indicator and trend following Philosophy in my store in Whop.
Next time, when someone recommend any ticker you will see in which stage the ticker is and the breakout point. This indicator will not provide financial advice, it is a tool for decision making and your partner to achieve your goal (to be a successful trend following trader) where fortune lays.

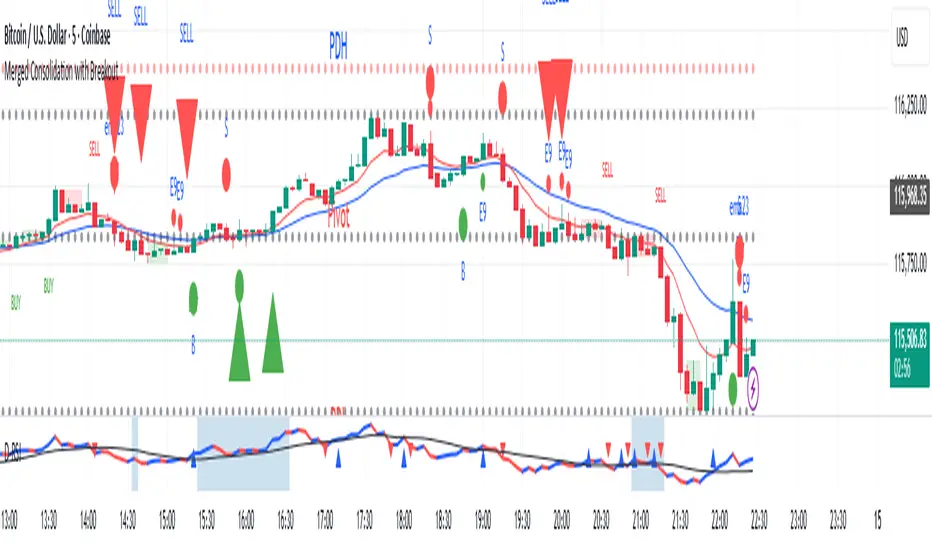
Merged Consolidation with BreakoutAll ingridients in one indicator.
1. CPR
2. EMA's
3. Consolidation and breakouts.
EMA Cross + KC Breakout + ATR StopThis uses an adjustable EMA Cross with an adjustable Keltner Channel breakout filter to identify trend breakouts for Long/Short entries. An adjustable ATR Stop is also provided for your entries.

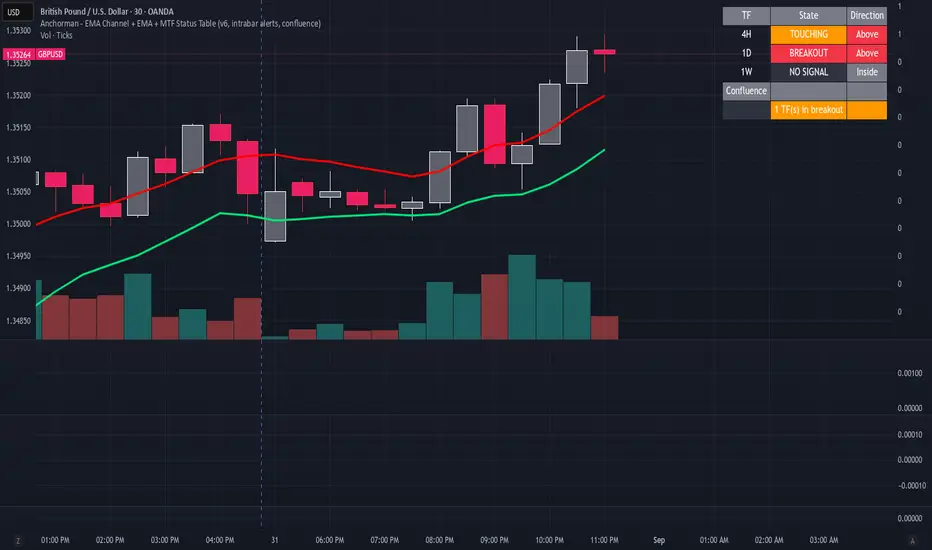
Anchorman - EMA Channel + EMA + MTF Status Table PRICE BREAKOUTUses a high/low EMA Channel to tell you when strong price breakouts are happening plus comes with a EMA to help follow the trend if you like. I designed it so it can alert you when a single TF touch happens or a breakout alignment on MTF happens (I recommend this) its up to you also its single alert so no need to do bullish or bearish signals just one signal will alert you when a breakout happens in EITHER direction.
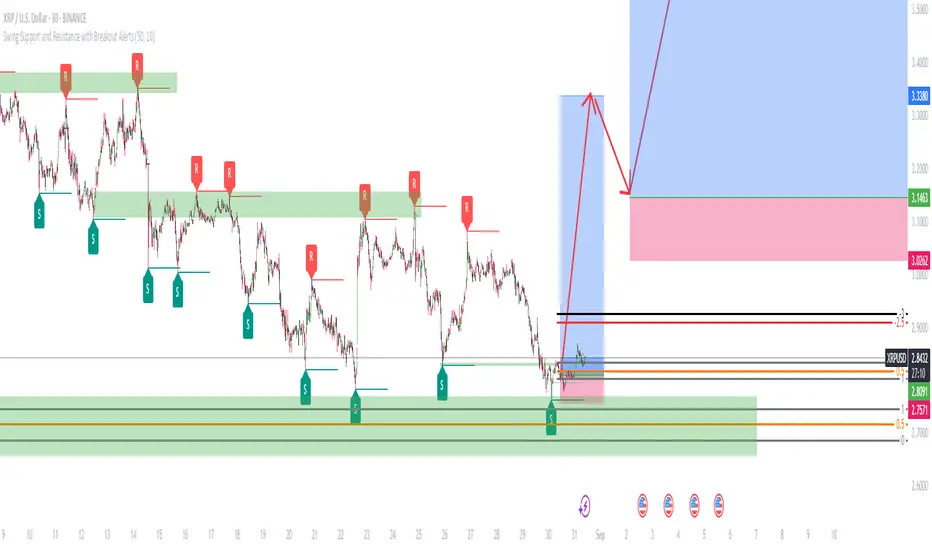
Swing Support and Resistance with Breakout AlertsOverview
The indicator is a custom Pine Script tool designed for TradingView that automatically identifies and plots Swing Highs (Resistance) and Swing Lows (Support). It dynamically draws horizontal lines at these key price reversal points, extending them forward until they are broken, which provides traders with visual, data-driven support and resistance levels. The indicator also includes customizable alerts to notify users when a breakout occurs.
Key features
Dynamic Swing Detection: The indicator automatically detects significant swing high and low points based on a user-adjustable "Swing Detection Length" parameter. This allows traders to fine-tune the sensitivity, focusing on either short-term swings or major market turning points. Swing Length Adjustable.
Adaptive Support and Resistance Zones: The script plots horizontal lines at the detected swing levels. These lines dynamically extend forward in time, acting as predictive support and resistance zones until the price convincingly breaks through them.
Historical Context: Once a support or resistance level is broken, the indicator can optionally keep the line on the chart but changes its appearance (e.g., to a dashed line). This allows traders to see how previous levels have held or been violated, as broken resistance often becomes new support and vice versa.
Customizable Breakout Alerts: A key feature is the ability to generate alerts. When the price closes above a recent resistance line or below a recent support line, a notification is triggered. This helps traders monitor potential breakouts in real-time.
Visual Clarity: Users can customize the colors and styles of the lines and labels to suit their preferences, making it easier to distinguish between different levels and maintain a clean chart.
How to use
This indicator is a powerful tool for technical analysis and can be used in several ways:
Identify Market Structure: It provides a clear, visual representation of a market's recent structure and key reversal points.
Develop Trading Strategies: It can form the basis of a breakout strategy by using the alert function to identify when a key level is broken.
Set Stop-Loss and Take-Profit Levels: The swing highs and lows act as natural reference points for placing stop-loss orders and potential profit targets.
Confirm Trend Reversals: A failure to make a new swing high or low while the price moves in that direction can be a sign of a weakening trend and a potential reversal.
Always use proper risk management and stop-loss orders to protect your capital in case the market moves against your trade.
Keep in mind that the provided indicator is a simple example based on the Swing Highs (Resistance) and Swing Lows (Support) concepts and should not be considered financial advice.
Traders often combine multiple concepts to develop their trading strategies. The provided indicator should be treated as a starting point to explore and implement in your trading strategy.
Trendline + Bull/Bear Flag + EMA 9/21 Buy-Sell Signalseasy scalping and buy sell signals on 9-21 ema cross and trendline breakout

HTF HV Lines + Exceptional + Nearest Breakout (core only)Non-repainting breakout tool that maps high-volume (HV) levels from a higher timeframe (Daily by default) onto any intraday chart. It detects new HV bars only when the higher-timeframe candle closes, then draws persistent horizontal lines at that bar’s high and low. Optionally color “exceptional” volume events. On the trading timeframe, the script watches the nearest HV line and flags breakouts using OHLC quality checks: ATR-scaled close distance, minimum real body, and small opposite wick. Inputs let you cap stored events, tune strictness, ignore stale lines, and manage visual style easily.

Volumetric Support and Resistance [BackQuant]Volumetric Support and Resistance
What this is
This Overlay locates price levels where both structure and participation have been meaningful. It combines classical swing points with a volume filter, then manages those levels on the chart as price evolves. Each level carries:
• A reference price (support or resistance)
• An estimate of the volume that traded around that price
• A touch counter that updates when price retests it
• A visual box whose thickness is scaled by volatility
The result is a concise map of candidate support and resistance that is informed by both price location and how much trading occurred there.
How levels are built
Find structural pivots uses ta.pivothigh and ta.pivotlow with a user set sensitivity. Larger sensitivity looks for broader swings. Smaller sensitivity captures tighter turns.
Require meaningful volume computes an average volume over a lookback period and forms a volume ratio for the current bar. A pivot only becomes a level when the ratio is at least the volume significance multiplier.
Avoid clustering checks a minimum level distance (as a percent of price). If a candidate is too close to an existing level, it is skipped to keep the map readable.
Attach a volume strength to the level estimates volume strength by averaging the volume of recent bars whose high to low range spans that price. Levels with unusually high strength are flagged as high volume.
Store and draw levels are kept in an array with fields for price, type, volume, touches, creation bar, and a box handle. On the last bar, each level is drawn as a horizontal box centered at the price with a vertical thickness scaled by ATR. Borders are thicker when the level is marked high volume. Boxes can extend into the future.
How levels evolve over time
• Aging and pruning : levels are removed if they are too old relative to the lookback or if you exceed the maximum active levels.
• Break detection : a level can be removed when price closes through it by more than a break threshold set as a fraction of ATR. Toggle with Remove Broken Levels.
• Touches : when price approaches within the break threshold, the level’s touch counter increments.
Visual encoding
• Boxes : support boxes are green, resistance boxes are red. Box height uses an ATR based thickness so tolerance scales with volatility. Transparency is fixed in this version. Borders are thicker on high volume levels.
• Volume annotation : show the estimated volume inside the box or as a label at the right. If a level has more than one touch, a suffix like “(2x)” is appended.
• Extension : boxes can extend a fixed number of bars into the future and can be set to extend right.
• High volume bar tint : bars with volume above average × multiplier are tinted green if up and red if down.
Inputs at a glance
Core Settings
• Level Detection Sensitivity — pivot window for swing detection
• Volume Significance Multiplier — minimum volume ratio to accept a pivot
• Lookback Period — window for average volume and maintenance rules
Level Management
• Maximum Active Levels — cap on concurrently drawn levels
• Minimum Level Distance (%) — required spacing between level prices
Visual Settings
• Remove Broken Levels — drop a level once price closes decisively through it
• Show Volume Information on Levels — annotate volume and touches
• Extend Levels to Right — carry boxes forward
Enhanced Visual Settings
• Show Volume Text Inside Box — text placement option
• Volume Based Transparency and Volume Based Border Thickness — helper logic provided; current draw block fixes transparency and increases border width on high volume levels
Colors
• Separate colors for support, resistance, and their high volume variants
How it can be used
• Trade planning : use the most recent support and resistance as reference zones for entries, profit taking, or stop placement. ATR scaled thickness provides a practical buffer.
• Context for patterns : combine with breakouts, pullbacks, or candle patterns. A breakout through a high volume resistance carries more informational weight than one through a thin level.
• Prioritization : when multiple levels are nearby, prefer high volume or higher touch counts.
• Regime adaptation : widen sensitivity and increase minimum distance in fast regimes to avoid clutter. Tighten them in calm regimes to capture more granularity.
Why volume support and resistance is used in trading
Support and resistance relate to willingness to transact at certain prices. Volume measures participation. When many contracts change hands near a price:
• More market players hold inventory there, often creating responsive behavior on retests
• Order flow can concentrate again to defend or to exit
• Breaks can be cleaner as trapped inventory rebalances
Conditioning level detection on above average activity focuses attention on prices that mattered to more participants.
Alerts
• New Support Level Created
• New Resistance Level Created
• Level Touch Alert
• Level Break Alert
Strengths
• Dual filter of structure and participation, reducing trivial swing points
• Self cleaning map that retires old or invalid levels
• Volatility aware presentation using ATR based thickness
• Touch counting for persistence assessment
• Tunable inputs for instrument and timeframe
Limitations and caveats
• Volume strength is an approximation based on bars spanning the price, not true per price volume
• Pivots confirm after the sensitivity window completes, so new levels appear with a delay
• Narrow ranges can still cluster levels unless minimum distance is increased
• Large gaps may jump past levels and immediately trigger break conditions
Practical tuning guide
• If the chart is crowded: increase sensitivity, increase minimum level distance, or reduce maximum active levels
• If useful levels are missed: reduce volume multiplier or sensitivity
• If you want stricter break removal: increase the ATR based break threshold in code
• For instruments with session patterns: tailor the lookback period to a representative window
Interpreting touches and breaks
• First touch after creation is a validation test
• Multiple shallow touches suggest absorption; a later break may then travel farther
• Breaks on high current volume merit extra attention
Multi timeframe usage
Levels are computed on the active chart timeframe. A common workflow is to keep a higher timeframe instance for structure and a lower timeframe instance for execution. Align trades with higher timeframe levels where possible.
Final Thoughts
This indicator builds a lightweight, self updating map of support and resistance grounded in swings and participation. It is not a full market profile, but it captures much of the practical benefit with modest complexity. Treat levels as context and decision zones, not guarantees. Combine with your entry logic and risk controls.

Lowest Low Breakout Signal w/ Target
### **Script Description**
This TradingView Pine Script indicator identifies breakout entry opportunities after a new **lowest low** is formed within a user-defined lookback period. It is designed for traders who want to catch reversals or breakouts from extreme lows with clearly defined targets.
**Key Features:**
* **Lowest Low Detection**: The script monitors price action for a candle that forms a new lowest low within the specified lookback period.
* **Breakout Entry Signal**: Once a breakout occurs (price closes above the high of the lowest-low candle), an **up arrow** is plotted below the entry bar.
* **Target Calculation**: Calculates **Target 1** as 50% retracement of the distance between the latest swing high and the lowest low.
* **Dynamic Table Display**: Shows real-time **Entry Price** and **Target 1** values in a table fixed on the chart (top-right corner), updating with each signal.
* **Alerts**: Sends alerts when a breakout entry signal occurs, making it easy to automate notifications.
* **Clean Visualization**: Removes clutter by eliminating extra labels and lines, using only a simple arrow and table for clarity.
**Use Case:**
Ideal for breakout traders, swing traders, and those who follow retracement-based profit targets. The indicator helps identify early entries after significant lows and provides a clear first target level.

Opening Range BreakoutThis indicator is designed for Opening Range Breakout (ORB) traders who want automatic calculation of breakout levels and multiple price targets.
It is optimised for NSE intraday trading, capturing the first 15-minute range from 09:15 to 09:30 and plotting key breakout targets for both long and short trades.
✨ Features:
Automatic daily reset — fresh levels are calculated every trading day.
Opening Range High & Low plotted immediately after 09:30.
Two profit targets for both Buy & Sell breakouts based on the opening range size:
T1 = 100% of range added/subtracted from OR high/low.
T2 = 200% of range added/subtracted from OR high/low.
Clear breakout signals (BUY / SELL labels) when price crosses the OR High or Low.
Custom alerts for both buy and sell triggers.
Designed to work on any intraday timeframe (1min, 3min, 5min, etc.).
📊 How it works:
From 09:15 to 09:30, the script records the highest and lowest prices.
At 09:30, the range is locked in and breakout targets are calculated automatically.
Buy and Sell signals are generated when price breaks above the OR High or below the OR Low.
Targets and range lines automatically reset for the next day.
⚠️ Notes:
This script is tuned for NSE market timings but can be adapted for other markets by changing the session input.
Works best on intraday charts for active traders.
This is not financial advice — always backtest before trading live.

Dr. Fib - FGBAB - Open Range Breakout for Indexes v2.0 *** EXCLUSIVELY FOR INDEXES ***
This Open Range Breakout Indicator (ORB) helps your discretionary trading when looking for breakouts on the 15 mins range; and you can use it on small time frames to time your entries with more precision.
This indicator helps your discretionary trading by allowing visual settings that helps discretionary trades to make faster decisions.
It will provide you will the following on-screen information:
- ORB HIGH and LOW: The Open Range Breakout set by the input parameters, for example the first 15 mins RTH Open from 9:30 to 6:45.-
- ORB MID: The ORB mid point for reference, generally the price tends to return and bounce from the 50% ORB.
Reward to Risk posible targets for LONG and SHORT trades: This will provide target value references, it is based on the ORB Risk from high to low, you have 1:1, 2:1, 3:1 and 4:1 possible targets in both directions.
Reference table:
The reference table is a visual setting for you to have at first sight important information before considering getting into the trade:
- ORB HIGH and LOW.
- Risk in points.
- Risk in USD.
- Amount of contracts considering the MaxRisk input parameter you select.
- The current LIVE R:R based on the entry, if price is abobe ORB High it will simulate a LONG position is price is below the ORB Low it will simulate a SHORT position,
- The LIVE profit simulation based on the above.
- MaxRunUP, the highest equity the trade simulation has produced.
Direction: The current trade direction simulation based on the ORB HIGH or ORB LOW.
This new version (2.0) will provide historical ORB's and Target in the chart so you can use for future references and past performance analysis.
Keep in mind this indicator is a "gauge" a visual help for discretionary traders that like to trade Open Range Breakout strategy.
It will reset the ORB at RTH Close and build a new ORB at next RTH calendar day based in the ORB time you have selected by the input parameters.
Please feel free to use in your own trading at your own discretion.

EMA Squeeze BreakoutEMA Squeeze Breakout Strategy Overview
This TradingView PineScript indicator identifies potential bullish breakouts based on Exponential Moving Averages (EMAs) "squeezing" together, followed by a price surge with volume confirmation.
Dr. Fib - FGBAB - Open Range Breakout for Stocks V1.0This Open Range Breakout Indicator (ORB) helps your discretionary trading when looking for breakouts on the 15 mins range.
This indicator helps your discretionary trading by allowing visual settings that helps discretionary trades to make faster decisions.
It will provide you will the following on-screen information:
- ORB HIGH and LOW: The Open Range Breakout set by the input parameters, for example the first 15 mins RTH Open from 9:30 to 6:45.-
- ORB MID: The ORB mid point for reference, generally the price tends to return and bounce from the 50% ORB.
Reward to Risk posible targets for LONG and SHORT trades: This will provide target value references, it is based on the ORB Risk from high to low, you have 1:1, 2:1, 3:1 and 4:1 possible targets in both directions.
Reference table:
The reference table is a visual setting for you to have at first sight important information before considering getting into the trade:
- ORB HIGH and LOW.
- Risk in points.
- Risk in USD.
- Amount of shares considering the MaxRisk input parameter you select.
- The current LIVE R:R based on the entry, if price is abobe ORB High it will simulate a LONG position is price is below the ORB Low it will simulate a SHORT position,
- The LIVE profit simulation based on the above.
- MaxRunUP, the highest equity the trade simulation has produced.
Direction: The current trade direction simulation based on the ORB HIGH or ORB LOW.
Keep in mind this indicator is a "gauge" a visual help for discretionary traders that like to trade Open Range Breakout strategy.
It will reset the ORB at RTH Close and build a new ORB at next calendar day based in the ORB time you have selected by the input parameters.
Please feel free to use in your own trading at your discretion.

Opening Range Box with Breakout LabelsOverview
This strategy automates the classic Opening Range breakout trading technique by identifying the price range during a specified initial time window (the "Opening Range") each trading day, and then triggers trades when the price breaks out above or below this range. It draws a visual box around the opening range for clarity and provides breakout signals with configurable take profit and stop loss levels expressed in pips.
Key Features
Configurable Opening Range Time Window:
Define the start and end time of the opening range session using hour and minute inputs (24-hour format). For example, you can set it to capture the first 15 minutes after market open.
Extended Box Display:
Optionally extend the opening range box display by a configurable number of hours beyond the initial range period for ongoing visual reference.
Opening Range Box Visualization:
A semi-transparent colored box is drawn on the chart representing the high and low price of the opening range period, updating dynamically as the session progresses.
Breakout Detection & Entry Signals:
The strategy detects breakouts once the opening range session ends (including the extended period). It places:
A long entry when the price closes above the opening range high.
A short entry when the price closes below the opening range low.
Take Profit and Stop Loss in Pips:
You can define your desired take profit and stop loss levels in pips, allowing consistent risk management tailored to the instrument's pip value.
Visual Breakout Labels:
Up and down arrow labels appear on the chart at breakout points to clearly mark trade signals.
Max Breakout Labels Limit:
Limits the number of breakout labels displayed on the chart to avoid clutter.

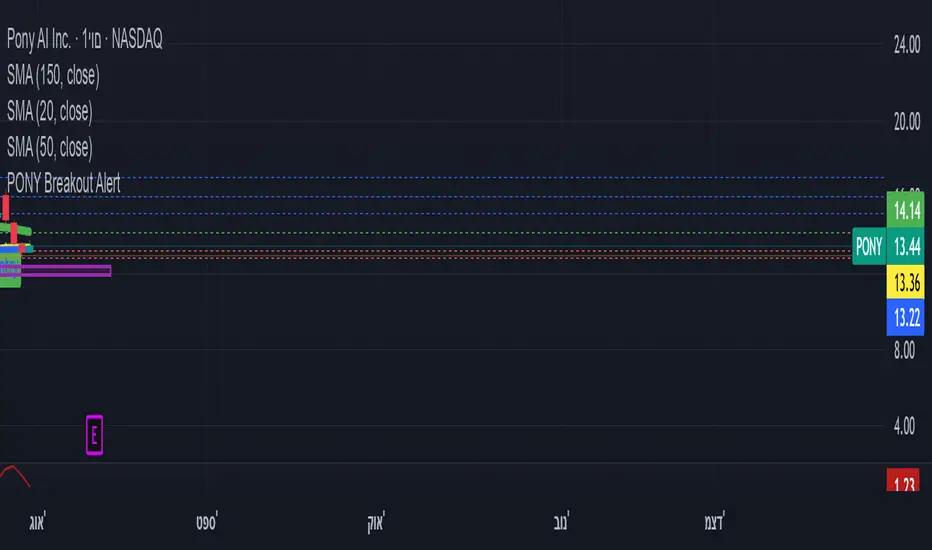
ombs- PONY Breakout Alert
🧠 תקציר הסקריפט: **PONY Breakout Alert 📈
🔍 **מטרה**:
לזהות **פריצה מעלה של רמת 14.15** תוך כדי **מחזור מסחר גבוה מהממוצע**, כדי לאתר **הזדמנות מסחר שורית**.
---
⚙️ רכיבי הסקריפט:
* 📌 **רמת כניסה**:
`entryLevel = 14.15`
* 📊 **תנאי כניסה**:
* סגירת מחיר **מעל 14.15**
* נפח מסחר **גבוה ב־20% מהממוצע ל־20 הימים האחרונים**
* 🔔 **התראה ויזואלית**:
* סמל ירוק "Entry" מופיע מתחת לנר על הגרף
* קווים קבועים לרמות יעד וסטופלוס
* 🎯 **יעדי רווח**:
* Target 1 – 15.15
* Target 2 – 16.00
* Target 3 – 17.00
* 🛑 **סטופלוס**:
* שמרני: 13.20
* אגרסיבי: 12.80
* 🔔 **התראה אוטומטית** (`alertcondition`):
תשלח הודעה:
*"PONY פרצה מעל 14.15 עם מחזור גבוה – שקול כניסה לעסקה."*
---
📝 מתאים עבור:
* סוחרי ניתוח טכני 🧮
* מי שמחפש כניסה מבוססת על פריצה + נפח 📊
* שימוש על גרף יומי בלבד 📅
---
🧠 Script Summary: PONY Breakout Alert 📈
🔍 Objective:
Detect a breakout above the 14.15 level accompanied by high trading volume, in order to identify a bullish trading opportunity.
⚙️ Script Components:
📌 Entry Level:
entryLevel = 14.15
📊 Entry Conditions:
Price closes above 14.15
Volume is 20% higher than the 20-day average
🔔 Visual Alert:
A green "Entry" label appears below the bar on the chart
Static horizontal lines mark targets and stop-loss levels
🎯 Profit Targets:
Target 1 – 15.15
Target 2 – 16.00
Target 3 – 17.00
🛑 Stop Loss:
Conservative: 13.20
Aggressive: 12.80
🔔 Automated Alert (alertcondition):
Sends a message:
"PONY has broken above 14.15 with high volume – consider a long position."
📝 Ideal For:
Technical traders 🧮
Those seeking breakouts confirmed by volume 📊
Daily chart setups only 📅
Inside Bar Breakout with TP/SL - ModifiedInside Bar Breakout Trade Plan
Strategy Overview
This plan utilizes the Inside Bar Breakout indicator to identify high-probability breakout trades. The strategy capitalizes on consolidation patterns (inside bars) followed by breakouts from mother bars, with predefined risk management.

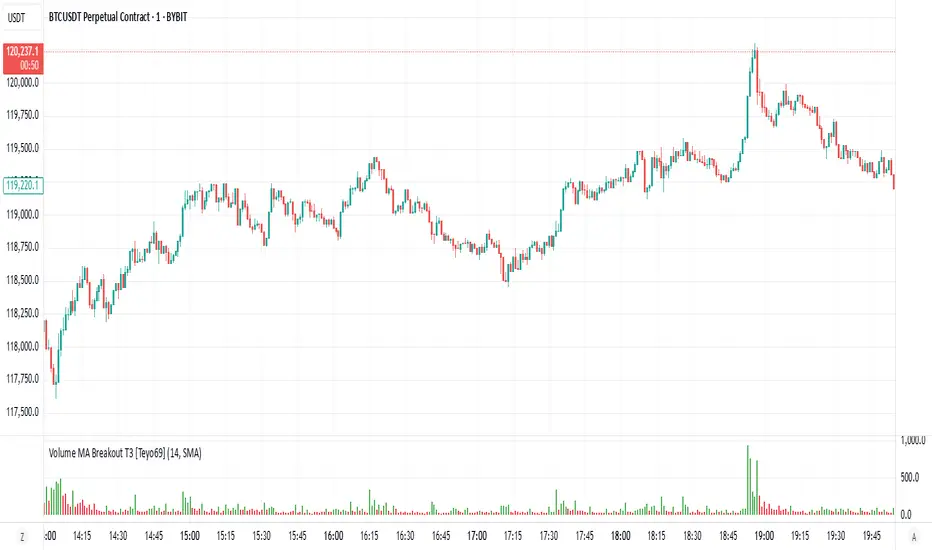
Volume MA Breakout T3 [Teyo69]🧭 Overview
Volume MA Breakout T3 highlights volume bars that exceed a dynamic moving average threshold. It helps traders visually identify volume breakouts—periods of significant buying or selling pressure—based on user-selected MA methods (SMA, EMA, DEMA).
🔍 Features
Volume Highlighting: Green bars indicate volume breakout above the MA; red bars otherwise.
Custom MA Options: Choose between SMA, EMA, or Double EMA for volume smoothing.
Dynamic Threshold: The moving average line adjusts based on user-defined length and method.
⚙️ Configuration
Length: Number of bars used for the moving average calculation (default: 14).
Method: Type of moving average to use:
"SMA" - Simple Moving Average
"EMA" - Exponential Moving Average
"Double EMA" - Double Exponential Moving Average
📈 How to Use
Apply to any chart to visualize volume behavior relative to its MA.
Look for green bars: These suggest volume is breaking out above its recent average—potential signal of momentum.
Red bars indicate normal/subdued volume.
⚠️ Limitations
Does not provide directional bias—use with price action or trend confirmation tools.
Works best with additional context (e.g., support/resistance, candle formations).
🧠 Advanced Tips
Use shorter MAs (e.g., 5–10) in volatile markets for more responsive signals.
Combine with OBV, MFI, or accumulation indicators for confluence.
📌 Notes
This is a volume-based filter, not a signal generator.
Useful for breakout traders and volume profile enthusiasts.
📜 Disclaimer
This script is for educational purposes only. Always test in a simulated environment before live trading. Not financial advice.
Bollinger BandWidth Squeeze BreakoutBollinger BandWidth Squeeze Breakout
Description:
This indicator merges classic Bollinger BandWidth (BBW) with TTM Squeeze Pro-style compression dots. It identifies volatility contractions, very effective at identifying chop or ranging markets, and color-codes the BBW line based on directional breakout bias—helping traders anticipate explosive moves before they happen.
It supports multi-level squeeze detection:
High Compression (Orange) : Tightest squeeze — highly coiled setup
Medium Compression (Red) : Moderate squeeze — building pressure
Low Compression (Black) : Light squeeze — early contraction
(No dot means no squeeze – free expansion)
How It Works
Bollinger BandWidth (BBW):
Calculated as the percent width between Bollinger Bands over a selected moving average (SMA, EMA, etc.). A rising BBW suggests volatility expansion; falling BBW indicates compression.
Directional Bias (BBW Color):
The line is colored green when recent bars show upside breakout pressure, red when downside pressure dominates, and gray when neutral. This is based on cumulative position of price relative to the Bollinger Bands.
TTM Squeeze Pro Dots:
Compression dots plotted on the zero line represent volatility squeeze levels, using up to 3 Keltner Channel thresholds:
Orange Dot : High compression (tightest squeeze zone)
Red Dot : Medium compression
Black Dot : Low compression
(No dot means no squeeze — price is expanding)
Expansion & Contraction Context:
Plots historical highest/lowest BBW values (user-defined period) to help spot extreme conditions.
How to Interpret:
Use squeeze dots to identify when the market is “chop/ranging.” Breakouts from these zones often come with sharp moves.
BBW Line Color = Bias Filter:
Green → Bullish expansion pressure
Red → Bearish expansion pressure
Gray → Neutral or undecided
Use this to filter direction before entering a breakout or momentum trade.
Inputs:
Length : Period for BB and Keltner calculations
MA Type : Choose from SMA, EMA, SMMA, WMA, VWMA, or None
StdDev : Standard deviation for BB
Expansion/Contraction Lengths : Historical window to track BBW extremes
Source : Input source for all calculations (default: Close)
Keltner Multipliers : Customize thresholds for high/mid/low compression
Best For:
Traders looking to anticipate breakout direction
Scalpers and swing traders seeking early volatility cues
Anyone using BB or TTM Squeeze logic in their setups
Pro Tips:
Combine with momentum tools (e.g., RSI, MACD, SMI, CCI) to confirm breakout thrust
Use squeeze dot color shifts (red/orange → no dot) as a breakout timing tool
Use historical BBW highs/lows as context for relative volatility expansion

Opening Range Breakout (15 mins Range)Take the guesswork out of your trading with the Opening Range Breakout Pro script. This tool automatically marks the high and low of the first 15 minutes of the NYSE session, then highlights the first candle to break out above or below this range—removing ambiguity from your trade entries.
The opening range is one of the most powerful concepts in day trading. By identifying the price range set during the market’s first minutes, you gain a clear framework for your trades. When price breaks out above the range, it often signals a strong bullish move; a break below signals bearish momentum. This script visually marks these moments, so you can react quickly and confidently.
Why use Opening Range Breakout Pro?
• Defined Entry and Exit Points: The script gives you clear, objective breakout levels—no more guessing when to enter a trade.
• Removes Emotional Trading: With visual cues for breakouts, you can follow a systematic approach and avoid hesitation or FOMO.
• Backtested, Time-Tested Strategy: The opening range breakout has been used by professional traders for decades to capture early trends and maximize profit potential.
• High Reward Potential: By capitalizing on the volatility and momentum of the opening session, traders often catch the best moves of the day.
• Easy to Use: Just add to your chart—no configuration needed. The script works on any NYSE stock, on a 5-minute chart.
How it works:
• Draws the opening 15-minute high and low as orange lines.
• Labels the range prices for quick reference.
• Marks the first candle to close above the range with an orange ▲, and the first to close below with an orange ▼.
Take control of your trading day, remove uncertainty, and trade with confidence—just like the pros.

ORB Breakout Indicator - NQ1!The purpose of this indicator is to assist traders in rapidly identifying high-probability Opening Range Breakout (ORB) setups on the NQ1! 1-minute time frame (Nasdaq Futures)
Key Features:
Opening Range: Automatically plots the high and low of the 1st 15min of the (NYSE session) (09:30–09:45 EST)
Breakout Signals : Illustrates the first candle that breaks upward or downward and:
Green arrow for a bullish breakout
Red arrow for a bearish breakout
Clean Visuals: Dynamic lines show the high and low of the ORB window for easy reference.
(DON'T USE THIS ONLY FOR ENTRY SIGNALS, PAIR THIS WITH OTHER INFLUENCES TO GET HIGH PROBABILITY BREAKOUTS)
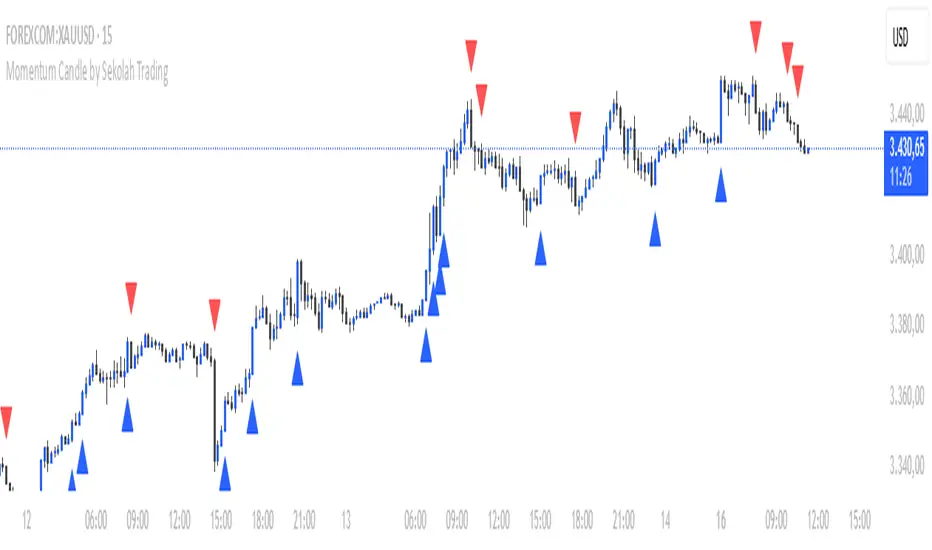
Momentum Candle by Sekolah Trading## 🔷 Introduction
**Momentum Candle by Sekolah Trading** is a proprietary price action tool that identifies high-conviction candles with large bodies and minimal wicks, based on dynamically adjusted thresholds tailored to each pair and timeframe. This script helps traders recognize moments of price acceleration that often precede breakouts, trend continuation, or sharp reversals.
---
## 🔷 What Makes This Script Unique (Originality & Utility)
Unlike traditional candle filters that rely on static size comparisons, this indicator uses:
- **Instrument-specific pip sensitivity**: Automatically detects if the pair is XAUUSD, JPY-based, or other Forex instruments.
- **Timeframe-based calibration**: Adjusts body size thresholds dynamically for 5m, 15m, 30m, and 1h.
- **Wick ratio control**: Validates only candles with short wicks (<30%), filtering indecisive moves.
- **Non-repainting logic**: Signals appear after candle close, with no future data lookahead.
This logic has been tested and refined internally by **Sekolah Trading**, designed for scalpers and intraday traders who rely on clean price action structure.
---
## 🔷 How It Works
1. **Pair & Timeframe Detection**
Adjusts `minRange` dynamically based on:
- Gold (XAUUSD), JPY pairs, or other Forex
- Timeframe: 5m to 1h
2. **Candle Structure Analysis**
- Calculates body = `abs(open - close)`
- Wick = `upper + lower shadows`
- Valid only if wick is under 30% of total candle
3. **Conditions for Signal**
- Body ≥ minRange
- Wick ≤ 30%
- Clear bullish or bearish direction
4. **Plots**
- 🔺 Blue triangle = Bullish momentum candle
- 🔻 Red triangle = Bearish momentum candle
---
## 🔷 How to Use
1. **Add to any 5m–1h chart**, ideally on XAUUSD or major Forex pairs
2. **Wait for signal triangle** to appear at the close of a candle
3. Use with:
- Trend indicators (MA, Supertrend, etc.)
- Support/resistance zones
- Breakout levels
4. **Set alerts** using:
`Momentum Candle (Body)`
---
## 🔷 Why This Script is Closed-Source
This indicator includes proprietary logic created by **Sekolah Trading** for professional and community use:
- Original dynamic pip sensitivity calibration
- Custom multi-condition filtering
- Non-reused, non-public logic with adaptive precision
The source is protected to prevent unauthorized duplication. However, all relevant logic and intent have been clearly explained above as required by TradingView’s House Rules.
---
## 🔷 Disclaimer
This indicator does not provide financial advice or guaranteed signals. Always combine with your own analysis and risk management. Historical performance does not guarantee future results.
---
## 🔷 Suggested Tags
`momentum`, `price action`, `breakout`, `forex`, `xauusd`, `jpy`, `scalping`, `candle`, `non-repainting`, `trend confirmation`
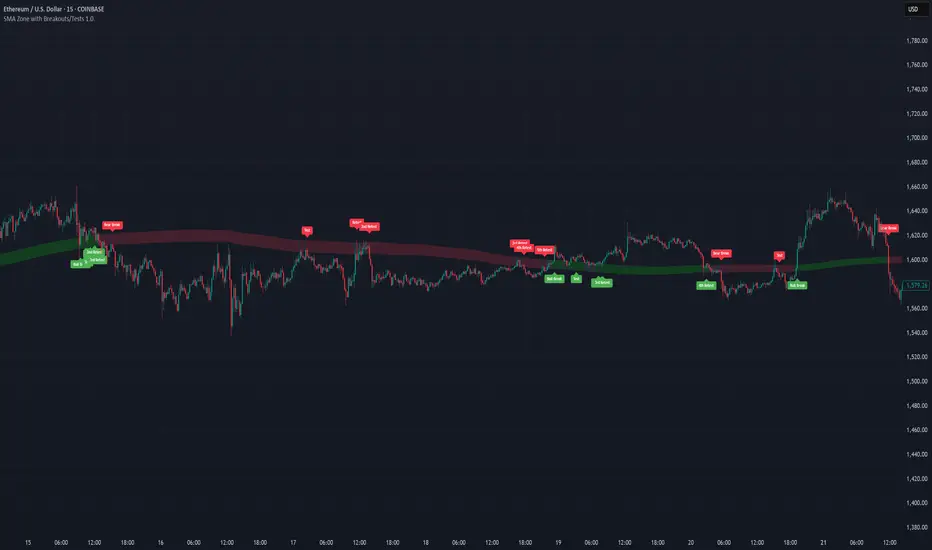
SMA Zone with Breakouts/Tests 1.0.This indicator plots a dynamic “SMA Zone” between two simple moving averages (one applied to lows, one to highs) and highlights key interaction points with the zone:
Breakouts
Bull Break: price closes above the upper SMA
Bear Break: price closes below the lower SMA
Requires confirmation via either above-average volume or an unusually wide bar (spread > ATR) closing near its extreme
Tests & Retests
After a breakout, the first re-entry into the zone edge is labeled “Test,” subsequent re-entries are numbered “Retest,” “2nd Retest,” etc.
Zone Weakening: each additional Test/Retest signifies diminished zone strength—fewer reliable boundaries remain (Traditional S/R theory)
Alerts
Fires a unified “Zone Signal” alert on every Break, Test, and Retest (set condition to “Any alert() function call”).
Disclaimer:
This is not financial advice and should not be used as a standalone trading signal.
It’s designed to draw your attention to important price-zone interactions so you can manually tune in.
The logic can be further enhanced or combined with other indicators/algorithms as part of a more complex trading system.