Lancelot RR StrategyDear all,
Free strategy again.
This strategy consists of 2 indicators I think works well with each other as a trend following strategy.
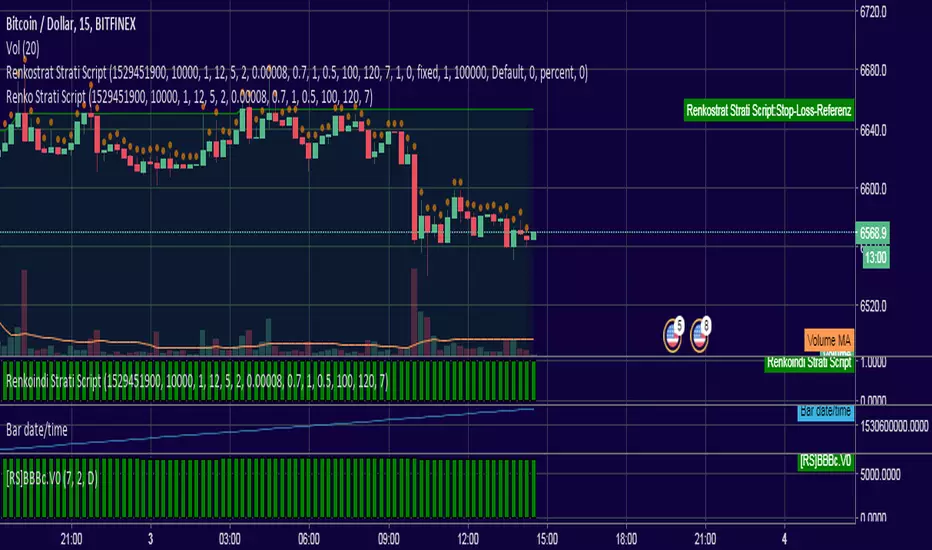
The 2 indicators are Renko chart and Relative Vigor Index.
This is a long-only breakout strategy that aims to capture the majority of the trend.
Works well on BTCUSD XBTUSD, as well as other major liquid Pair.
Please acknowledge my effort by like and follow.
And lastly,
Save Hong Kong, the revolution of our times.
Pine Script®策略