[RS]The Breakout IndicatorSignals when there is a breakout from the trading range(donchian channel up to 300 bars back).Pine Script®指標由RicardoSantos提供已更新 88 1.4 K
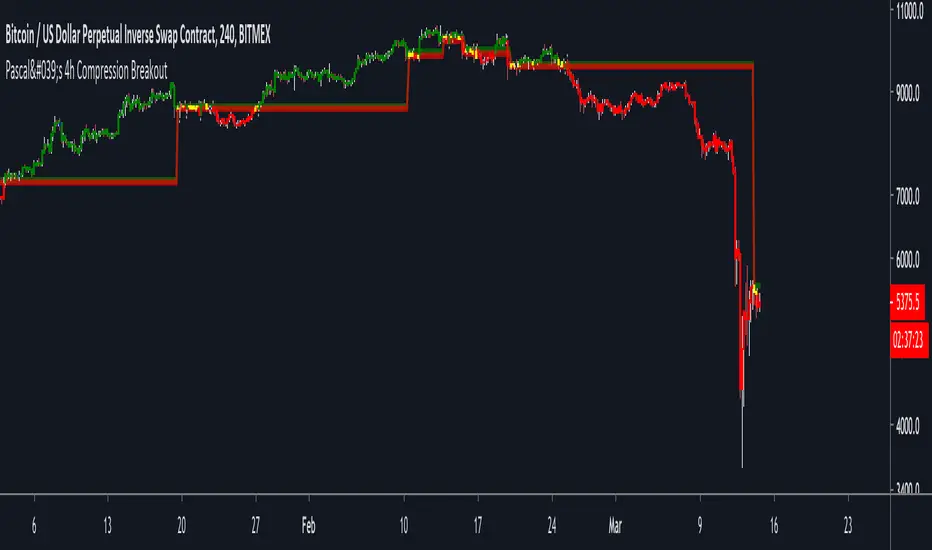
Pascal's 4h Compression BreakoutThis indicator aims to identify areas of price compression, by looking for two consecutive "inside candles" on the 4h chart. An inside candle is simply when the current candle's high is lower than the previous candle's high, and the current candle's low is higher than the previous candle's low. Once price compression is identified, the indicator draws a range based on the highest high and the lowest low of the two inside candles. 1) A break above the range is bullish. 2) A break below the range is bearish. The script ALSO paints candles in blue that are likely to become strong horizontal S/R levels. This is, again, based on a candle pattern. Please note: 1) This indicator is only meant to be used on BITMEX:XBTUSD (on the 4h or 1h chart). 2) You will have to apply some discretion to profitably trade with this indicator. Use SFPs and horizontal S/R levels to judge if a breakout is worth trading. Finally, use the indicator at your own risk. I am not responsible for any losses you may incur. My objective with this indicator g is to hopefully give you something that you can build upon, and NOT a script to blindly copy trade. The concept of market compression is powerful. There are countless ways in which you can build a system around it. This is just the tip of the iceberg. Cheers.Pine Script®指標由odinofcrypto提供55629
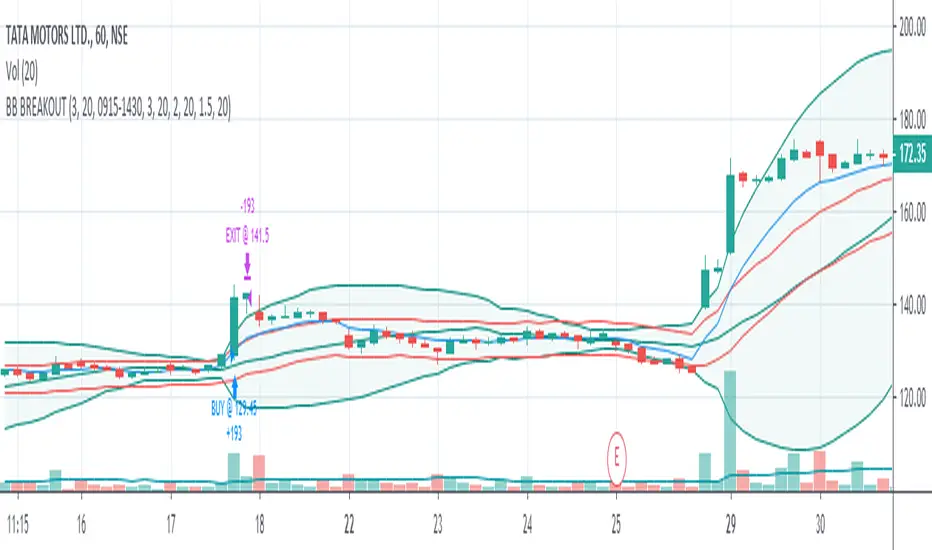
Squeeze Breakout using BB and KC [v1.0][Bishnu103]Squeeze Breakout using BB and KC Pine Script®策略由Bishnu103提供已更新 77451
Breakout Strategy IndicatorBreakout strategy indicator version. Backtested strategy version can be found on my published scripts Pine Script®指標由Yo_adriiiiaan提供33705
Breakout Strategy #1Breakout above previous pivot points trigger a long. Close below pivot lows trigger the exit. Most effective during trends. Pine Script®策略由Yo_adriiiiaan提供已更新 33372
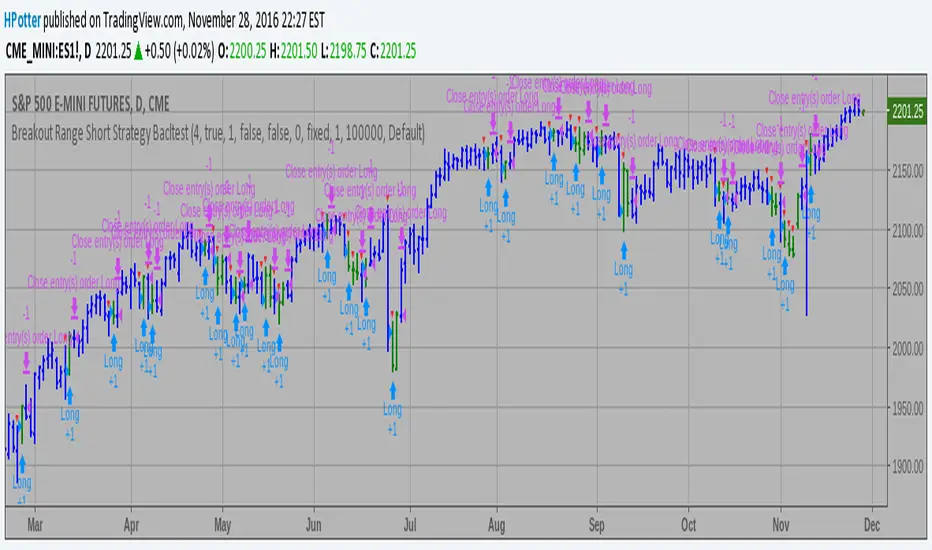
Combo Backtest 123 Reversal & Breakout Range Short This is combo strategies for get a cumulative signal. First strategy This System was created from the Book "How I Tripled My Money In The Futures Market" by Ulf Jensen, Page 183. This is reverse type of strategies. The strategy buys at market, if close price is higher than the previous close during 2 days and the meaning of 9-days Stochastic Slow Oscillator is lower than 50. The strategy sells at market, if close price is lower than the previous close price during 2 days and the meaning of 9-days Stochastic Fast Oscillator is higher than 50. Second strategy Breakout Range Short Strategy WARNING: - For purpose educate only - This script to change bars colors.Pine Script®策略由HPotter提供2235
Combo Strategy 123 Reversal & Breakout Range Short This is combo strategies for get a cumulative signal. First strategy This System was created from the Book "How I Tripled My Money In The Futures Market" by Ulf Jensen, Page 183. This is reverse type of strategies. The strategy buys at market, if close price is higher than the previous close during 2 days and the meaning of 9-days Stochastic Slow Oscillator is lower than 50. The strategy sells at market, if close price is lower than the previous close price during 2 days and the meaning of 9-days Stochastic Fast Oscillator is higher than 50. Second strategy Breakout Range Short Strategy WARNING: - For purpose educate only - This script to change bars colors.Pine Script®指標由HPotter提供46
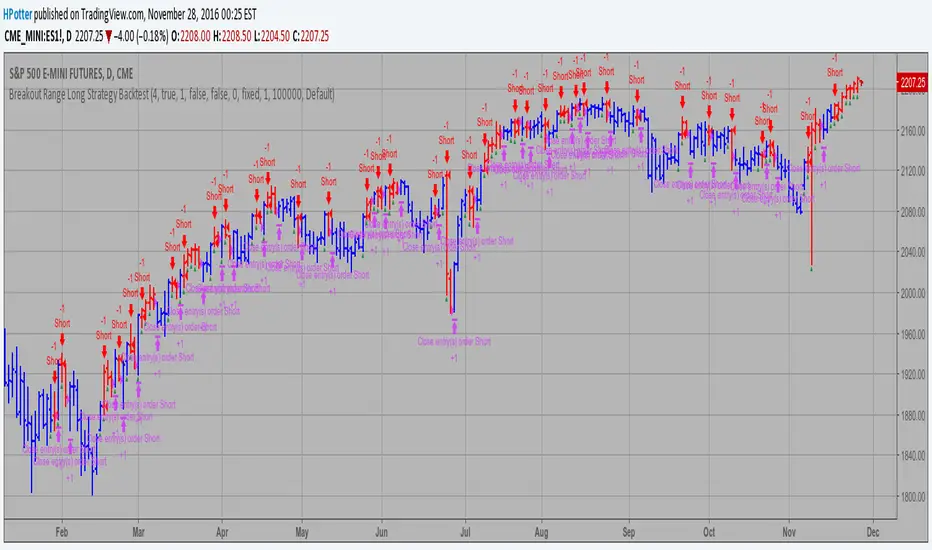
Combo Backtest 123 Reversal & Breakout Range Long This is combo strategies for get a cumulative signal. First strategy This System was created from the Book "How I Tripled My Money In The Futures Market" by Ulf Jensen, Page 183. This is reverse type of strategies. The strategy buys at market, if close price is higher than the previous close during 2 days and the meaning of 9-days Stochastic Slow Oscillator is lower than 50. The strategy sells at market, if close price is lower than the previous close price during 2 days and the meaning of 9-days Stochastic Fast Oscillator is higher than 50. Second strategy Breakout Range Long Strategy WARNING: - For purpose educate only - This script to change bars colors.Pine Script®策略由HPotter提供48
Combo Strategy 123 Reversal & Breakout Range Long This is combo strategies for get a cumulative signal. First strategy This System was created from the Book "How I Tripled My Money In The Futures Market" by Ulf Jensen, Page 183. This is reverse type of strategies. The strategy buys at market, if close price is higher than the previous close during 2 days and the meaning of 9-days Stochastic Slow Oscillator is lower than 50. The strategy sells at market, if close price is lower than the previous close price during 2 days and the meaning of 9-days Stochastic Fast Oscillator is higher than 50. Second strategy Breakout Range Long Strategy WARNING: - For purpose educate only - This script to change bars colors.Pine Script®指標由HPotter提供2226
HV ID/ND4 BreakoutThis indicator is based on Linda Raschke's ID/ND4 Historical Volatility Breakout strategy. It finds days where the high and low are within the previous day high and lows (Inside days), that have also, the narrowest trading range within the last 4 days (it basically checks if the current day has the narrowest range comparing it with the previous 3 days) when the short term historical volatility (6 period default) is relatively low compared to the longer term historical volatility (100 period default) (The condition is that the 6/100 Historical volatility is below 50% of its annual range). More information about how to trade this strategy is described in the book but basically, you would want to place a resting buy and sell stops at the high and low of the day highlighted and enter if you get filled the next day.Pine Script®指標由the_no_factor提供11190
Previous Day High and Low Breakout Bar ColorPrevious Day High and Low Breakout Bar ColorPine Script®指標由ceyhun提供已更新 66555
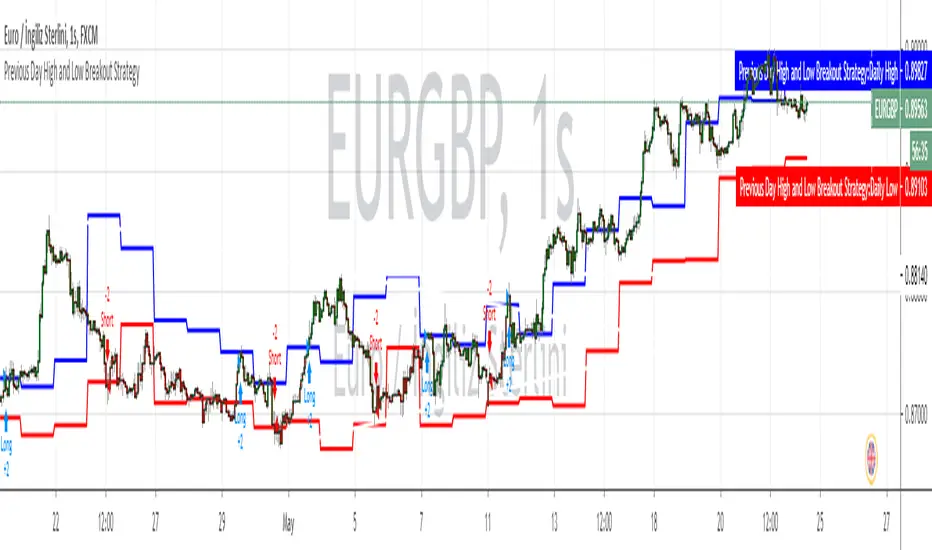
Previous Day High and Low Breakout StrategyPrevious Day High and Low Breakout StrategyPine Script®策略由ceyhun提供已更新 1212912
Hoffman A/D BreakoutStudy based on Rob Hoffman's Accumulation/Distribution Breakout strategy. - Green circle on the top wick indicates a "Distribution" wick - Red circle on the bottom wick indicates an "Accumulation" wick - A distribution wick in an uptrend gets marked as a Key Resistance. This is marked with green crosses - An Accumulation wick in a downtrend gets marked as a Key Support. This is marked with red crosses - Breaking above the Key Resistance indicates a buy entry. This is marked by a green background. - Breaking below the Key Support indicates a sell entry. This is marked by a red backgroundPine Script®指標由ParCorn提供已更新 44316
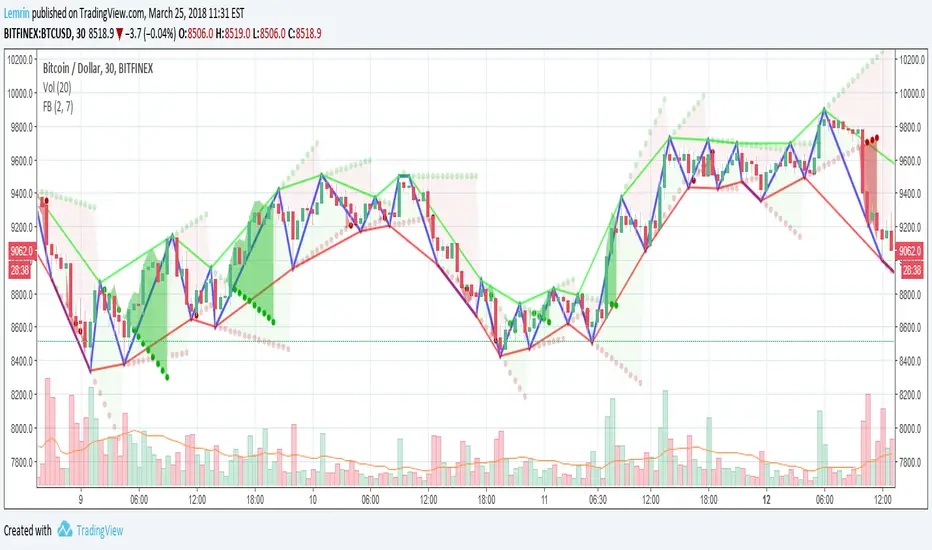
Fractal Breakout V2Version 2 of my fractal pattern aid ( Version 1 ). I added a bouncing line between the high and low trend lines, connecting consecutive extreme points. I also chased down a pesky bug in the slope calculation...and for now I have disabled the ability to change resolution basis for extreme detection (e.g. 30m on a 1hr chart). For fun, I added some shading to make it more apparent at a glance what is happening, but if you find it gimmicky, there's an option to turn that off. I am inexperienced with pattern recognition, so please send feedback if you have any ideas that would make this more useful. Thanks! LemrinPine Script®指標由Lemrin提供已更新 1111 1.3 K
[STRATEGY][RS]Open Session Breakout TraderEXPERIMENTAL: use at your own discretion. custom session breakout strategy, it uses a percentage of daily atr to set breakout limits. strategy only viable for intraday timeframes and is suggested under 1hour.Pine Script®策略由RicardoSantos提供已更新 3232 2.5 K
Breakout Range Short Strategy BacktestBreakout Range Short Strategy You can change long to short in the Input Settings Please, use it only for learning or paper trading. Do not for real trading.Pine Script®策略由HPotter提供180
Breakout Range Long Strategy Backtest Breakout Range Long Strategy You can change long to short in the Input Settings Please, use it only for learning or paper trading. Do not for real trading.Pine Script®策略由HPotter提供204
Fractal Breakout Strategy (by ChartArt)This long only strategy determines the price of the last fractal top and enters a trade when the price breaks above the last fractal top. The strategy also calculates the average price of the last fractal tops to get the trend direction. The strategy exits the long trade, when the average of the fractal tops is falling (when the trend is lower highs as measured by fractals). And the user can manually set a time delay of this exit condition. The default setting is a long strategy exit always 3 bars after the long entry condition appeared. In addition as gimmicks the fractals tops can be highlighted (the default is blue) and a line can be drawn based on the fractal tops.This fractal top line is colored by the fractal top average trend in combination with the fractal breakout condition. This strategy works better on higher time-frames (weekly and monthly), but it also works on the daily and some other time-frames. This strategy does not repaint, no repainting. P.S. I thank Tradingview user barracuda who helped me with the time based exit condition code. And user RicardoSantos for coding the definition of the fractal top, which he uses in his " Fractals" scripts. All trading involves high risk; past performance is not necessarily indicative of future results. Hypothetical or simulated performance results have certain inherent limitations. Unlike an actual performance record, simulated results do not represent actual trading. Also, since the trades have not actually been executed, the results may have under- or over-compensated for the impact, if any, of certain market factors, such as lack of liquidity. Simulated trading programs in general are also subject to the fact that they are designed with the benefit of hindsight. No representation is being made that any account will or is likely to achieve profits or losses similar to those shown.Pine Script®策略由ChartArt提供1616 8.1 K
Inside Bar Breakout FailureSimple indicator to highlight Inside Bar Breakout Failure patterns on chart.Pine Script®指標由FxLowe提供55513
[JR] Multi Bollinger Heat Bands - EMA/Breakout optionsA little, yet hopefully useful update over my previous "Multi Bollinger Heat Bands". For those who like quick visual cue's. In short: It's your Basic Bollinger Bands, but 3 of them, and some pointy things. In full: Three stacked SMA based Bollinger Bands designed just to give you a quick visual on the "heat" of movement. Set inner band as you would expect, then set your preferred additional multiplier increments for the outer 2 bands. Option to use EMA as alternative basis, rather than SMA. Breakout indication shapes, which have their own multiplier (but still tied to same length/period as the BB's) so you can make them pop on their own separate "band". Pine Script®指標由JayRogers提供已更新 1111 3.3 K
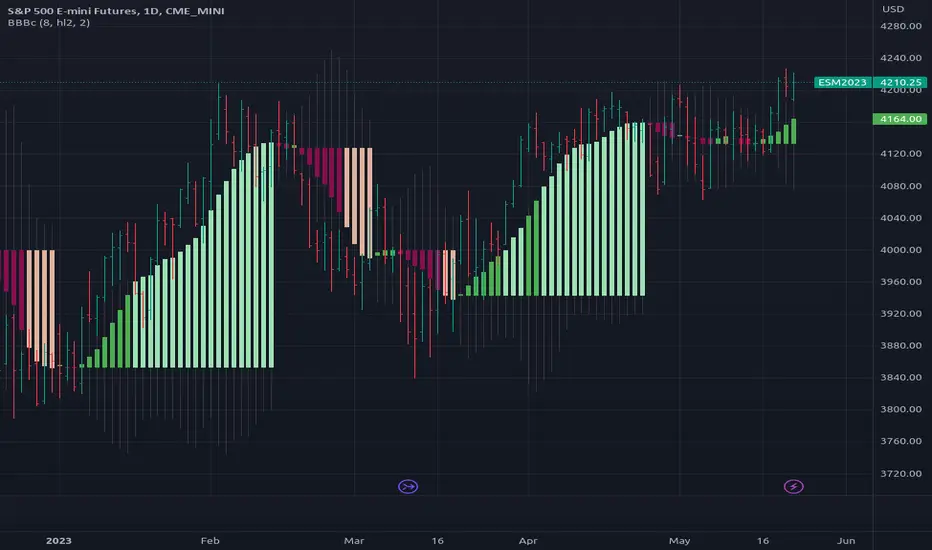
[RS]Bollinger Bands Breakout Candles V0EXPERIMENTAL: a experiment using bollingers and directional momentum, Breakout detector. Pine Script®指標由RicardoSantos提供已更新 1313 2 K