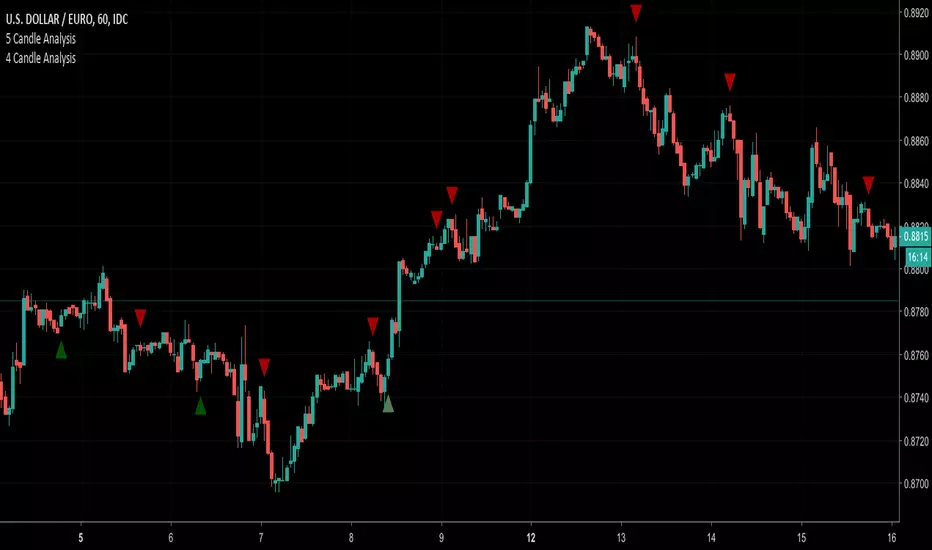
4 Candle AnalysisThis script looks at 4 candles at a time.
If the first 3 candles in the pattern are BEARISH and the 4th candle BULLISH engulfs the 3rd candle then a GREEN triangle UP will display BELOW the 4th candle
If the first 3 candles in the pattern are BULLISH and the 4th candle BEARISH engulfs the 3rd candle then a RED triangle DOWN will display ABOVE the 4th candle
在腳本中搜尋"candle"
M5/H4 Candle Box In order to quickly identify a single H4 candle on an M5 timeframe, I built an indicator that visually aggregates the corresponding lower-timeframe candles.

Alfaza candlepower of candle
it shows the candle that has large volume the 4 previous candles and the candle comes after price drop

Power Candle Morphology Power Score Only- By DaliliPower Candle Morphology Indicator
By Dalili
Overview
This indicator is a price-action–only candle morphology engine designed to identify moments of genuine directional intent rather than noise. It operates strictly on single-bar geometry and immediate context, without moving averages, oscillators, volatility smoothing, or historical aggregation. Each qualifying candle is scored in real time and labeled only when structural dominance is present.
Core Philosophy
Markets move when one side overwhelms the other. This tool quantifies that imbalance directly from the candle itself. It ignores indicators derived from price and instead evaluates how price behaved inside the bar: body dominance, wick asymmetry, closing authority, and classic institutional candle patterns. No hindsight. No averaging. One bar, one judgment.
Morphology Detection
The indicator classifies only high-conviction candle structures:
1. Marubozu variants, where the body controls the full range and the close asserts dominance at the extreme.
2. Engulfing structures, where a current candle decisively absorbs prior opposing intent.
3. Directional pin bars, where rejection is violent and asymmetric, signaling forced participation failure on one side.
If none of these conditions are met, the candle is ignored entirely.
Power Scoring System
Each qualifying candle receives a Power Score from 1 to 10, derived from four independent components:
1. Body dominance as a percentage of total range.
2. Wick asymmetry relative to the body, measuring rejection or control.
3. Close location within the range, measuring who won the bar.
4. Pattern boost for structurally dominant formations.
The score is intentionally capped and discrete. There is no smoothing, rolling average, or cumulative bias.
Signal Output
Only candles that meet both structural qualification and a minimum power threshold are labeled. Labels are minimal by design:
“P#” only, plotted above or below the candle in the direction of dominance. Green denotes bullish control. Red denotes bearish control. No additional text, shapes, or overlays are introduced.
What This Indicator Is Not
It is not predictive.
It is not trend-following.
It is not confirmation-stacking.
It does not care about indicators agreeing with it.
What It Is Used For
This indicator is best used as a decision-quality filter. It answers a single question with precision: Was this candle structurally strong enough to matter? When combined with context such as support and resistance, volume expansion, or volatility contraction, it highlights the exact bars where professional participation is most likely present.
In short, this is a candle truth detector. It strips price action down to dominance, grades it objectively, and stays silent unless something real just happened.

First Sub-Candle Coloring (Fixed) - NEXT LEVELThis script colors the first 15m candle inside a 30m candle based on it being bullish or bearish.
Does the same for the first 30m candle inside a 1h candle.
Directional Candle Size TrackerThis indicator measures the strength of bullish and bearish momentum by tracking the average size of candles — but only when they’re moving in the intended direction.
🟢 Bullish Strength rises when green candles expand in size
🔴 Bearish Strength rises when red candles grow in size
When the market pauses or flips direction, the opposing line flatlines, preserving the last value
Unlike traditional moving averages that blend all candles together, this tracker isolates directional pressure, giving you a clearer read on which side is truly in control. It’s especially useful for spotting momentum decay, trap setups, and regime transitions.
Use it to:
Confirm breakout strength
Detect fading conviction
Compare bullish vs. bearish aggression in real time

Volume Quintile Candle ColorsRecolors the candles based on the quintile of volume in that candle compared to the most recent 100 candles

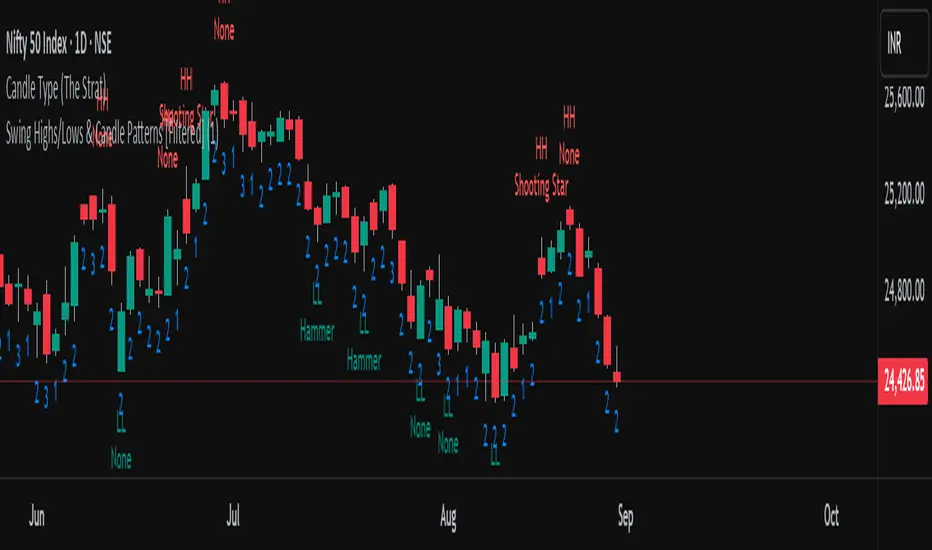
Swing Highs/Lows & Candle Patterns[LuxAlgo] [Filtered]Swing Highs/Lows & Candle Patterns - Tweaked Version
This indicator is a customized and enhanced version of LuxAlgo’s original Swing Highs/Lows & Candle Patterns indicator. It identifies and labels critical swing high and swing low points to help visualize market structure, alongside detecting key reversal candlestick patterns such as Hammer, Inverted Hammer, Bullish Engulfing, Hanging Man, Shooting Star, and Bearish Engulfing.
With added options to selectively display only Lower Highs (LH) and Higher Lows (HL), this tweaked version offers greater flexibility for traders focusing on specific market dynamics. Users can also customize the lookback length and label styling to fit their preferences.
Credit to LuxAlgo for the original concept and foundation of this powerful tool, which this script builds upon to support more tailored technical analysis. Ideal for swing traders and technical analysts seeking improved entry and exit signals through a combination of price swings and candlestick pattern recognition.
First Opposite Candle After 3+ (Yellow & Streak Alerts)This overlay tracks consecutive candle direction: when three or more bars run the same way, the very next opposite-color candle is spotlighted in yellow. Two built-in alert events keep you hands-free:
“First Opposite Candle After 3+” – fires the moment that yellow reversal prints.
“3+ Candle Streak” – pings every bar while a bullish-or-bearish run is ≥ 3 candles long.

Three Candle Bullish Engulfing StrategyThe Three Candle Bullish Engulfing Strategy is a versatile, multi-mode trading system designed for TradingView, combining classic candlestick patterns with momentum confirmation and dynamic risk management. This script supports both swing trading and intraday approaches, as well as an optional RSI-based breakout mode for additional signal filtering.
Key Features:
Three Candle Pattern Detection:
The strategy identifies potential trend reversal points using a three-candle pattern:
The first candle is a strong bullish (or bearish) move.
The second candle is a doji or small-bodied candle, indicating indecision.
The third candle is a bullish (or bearish) engulfing candle that closes above (or below) the previous high (or low), confirming the reversal.
Flexible Trading Modes:
Swing Long Only: Enter long trades on bullish three-candle setups.
Intraday Long & Short: Trade both long and short based on bullish and bearish three-candle patterns, with automatic session-end exits.
RSI Breakout Mode: Enter long trades when the 1-hour RSI exceeds a user-defined threshold (default 80) and a bullish candle forms, with breakout confirmation and a fixed-percentage stop loss.
Visual Aids:
Plots the RSI breakout trigger price and stop loss on the chart for easy monitoring.
How It Works:
Three Candle Pattern Entries:
Long Entry: Triggered when a bullish candle is followed by a doji, then a bullish engulfing candle closes above the previous high.
Short Entry (Intraday only): Triggered by the inverse pattern—bearish candle, doji, then bearish engulfing candle closing below the previous low.
RSI Breakout Entries:
When the RSI on a higher timeframe (default 1 hour) exceeds the set threshold and a bullish candle forms, the script records a trigger price.
A long trade is entered if the price breaks above this trigger, with a stop loss set a fixed percentage below.
Exits:
Positions are closed if the trailing stop is hit, the session ends (for intraday mode), or the stop loss is triggered in RSI breakout mode.
In RSI breakout mode, positions are also closed if a new breakout trigger forms while in position.

[TehThomas] - Displacement CandlesOverview:
This PineScript is designed to detect and visualize significant price movements, called displacements, on a trading chart. It's particularly useful for traders who want to identify potential trend changes or strong market sentiment quickly.
How the Script Works
User Input:
The script allows users to set a custom threshold for displacement detection and choose colors for bullish and bearish movements.
Displacement Detection Function:
isDisplacement(series, threshold) =>
percentage_change = math.abs(series - series ) / series * 100
percentage_change > threshold
This function calculates the percentage change between the current and previous price.
If the change exceeds the set threshold, it's considered a displacement.
Bullish and Bearish Detection:
bullish_displacement = isDisplacement(close, threshold) and close > close
bearish_displacement = isDisplacement(close, threshold) and close < close
Identifies whether the displacement is bullish (price increase) or bearish (price decrease).
Candle Coloring:
barcolor(bullish_displacement ? bullish_color : bearish_displacement ? bearish_color : na)
Changes the color of candles based on the detected displacement type.
Usefulness and Applications:
Trend Identification: Helps in quickly spotting potential trend changes or continuations.
Volatility Analysis: Provides a visual representation of market volatility.
Entry and Exit Signals: Can be used to identify potential entry or exit points for trades.
Market Sentiment: Offers insights into the strength of bullish or bearish sentiment.
Customizable Sensitivity: The adjustable threshold allows traders to fine-tune the indicator based on the asset's typical volatility.
Visual Clarity: By changing candle colors, it provides a clear, at-a-glance view of significant price movements.
Complementary Tool: Can be used alongside other technical indicators for confirmation of signals.
Multiple Timeframe Analysis: Applicable across different timeframes to suit various trading styles (day trading, swing trading, etc.).
Educational Purpose: Helps new traders understand and visualize significant price movements in the market.
Backtesting: Can be incorporated into strategy backtests to assess its effectiveness in different market conditions.
This script is particularly handy for traders who want to cut through market noise and focus on significant price movements. It's versatile enough to be used across different trading strategies and can be a valuable addition to a trader's technical analysis toolkit.
It's a very easy script and not alot to mention. If you see any improvements please let me know.

BoS yellow candleThe "BoS Yellow Candle" indicator identifies and highlights the first candle that breaks a Break of Structure (BoS) in a given look-back period. A BoS occurs when the price either breaks above the highest high or below the lowest low within a user-defined look-back range (default set between 7 and 12 candles).
Bullish Break of Structure: The first candle to break above the previous high is marked with a yellow body.
Bearish Break of Structure: The first candle to break below the previous low is also marked with a yellow body.
This visual aid helps traders quickly identify potential structural breakouts for further analysis or strategy development.

Custom 4-Hour Candle Colors with Opening Price LinesDescription:
This indicator enhances the visual clarity of 4-hour candles by allowing users to assign custom colors to each 4-hour time block on their chart. It also provides the option to plot horizontal lines at the opening price of each 4-hour candle, with the lines extending for a customizable duration (up to 36 hours), making it easy to track the opening price levels over time.
Features:
Custom 4-Hour Candle Colors: Define unique colors for each 4-hour candle block on the chart. You can configure the colors for six different 4-hour periods, making it easier to visually differentiate between different parts of the trading day.
Opening Price Lines: The indicator plots horizontal lines at the opening price of each 4-hour candle, with the option to extend the lines for up to 36 hours into the future. The lines can also have different colors, which you can configure separately for each time block.
Flexible Time Configuration: Set custom open times for each 4-hour candle block, allowing you to adjust the indicator to match specific market sessions or time zones.
Fully Customizable: Choose both the candle colors and the opening price line colors independently for each 4-hour period. This allows for a highly personalized chart setup.
Use Cases:
Session Tracking: Easily track different trading sessions by assigning specific colors to different time periods.
Key Price Levels: Keep an eye on important opening price levels throughout the day by extending opening price lines into the future.
Visual Organization: For traders who prefer color-coded charts for improved readability, this indicator helps to organize trading days visually by color-blocking each time segment.
Important Notes:
Due to TradingView’s limitations, the opening price lines can only extend up to 500 bars into the future. The indicator automatically limits the duration of the lines to this maximum.
The script is designed to be flexible and user-friendly, allowing for easy adjustments to suit different trading styles and market conditions.

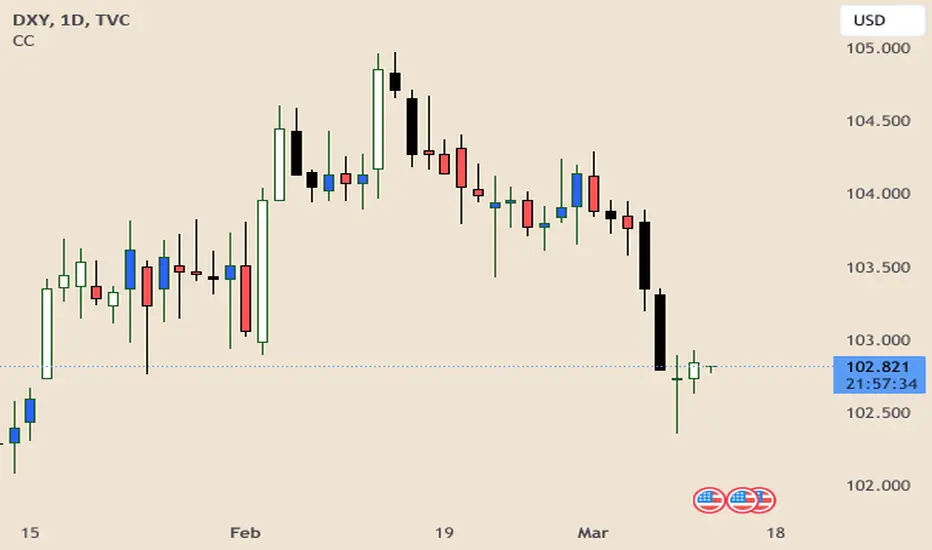
Correlation Coefficient Colored CandlesThis script utilizes Tradingview's built in Correlation Coefficient indicator to calculate the correlation coefficient between two assets and changes candle colors based on the related data.
Info From Correlation Coefficient Indicator:
Correlation Coefficient (CC) is used in statistics to measure the correlation between two sets of data. In the trading world, the data sets would be stocks, etf's or any other financial instrument. The correlation between two financial instruments, simply put, is the degree in which they are related. Correlation is based on a scale of 1 to -1. The closer the Correlation Coefficient is to 1, the higher their positive correlation. The instruments will move up and down together. The higher the Correlation efficient is to -1, the more they move in opposite directions. A value at 0 indicates that there is no correlation.
This indicator allows for choosing the correlated asset, between direct and inverse correlation, the length of the series, and the correlation factor that will trigger the candles to change colors.
Example 1: You choose Direct correlation with a factor of 0.75, the candles that fall below that correlation factor will paint in your desired colors based on their closing price (up or down).
Example 2: You choose Inverse correlation with a factor of -0.75, the candles that rise above that correlation factor will paint in your desired colors based on their closing price (up or down).
Chart Shows Direct correlation of DXY and US10Y with length 3 and correlation factor of 0.75
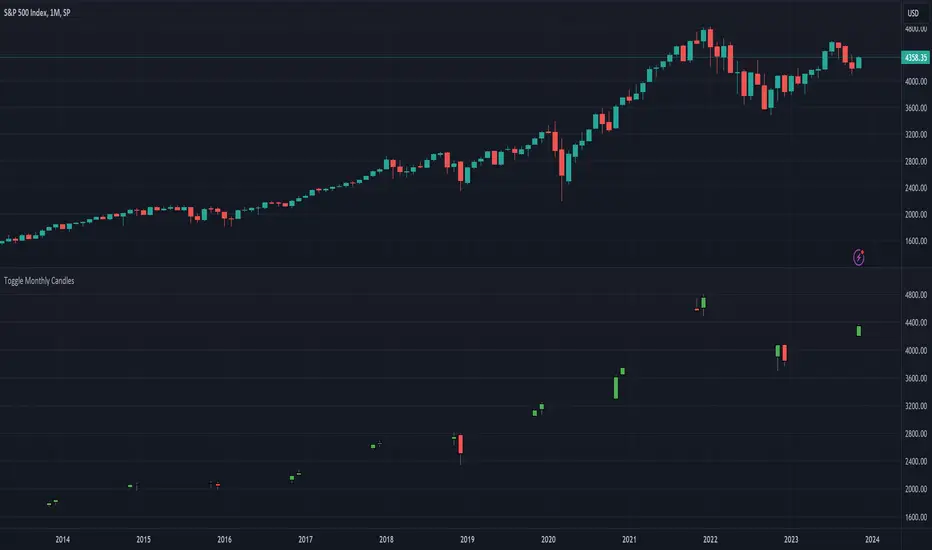
[dharmatech] : Toggle Monthly CandlesThis indicator allows you to only show specific monthly candles.
It's designed to be used with the monthly interval.
The settings allow you specify which months to show.
By default, it only shows January.
In this example screenshot, Nov and Dec are shown.
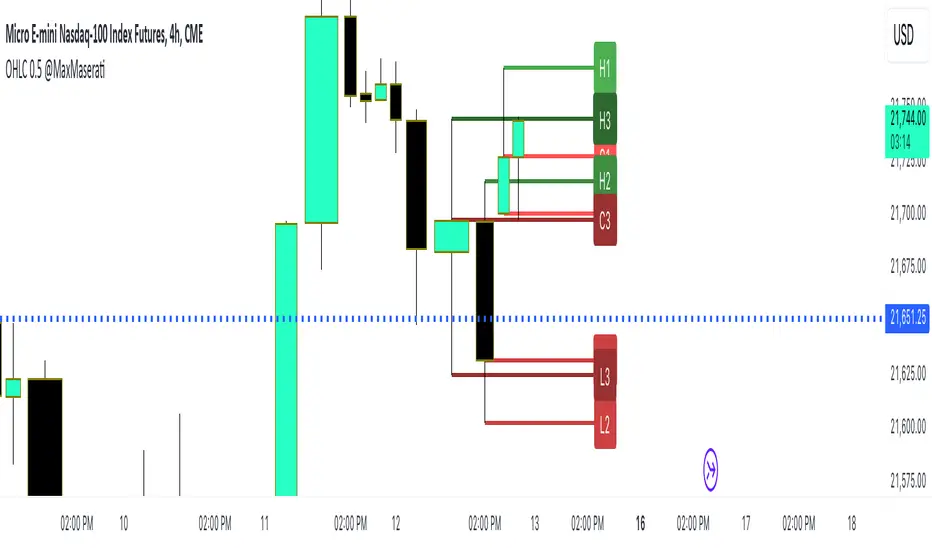
OHLC Lines + 50% of the previous candleThis indicator automatically put a straight line on the High, Low, Close, and Open and calculates the Consequent Encroachment or the midline (50%) of the previous candle. The calculation for the midline can be based on either the High and Low or the Open and Close. The option to disable OHLC labels is available. The indicator displays the premium and discount areas of the previous candle, allowing for a strategy of buying on discount and selling on premium based on each candle stick.
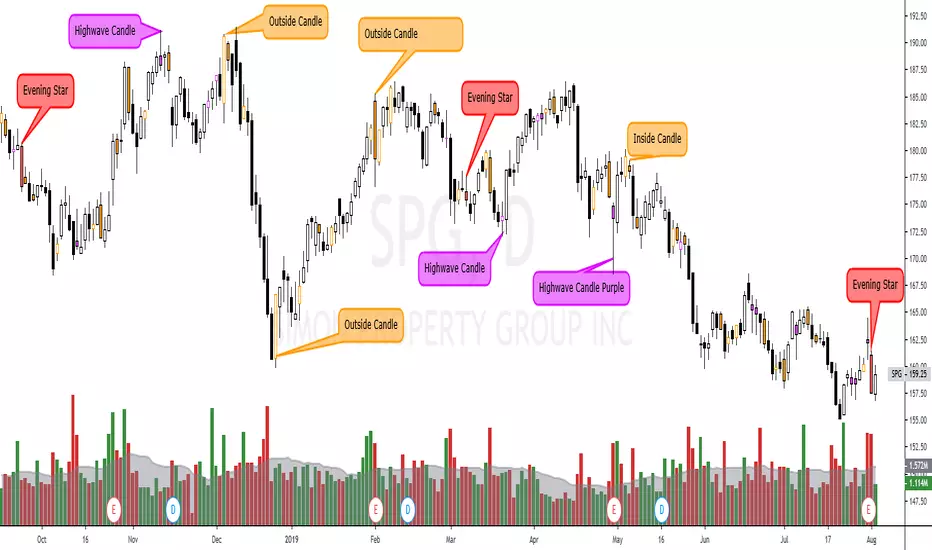
Custom Candle color Inside/Outside candles, Highwave, Star Patt.This script paints outside and inside candles (orange), highwave candles (purple, and morning and evening star patterns (red). You should use hollow candle sticks with this script. I use it to find change in trends or where indecision is present.
Indecisive candlesIndecisive candles are candles with <20% of the candle being the candle body and 80% of the candle being wicks.
Big Candles v1This script simply takes a user-defined bar height number (variable barHeight) to find large candles. Automatically colors large bullish and bearish candles green or red, respectively. The barHeight can be modified to fit your needs.
Use this in a variety of ways:
- Confirm breakouts of support / resistance
- Identify new trends
Daily + 4H Candle with Labels finndaily and 4hr candle, shows the exact and current candles and updates whenever they do on the chart

alfaza candleblue candle
it shows the candle in blue color that comply with the conditions of high volume more than 4 pervious candles and it comes after price drop

Hap Mum Formasyonu - Candlestick PatternsThis indicator is a comprehensive tool that automatically scans for popular Candlestick Patterns on symbols you select and displays the results in a table on your screen.
Unlike standard scanners, this script allows you to create 10 Different Custom Watchlists. You can add up to 20 symbols to each list and switch between lists via the settings menu to see instant scanning results.
🚀 Key Features
10 Custom Lists: Organize your portfolio into groups (e.g., Indices, Crypto, Forex). Each list holds 20 symbols.
Trend Filter: Patterns are validated based on the trend direction, not just the candle shape. Bullish patterns are searched in downtrends, and Bearish patterns in uptrends.
Option 1: Is Price above/below SMA 50?
Option 2: Price relative to SMA 50 & SMA 200 alignment.
Visual Table: Bullish signals are shown in the Green box, Bearish signals in the Red box.
Flexible Settings: You can toggle specific patterns on/off and change the trend detection method.
📊 Supported Patterns & Legend
Abbreviations used in the dashboard:
Bullish Signals:
DD: Dragonfly Doji
H: Hammer
IH: Inverted Hammer
EB: Engulfing Bullish
MS: Morning Star
MDS: Morning Doji Star
P: Piercing Line
HB: Harami Bullish
TWS: Three White Soldiers
Bearish Signals:
GD: Gravestone Doji
HM: Hanging Man
SS: Shooting Star
EB: Engulfing Bearish
ES: Evening Star
EDS: Evening Doji Star
HB: Harami Bearish
TBC: Three Black Crows
DCC: Dark Cloud Cover
🛠 How to Use?
Add the indicator to your chart.
Open Settings.
Select a list from "Which List Do You Want to Scan?" (e.g., List 1).
Enter your ticker symbols into the corresponding group fields below (LIST 1, LIST 2...).
Click OK, and the table will update with the signals.
Disclaimer: This tool is for educational purposes only. Candlestick patterns do not guarantee future market movements. Always manage your risk.

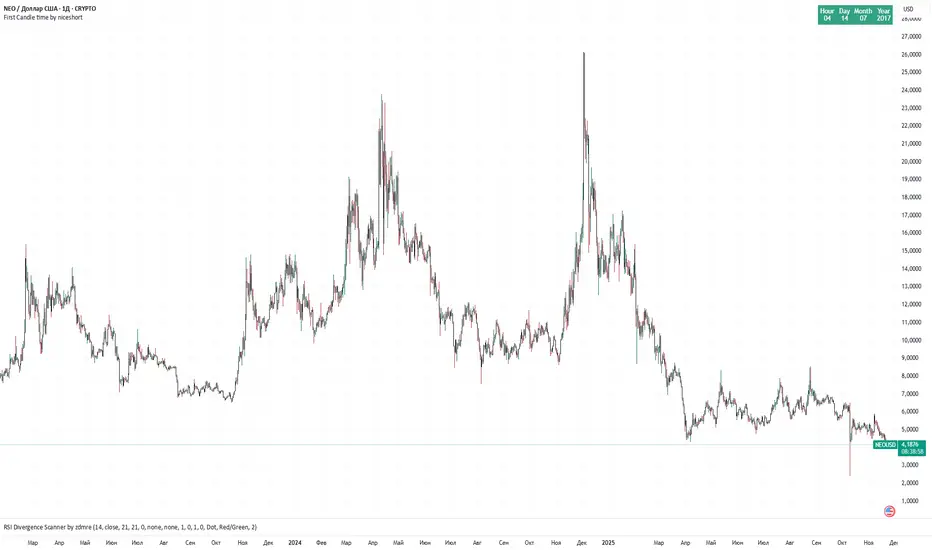
first candle time 60 min by niceshort with chatgpttime and date first 1H candle.
Displaying the date and time of the first candle can be useful when searching for a chart with the longest history for a given asset.