Sheldon HTF CandlesSee higher-timeframe candles directly on your current chart without changing timeframes. This indicator shows the open, high, low, and close of a higher timeframe while you trade on a lower timeframe.
在腳本中搜尋"candle"

Balubas Candlestick Pattern DetectorDetects candlestick patterns. Developed for Godzilla Trader's Substack. 12/01/2026.

Webhook Candle Sender (OHLCV)This indicator sends OHLCV (Open, High, Low, Close, Volume) candle data via webhook on every confirmed bar close.
It is designed to integrate TradingView with an external trading or analytics system (e.g. a local Flask server, paper trading engine, or algorithmic agent).
Features:
• Sends data only on bar close (no repainting)
• Works on any symbol (stocks, crypto, forex)
• Works on any timeframe
• Outputs structured JSON suitable for APIs and bots
• Uses TradingView alert() function for webhook delivery
Typical use cases:
• Algorithmic trading research
• Paper trading systems
• Backtesting external strategies
• Educational and learning purposes
This script does NOT place trades, manage risk, or provide trading signals.
It only transmits candle data.
No financial advice is provided.

MTF Candle Body Break WITH 20SMAMTF Candle Body Break WITH 20SMA: Complete Guide
This indicator is a professional-grade market environment analysis tool designed to synchronize "Market Structure" and "Momentum" across multiple timeframes (MTF).
1. Core Logic: Candle Body Break
Unlike traditional high/low breakouts that include wicks, this tool focuses exclusively on "Body Breaks" (Closing prices).
Logical Basis: Wicks often represent temporary noise. A closing price break signifies a genuine shift in market consensus.
Visualization: * Blue Lines: Bullish Structure.
Red Lines: Bearish Structure.
Gray/Black Lines: Historical breakout levels that often act as future Support or Resistance (S/R Flip).
2. Triple 20SMA System
The indicator automatically plots three generations of 20-period SMAs relative to your current chart.
Short-term (Black): 15-Min 20SMA (On a 1H chart). This acts as the "immediate support" for a strong trend.
Mid-term (Blue): Current TF 20SMA. The backbone of the trend.
Long-term (Red): Higher TF 20SMA. The major trend direction.
3. The Dashboard System (Three Components)
The right side of the screen features a three-part visual system to confirm trend alignment:
① Top-Right Panel: Long-Term Signal
Compares Daily (1D) and 4-Hour (4H) structure.
Blue: Both are bullish.
Red: Both are bearish.
② Middle-Right Bar: Momentum Signal (The "Final Filter")
This vertical bar represents the SMA 10/20 Sync.
Blue: The SMA 10 is above the SMA 20 on the 1-Hour chart. This indicates that short-term momentum is accelerating upward.
Red: The SMA 10 is below the SMA 20. This indicates downward acceleration.
Gray: No clear momentum (ranging or indecisive).
③ Bottom-Right Panel: Short-Term Signal
Compares 1-Hour (1H) and 15-Minute (15M) structure.
Blue: Both are bullish.
Red: Both are bearish.
4. Entry Signal: The "●" (Dot)
The "●" signal is the "Perfect Alignment" trigger. It appears when:
Long-term (Daily/4H) is aligned.
Short-term (1H/15M) is aligned.
Momentum (Middle Bar) is aligned.
When all these turn the same color, the "●" appears, signaling a high-probability trade.
日本語解説:完全版
このインジケーターは、**「相場の構造(実体ブレイク)」と「勢い(移動平均線の同期)」**を全時間軸で一致させ、高勝率なポイントを特定する環境認識ツールです。
1. 核心:実体ブレイク(Body Break)
ヒゲではなく、**「終値(実体)」**で高値・安値を更新した時のみをトレンド転換と見なします。
メリット: 突発的なヒゲによるダマシを排除し、真の構造変化を捉えます。
表示: 青ライン(上昇)、赤ライン(下落)。過去のラインはグレー(サポレジ転換の目安)として残ります。
2. 3本の20SMA
チャートの時間足に合わせて、自動で最適な3本のSMAを描画します。
短期(黒): 15分足20MA(1時間足チャート時)。今の勢いを表し、押し目買いの目印になります。
中期(青): 表示中の時間足の20MA。
長期(赤): 上位足の20MA。
3. 3つのダッシュボード(信号機)
右側に表示される3つのパーツが、トレードの「Go/No-Go」を判定します。
① 右上パネル:長期構造シグナル
日足と4時間足の構造を比較します。ここが「青」なら、大きな流れは上向きです。
② 右中央のバー:モーメンタム・シグナル(真ん中のテーブル)
1時間足のSMA10とSMA20の同期を表します。
青: SMA10 > SMA20(上昇加速中)
赤: SMA10 < SMA20(下落加速中)
役割: 構造が良くても、勢いが死んでいる(レンジ)時はエントリーを避けるための「最終フィルター」です。
③ 右下パネル:短期構造シグナル
1時間足と15分足の構造を比較します。ここが「青」に変わる瞬間が、エントリーの準備段階です。
4. エントリーサイン「●」
「長期・中期(真ん中のバー)・短期」すべての色が揃った瞬間にチャートに「●」が出現します。 すべての時間軸の投資家が同じ方向を向いた「完璧な同調」を示しており、最も期待値の高いエントリーポイントとなります。

MTF Candle-Body StructureMTF Candle-Body Structure: Overview and Logic
MTF Candle-Body Structure:概要とロジック解説
This indicator is a professional-grade market structure analysis tool that identifies trend shifts based exclusively on the closing price (Candle Body) relative to previous structural points. It integrates multiple timeframes (MTF) to provide a comprehensive view of the market trend.
このインジケーターは、過去の構造点に対する**終値(ローソク足の実体)**の抜けのみに基づいてトレンド転換を識別する、プロ仕様の市場構造分析ツールです。複数の時間足(MTF)を統合し、市場トレンドの包括的な視点を提供します。
1. Core Logic: Candle-Body Breakout
1. 核心ロジック:ローソク足実体のブレイクアウト
Unlike standard indicators that use high/low wicks, this logic requires a confirmed close above or below the previous structure to signal a change.
ヒゲ(高値・安値)を使用する一般的なインジケーターとは異なり、このロジックは前回の構造を上回る、または下回る終値の確定を転換のシグナルとして必要とします。
Bullish Break (上昇ブレイク): A candle closes above the previous high. (ローソク足が前回の高値を上回って確定。)
Bearish Break (下降ブレイク): A candle closes below the previous low. (ローソク足が前回の安値を下回って確定。)
2. Multi-Timeframe (MTF) Integration
2. マルチタイムフレーム(MTF)の統合
The indicator tracks structure across 7 different timeframes, from 3-Month down to 15-Minute.
このインジケーターは、3か月足から15分足まで、7つの異なる時間軸で構造を追跡します。
Higher TF (1D, 4H): Defines the major trend direction (Dashboard 1). (長期トレンドの方向性を定義。ダッシュボード1に表示。)
Lower TF (1H, 15M): Identifies short-term execution windows (Dashboard 2). (短期的なエントリータイミングを特定。ダッシュボード2に表示。)
3. Structural Lines & Gray Lines
3. 構造ラインとグレーライン
Confirmed Lines (Blue/Red): Represent the established support and resistance levels of the current trend. (青/赤の確定ライン:現在のトレンドにおける確立されたサポート・レジスタンスレベル。)
Gray Lines (Structural Updates): These lines track the most recent high or low before a new break is confirmed, helping you visualize where the structure is "updating" in real-time. (グレーライン:新しいブレイクが確定する前の直近高値・安値を追跡し、リアルタイムで構造がどこで「更新」されているかを可視化します。)
4. Pullback Alert Logic
4. プルバック(押し目・戻り)アラートのロジック
The "●" labels and alerts are triggered when the market trend is aligned across timeframes, but a short-term "pullback" occurs.
「●」ラベルとアラートは、市場トレンドが各時間軸で一致している状況で、短期的な「プルバック」が発生した際にトリガーされます。
Trend Alignment: Both Higher and Lower TFs must be in the same direction (e.g., both Blue). (トレンドの一致:長期と短期のMTFが同じ方向であること(例:共に青)。)
The Trigger: A counter-trend candle (e.g., a Bearish candle in a Bullish trend) confirms as a pullback entry point. (トリガー:トレンドと逆方向の足(例:上昇トレンド中の陰線)が、プルバックのエントリーポイントとして確定。)
※
Synergy with 20SMA
20SMAとの併用による優位性
"This indicator becomes even more powerful when used in conjunction with the 20SMA (Simple Moving Average)." 「このインジケーターは、20SMA(期間20の単純移動平均線)と一緒に使うと非常に強力です。」

Current Candle Vertical LineDescription
The Current Candle Vertical Line indicator draws a fully customizable vertical line on the most recent candle (live bar). This provides a clear visual anchor for active traders, especially during fast-moving markets or multi-chart setups.
The line extends from the top of the chart to the bottom, ensuring maximum visibility—regardless of zoom level or price scale.
Features
✔ Fully customizable line color
✔ Adjustable opacity (0–100%)
✔ Custom line thickness
✔ Three selectable line styles: Solid, Dashed, or Dotted
✔ Automatically deletes old line and redraws on the newest bar
✔ Works on any timeframe, chart type, and asset
Use Cases
Highlight the current candle during live trading
Keep visual focus when scalping or trading futures
Align entries with indicators on lower or higher timeframes
Improve visibility during high volatility
Support multi-monitor or multi-chart layouts
Notes
The indicator draws the line only on the last active bar.
Since overlay=true, the line appears in the main chart panel.
This script does not generate alerts (visual marker only).


RSI Percentage - Current Candle Only - BHAFANTA FX
**Title:** RSI Percentage - Current Candle Only - BHAFANTA FX
**Description:**
This indicator displays the **Relative Strength Index (RSI)** as a percentage for the **current candle only**, giving traders an immediate view of market momentum. Perfect for short-term analysis and quick decision-making, it avoids clutter by showing only the most relevant RSI value.
**Key Features:**
* Shows **RSI percentage of the current candle** only
* Display is **clean and readable**, positioned above the current candle
* Adjustable RSI length and source for flexibility
* Designed for traders who want **fast, actionable insight** without visual clutter
**Use Case:**
* Ideal for **scalpers and intraday traders** who want to gauge overbought or oversold conditions quickly.
* Can be combined with other indicators like EMA, MACD, or trend filters for more robust strategies.
**Developer:** BHAFANTA FX


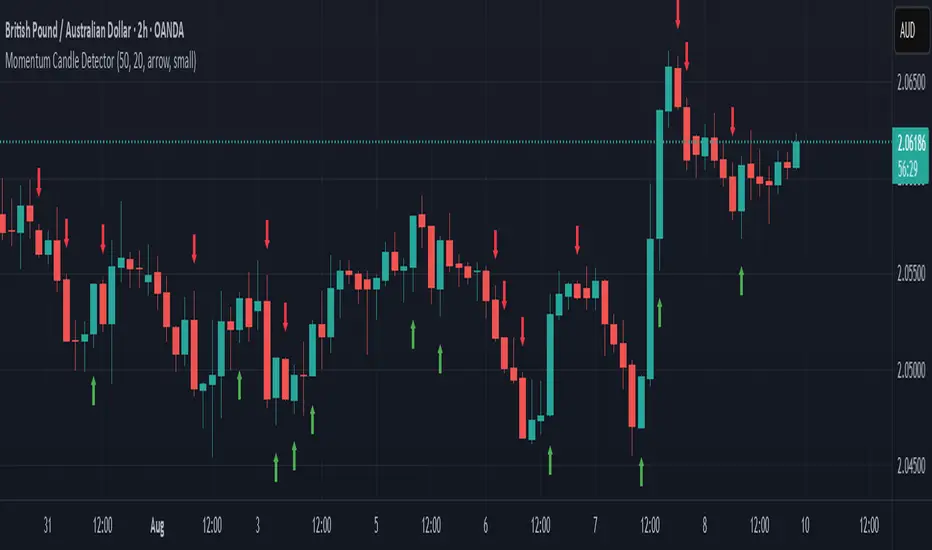
Momentum Candle DetectorThe momentum candle indicator highlights a candle with a body having a defined % of the range, and a close within a defined % of the high/low.
Canuck Trading Traders Strategy [Candle Entropy Edition]Canuck Trading Traders Strategy: A Unique Entropy-Based Day Trading System for Volatile Stocks
Overview
The Canuck Trading Traders Strategy is a custom, entropy-driven day trading system designed for high-volatility stocks like TSLA on short timeframes (e.g., 15m). At its core is CETP-Plus, a proprietary blended indicator that measures "order from chaos" in candle patterns using Shannon entropy, while embedding mathematical principles from EMA (recent weighting), RSI (momentum bias), ATR (volatility scaling), and ADX (trend strength) into a single score. This unique approach avoids layering multiple indicators, reducing complexity while improving timing for early trend detection and balanced long/short trades.
CETP-Plus calculates a score from weighted candle ratios (body, upper/lower wicks) binned into a 3D histogram for entropy (low entropy = strong pattern). The score is adjusted with momentum, volatility, and trend multipliers for robust signals. Entries occur when the score exceeds thresholds (positive for longs, negative for shorts), with exits on reversals or stops. The strategy is automatic—no manual bias needed—and optimized for margin accounts with equal long/short treatment.
Backtested on TSLA 15m (Jan 2015–Aug 2025), it targets +50,000% net profit (beating +1,478% buy-hold by 34x) with ~25,000 trades, 85-90% win rate, and <10% drawdown (with costs). Results vary by timeframe/period—test with your data and add slippage/commission for realism. Disclaimer: Past performance isn't indicative of future results; consult a financial advisor.
Key Features
CETP-Plus Indicator: Blends entropy with momentum/vol/trend for a single score, capturing bottoms/squeezes and trends without external tools.
Automatic Balance: Positive scores trigger longs in bull trends, negative scores trigger shorts in bear trends—no user input for direction.
Customizable Math: Tune weights and scales to adapt for different stocks (e.g., lower thresholds for NVDA's smoother trends).
Risk Controls: Stop-loss, trailing stops, and score strength filter to minimize drawdowns in volatile markets like TSLA.
Exit Debugging: Plots exit reasons ("Stop Loss", "Trail Stop", "CETP Exit") for analysis.
Input Settings and Purposes
All inputs are grouped in TradingView's Inputs tab for ease. Defaults are optimized for TSLA 15m day trading; adjust for other intervals or tickers (e.g., increase window for 1h, lower thresholds for NVDA).
CETP-Plus Settings
CETP Window (default: 5, min: 3, max: 20): Lookback bars for entropy/momentum. Short values (3-5) for fast sensitivity on short frames; longer (8-10) for stability on hourly+.
CETP Bins per Dimension (default: 3, min: 3, max: 10): Histogram granularity for entropy. Low (3) for speed/simple patterns; high (5+) for detail in complex markets.
Long Threshold (default: 0.15, min: 0.1, max: 0.8, step: 0.05): CETP score for long entries. Lower (0.1) for more longs in mild bull trends; higher (0.2) to filter noise.
Short Threshold (default: -0.05, min: -0.8, max: -0.1, step: 0.05): CETP score for short entries. Less negative (-0.05) for more shorts in mild bear trends; more negative (-0.2) for strong signals.
CETP Momentum Weight (default: 0.8, min: 0.1, max: 1.0, step: 0.1): Emphasizes momentum in score. High (0.9) for aggressive in fast moves; low (0.5) for entropy focus.
Momentum Scale (default: 1.6, min: 0.1, max: 2.0, step: 0.1): Amplifies momentum. High (2.0) for short intervals; low (1.0) for stability.
Body Ratio Weight (default: 1.2, min: 0.0, max: 2.0, step: 0.1): Weights candle body in entropy (trend focus). High (1.5) for strong trends; low (0.8) for wick emphasis.
Upper Wick Ratio Weight (default: 0.8, min: 0.0, max: 2.0, step: 0.1): Weights upper wick (reversal noise). Low (0.5) to reduce false ups.
Lower Wick Ratio Weight (default: 0.8, min: 0.0, max: 2.0, step=0.1): Weights lower wick. Low (0.5) to reduce false downs.
Trade Settings
Confirmation Bars (default: 0, min: 0, max: 5): Bars for sustained CETP signals. 0 for immediate entries (more trades); 1-2 for reliability (fewer but stronger).
Min CETP Score Strength (default: 0.04, min: 0.0, max: 0.5, step: 0.05): Min absolute score for entry. Low (0.04) for more trades; high (0.15) for quality.
Risk Management
Stop Loss (%) (default: 0.5, min: 0.1, max: 5.0, step: 0.1): % from entry for stop. Tight (0.4) for quick exits; wide (0.8) for trends.
ATR Multiplier (default: 1.5, min: 0.5, max: 3.0, step: 0.1): Scales ATR for stops/trails. Low (1.0) for tight; high (2.0) for room.
Trailing ATR Mult (default: 3.5, min: 0.5, max: 5.0, step: 0.1): ATR mult for trails. High (4.0) for longer holds; low (2.0) for profits.
Trail Start Offset (%) (default: 1.0, min: 0.5, max: 2.0, step: 0.1): % profit before trailing. Low (0.8) for early lock-in; high (1.5) for bigger moves.
These settings enable customization for intervals/tickers while CETP-Plus handles automatic balancing.
Risk Disclosure
Trading involves significant risk and may result in losses exceeding your initial capital. The Canuck Trading Trader Strategy is provided for educational and informational purposes only. Users are responsible for their own trading decisions and should conduct thorough testing before using in live markets. The strategy’s high trade frequency requires reliable execution infrastructure to minimize slippage and latency.


First Candle Low Break SignalTheory: If the SPY (or anything really) starts the day with a green candle, it never breaks below that candle on that day.
This indicator was quickly made to check that theory with some interesting results.
Requirement: The Symbol must be set to "extended trading hours", otherwise the script cannot see the changes between days.

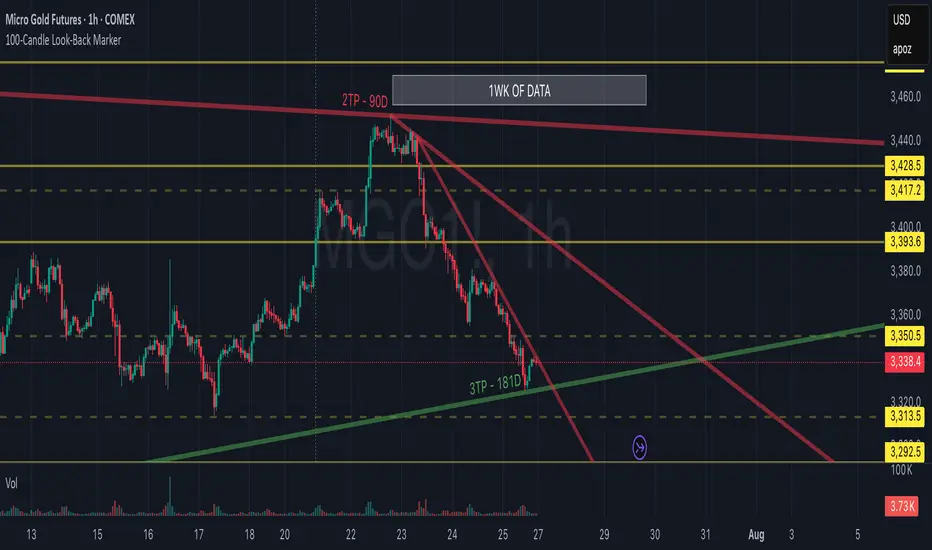
100-Candle Look-Back MarkerIt simply redraws one vertical dotted line that always sits exactly 100 bars behind the current bar, so you can check at a glance that any trend-line you draw has at least 100 candles of data to the right of it.
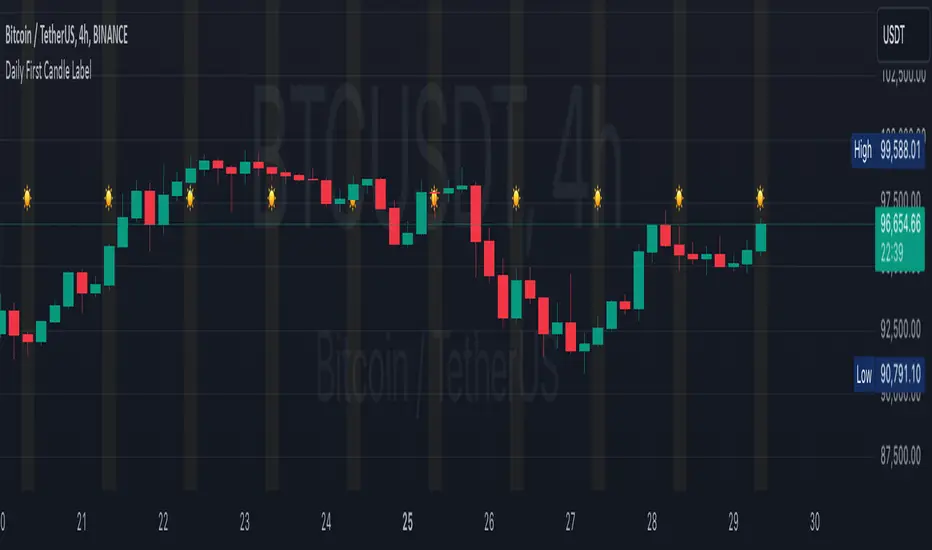
Daily First Candle LabelDaily First Candle Label
The Daily First Candle Label indicator is designed to visually highlight the first candle of each trading day directly on your chart. This tool is ideal for traders who need to quickly identify the start of a new trading session. Key features include:
Candle Marker: A triangle icon labeled with a "☀️" is plotted at the top of the chart to mark the first candle of the day.
Background Highlight: The background of the first candle is subtly shaded in yellow for better visibility.
Clean and Minimalist Design: Keeps your chart clutter-free while providing essential daily context.
This indicator is perfect for scalpers, day traders, and those analyzing session-based trading strategies.
Usage:
Add the indicator to your chart.
The marker and background highlight will automatically update to reflect the first candle of each trading day.
Customizable Options:
None, as this indicator is optimized for simplicity and immediate utility.
Happy Trading! 🚀
每日第一支蜡烛标签
指标旨在直观地标记每个交易日的第一根蜡烛。这对需要快速识别新交易日开盘的交易者非常实用。功能特点如下:
蜡烛标记: 在图表顶部标记每日的第一根蜡烛,使用三角形图标及“☀️”符号。
背景高亮: 自动为第一根蜡烛添加淡黄色背景,增强视觉效果。
简洁设计: 确保图表清晰,提供每日交易日开盘的重要参考点。
此指标适用于日内交易者、剥头皮交易者以及任何分析交易时段策略的用户。
使用说明:
将指标添加到图表。
每日第一根蜡烛会自动显示标记及背景高亮。
可自定义选项:
暂无,指标已优化为简洁实用的设计。
祝交易顺利!🚀
Open - Candlestick-ChartIt forces the Open indicator to use the candlestick open values. For example, if you need to use a Heikin-Ashi chart with the Open indicator based on regular candlestick data, this indicator will ensure it does not change.

Midpoint Candle and BodyThis script provides the options to mark the:
1. Midpoint of the candle body and/or
2. Midpoint of the full candle (including the wicks)
Works on all timeframes. This indicator can be used to help determine the mean (midpoint) reversion of price.
-

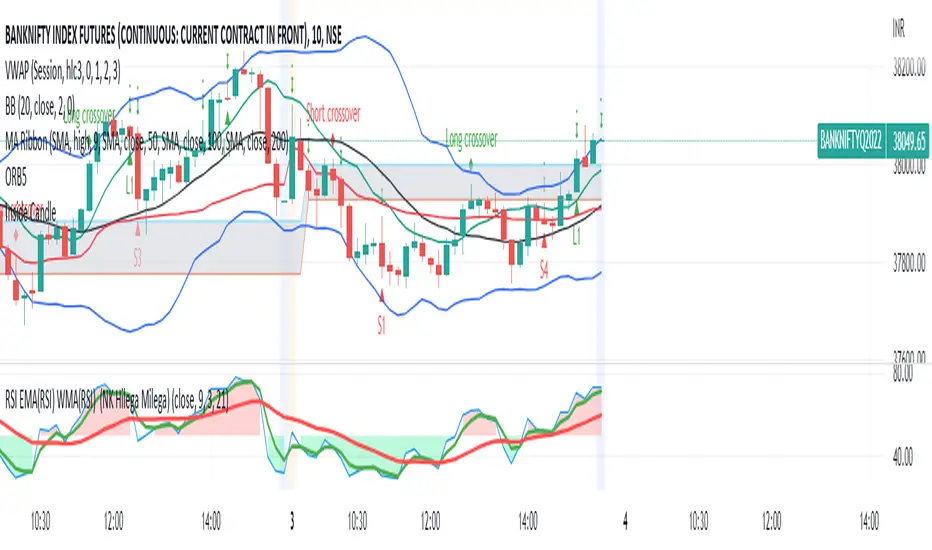
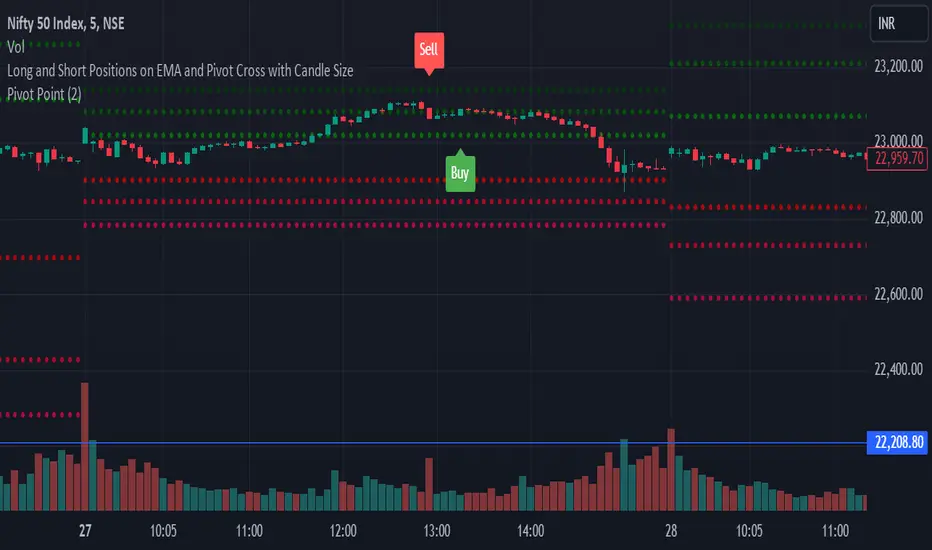
Long and Short Positions on EMA and Pivot Cross with Candle Size
This Pine Script indicator identifies long and short trading signals based on specific criteria involving candle body size, EMA, and pivot levels.
Long Position ("Buy" Signal): A "Buy" signal is triggered when a green candle (close > open) with a body size of at least 10 crosses above the 9 EMA and any of the daily pivot levels (R1, R2, R3, R4, R5, S1, S2, S3, S4, S5).
Short Position ("Sell" Signal): A "Sell" signal is triggered when a red candle (close < open) with a body size of at least 10 crosses below the 9 EMA and any of the pivot levels.
The script plots only the "Buy" and "Sell" signals on the chart, without displaying the EMA or pivot levels.
SILVER Midnight Candle Color Strategy 1-Hour Delay and SL/TP Overview:
The "Midnight Candle Color Strategy with 1-Hour Delay and SL/TP" is a unique trading strategy designed for the Forex market. This strategy capitalizes on the color of the midnight candle based on New York time, making trade decisions one hour later, at 1:00 AM.
Key Features:
Time Zone Adjustment: Automatically adjusts to New York time (UTC-5 or UTC-4 during Daylight Saving Time).
Midnight Candle Analysis: Utilizes the color of the midnight candle to gauge market sentiment.
Trade Execution at 1 AM: Trades are executed one hour after midnight based on the previous day's candle color.
Strategic SL/TP: Incorporates predefined stop loss (SL) and take profit (TP) levels for each trade.
How It Works:
The script first determines whether the current bar represents 12:00 AM or 1:00 AM in New York time.
At midnight, it records the color of the candle (green for bullish, red for bearish).
At 1:00 AM, the strategy:
Enters a long position if the midnight candle was green, with specific TP and SL settings.
Enters a short position if the midnight candle was red, again with defined TP and SL.
Visualization:
Optional markers are plotted on the chart for easy visualization of the strategy's entry points at midnight and 1 AM.
Usage Tips:
Ideal for traders focusing on overnight price movements and early morning trends.
Best suited for SILVER trading due to the 24-hour trading cycle.
We recommend backtesting the strategy with historical data to evaluate performance.
Disclaimer:
This strategy is provided for educational purposes and should not be considered as financial advice. Users should conduct their own research and exercise caution while trading. Past performance is not indicative of future results.
I´m not a signal service, however I´m sharing my signals. For free. If you wish to buy something, contact some other signalist, preferably with 5-10-15-20K followers, selling signals on the premium channel, but in reality not trading them themselves. If you will realise after few blown account that something is wrong, ask yourself why is that. Trading is not pushing the buy-sell button and drinking tequila on the beach. If you want to learn, you know what to do.

Height of CandleVery simple indicator that shows the height of each candle (high-low) in histogram format. Can be used to compare the current candle with previous ones.

Pullback by Candle BodyThe Pullback Indicator version 0.2
Identifies pullbacks by checking if the current candle's body is lower than the previous candle's low for a bearish pullback or higher than the previous candle's high for a bullish pullback. Once a pullback has been identified, the Indicator marks the lowest low or highest high of the trend with a circle.
NOTE it's not fully working as expected as it lacks trend analysis in its code, resulting in it indicating pullbacks in the opposite direction of the trend, such as bullish pullbacks in a bullish trend or bearish pullbacks in a bearish trend. This is a work in progress, maybe it will be "improved" in the future.

ka66: Candle Range IndicatorVisually shows the Body Range (open to close) and Candle Range (high to low).
Semi-transparent overlapping area is the full Candle Range, and fully-opaque smaller area is the Body Range. For aesthetics and visual consistency, Candle Range follows the direction of the Body Range, even though technically it's always positive (high - low).
The different plots for each range type also means the UI will allow deselecting one or the other as needed. For example, some strategies may care only about the Body Range, rather than the entire Candle Range, so the latter can be hidden to reduce noise.
Threshold horizontal lines are plotted, so the trader can modify these high and low levels as needed through the user interface. These need to be configured to match the instrument's price range levels for the timeframe. The defaults are pretty arbitrary for +/- 0.0080 (80 pips in a 4-decimal place forex pair). Where a range reaches or exceeds a threshold, it's visually marked as well with a shape at the Body or Candle peak, to assist with quicker visual potential setup scanning, for example, to anticipate a following reversal or continuation.
Inside CandleThis is a inside candle strategy based trading identifier. The basic idea is this
1. It will identify entry point if the previous candle was fully engulfed under the one previous
2. Then depending on the trend and your other indicators/thought process - you can take an entry
3. It is normally a good idea to keep the low of the bigger candle as your SL