Candle VolumeThis indicator gives gives candle volume represented in X.Y format for simplicity.
100% = 1.0
20% = 0.2
Anything 10X is represented by an arrow up or down based on candle price delta open to close.
By default, a 500 candle lookback of volume is used excluding exteem outliers of 50.
You can adjust these in settings.
在腳本中搜尋"candle"
Candle Flip System - CFSCandle Flip System - CFS
The Candle Flip System checklist table is a tool designed for traders seeking a structured approach to decision-making. This indicator provides a visual checklist to validate critical conditions before entering a trade. It includes:
1. Previous D1 Candle Analysis:
Displays whether the previous daily candle closed bullish or bearish, indicated by intuitive markers.
2. 4-Hour Alignment Check:
Confirms if the bias of the previous 4-hour candle aligns with the previous daily candle's bias.
Outputs "YES" in green for alignment or "NO" in red for misalignment.
This indicator simplifies multi-timeframe analysis and ensures a systematic evaluation of key trading conditions, enabling traders to make more confident and disciplined decisions.
How to Use:
1. Apply the indicator to your chart.
2. Observe the table displayed in the top-right corner.
3. Use the information to validate your trading strategy before entering a trade.

Candle Closing Strength Indicator (CCS)This indicator measures and displays the closing strength of each candle relative to its range.
It assigns a value from 0 to 100, where
- 0 indicates a close at the candle's low,
- 100 indicates a close at the high, and
- 50 represents a close at the midpoint.
The strength is shown as a number on each candle, color-coded green for values 50 and above (bullish) and red for values below 50 (bearish). This visual representation helps traders quickly assess the strength and direction of price movements across different timeframes.
This is only the price action strength. Further strength can be verified with volume.

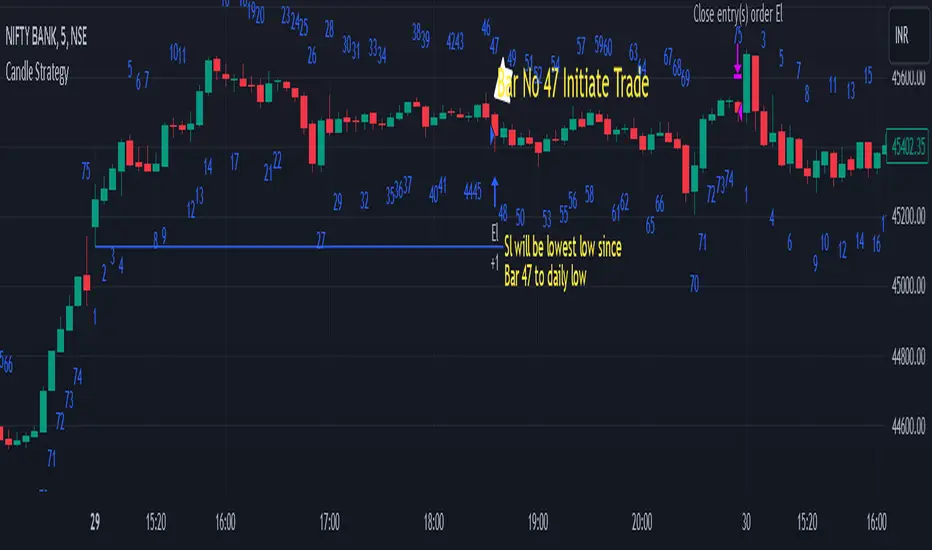
Candle StrategyThis strategy is based candle count number also strategy analysis -
Rules for buy-
1) choose Candle Number(Ex.-47) For Trade
2) Trade Sell if price is above high of day 1st candle that mean direction is upside
3) We are taking stop loss on lowest low of candle since day first candle to trade no.
4) close Trade at last bar of the day
5) Trader Can Choose Trade Direction From input
Rules for Sell-
1) Choose Candle Number(Ex.-47) For Trade
2) Trade Sell if price is below low of day 1st candle that mean direction is downside
3) We are taking stop loss on highest of candle since day first candle to trade no.
4) close Trade at last bar of the day
5) Trader Can Choose Trade Direction From input
Note - this strategy can be also use for static to understand which candle will make low/high of the day high chance Example in bank nifty 5 minutes chart candle no 47 have highest trade
opportunity appear on long side ...this data is small based on 5000 previous bar ...
Disclaimer: market involves significant risks, including complete possible loss of funds. Consequently trading is not suitable for all investors and traders. By increasing leverage risk increases as well.With the demo account you can test any trading strategies you wish in a risk-free environment. Please bear in mind that the results of the transactions of the practice account are virtual, and do not reflect any real profit or loss or a real trading environment, whereas market conditions may affect both the quotation and execution
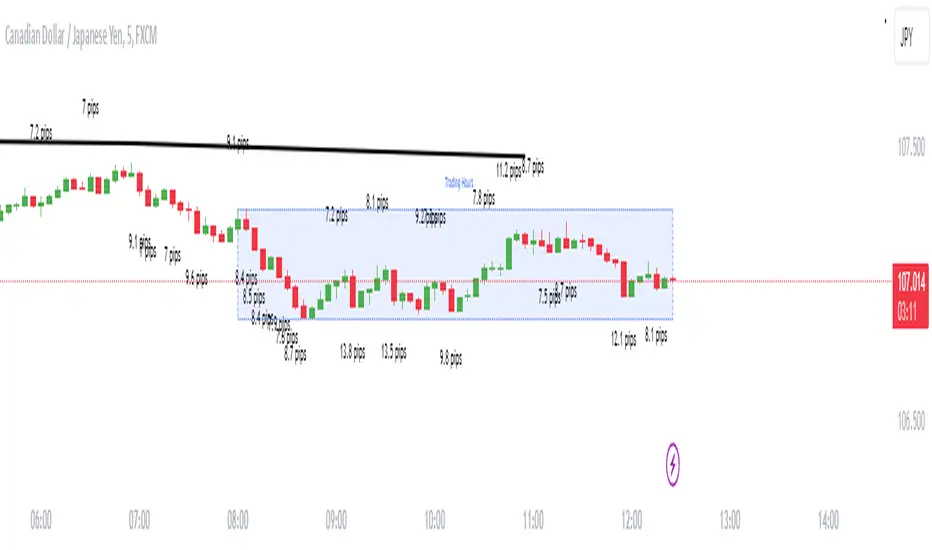
Candle size in pipsDescription
Enhance your trading strategy with precision using this script, designed to measure the range of a candle from wick to wick in pips. Whether you're implementing a specific pip requirement within a candle for your strategy, or simply seeking to better understand market dynamics, this tool provides valuable insights. The script is calculating the amount of pips between the high and the low then compares it to the minimal size you declared. If the amount of pips is more or equal to minimal size it will show the label.
Features
Alert Functionality: Opt to receive alerts by checking the checkbox (default: false).
Customizable Pip Threshold: Tailor the script to your needs by setting the minimum required pips to display on the screen (default: 12).
Different shape: circle, triangle up, triangle down, none
How to Use
Personalize your trading approach by integrating this script with your preferred strategy. For instance, in my strategy involving a 3M continuation, I leverage this tool to determine the pip count of the M15 candle before making entry decisions.
Note: Ensure you understand your strategy's requirements and adjust the script settings accordingly for optimal result s.
Feel free to reach out if you have any questions or require further assistance in maximizing the utility of this script.

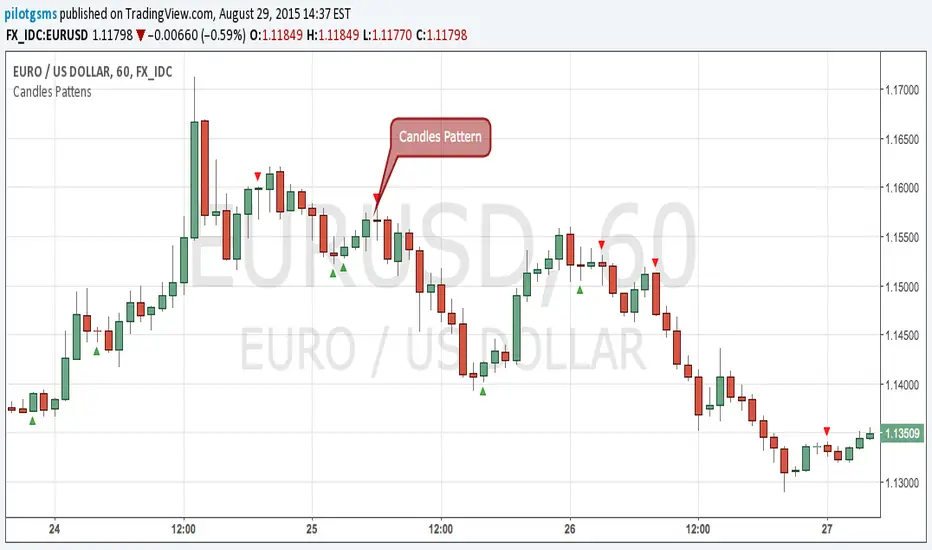
Candles Pattens (v. 1.14)This script sows you candlestick patterns in real-time.
At that moment script knows Bearish/Bullish Engulf and Doji Points.
You can recommend me which pattens you want to see in next version at comment section below
Candlestick Patterns Identified (updated 3/11/15)I decided to republish this one without the trend filter and with all the major symbols active. This will allow for all the patterns to show up.
Due to 15 different candlestick formations in this one script, it will be difficult to turn off the last few due to screen size. You can turn off individual patterns on the settings screen.
I have everything spelled out except the hammer and inverted hammer. They are "H" and "IH" respectively on the charts. They show up so often that they cluttered the charts.
The default script has: Doji, Evening Star, Morning Star, Shooting Star, Hammer, Inverted Hammer, Bearish Harami, Bullish Harami, Bearish Engulfing, Bullish Engulfing, Piercing Line, Bullish Belt, Bullish Kicker, Bearish Kicker, Hanging man, and Dark Cloud Cover. You can turn off what you don't like. The Piercing Line, Bullish Belt, and the Kickers will usually show up better in the daily charts.
I recommend watching videos with Stephen Bigalow to get a feel for how to trade these. You will want to add an 8 EMA to your chart with his setups. Enjoy.
If you want the old version: Take a look at the related ideas below.


Candle Body RatioThis indicator is designed to calculate the percentage of the upper wick, the body, and the lower wick of the candle over which your cursor is positioned.


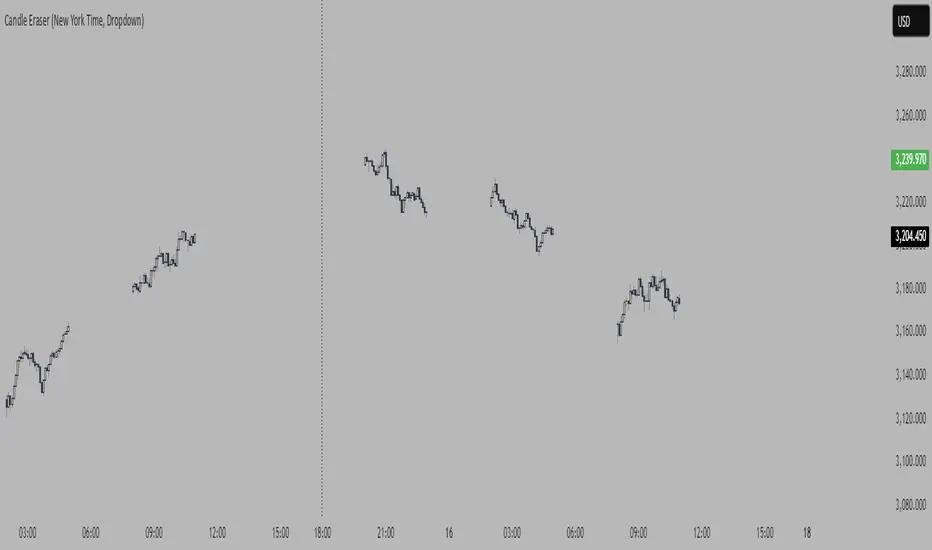
Candle Eraser (New York Time, Dropdown)If you want to focus on first 3 hours of Asia, London> and New York, inspired by Stacey Burke Trading 12 Candle Window Concept
- Set your time to UTC-4 New York


Candle Patterns StrategyThe script allows you to test popular candlestick patterns on various instruments and timeframes. In addition, you can configure risk management (if the value is zero, it means the function is disabled), and you can also specify the time of the trading session (for example, so that the positions are not transferred to the next day).
The author is grateful to JayRogers and Phi35, their code examples helped a lot in writing the strategy.

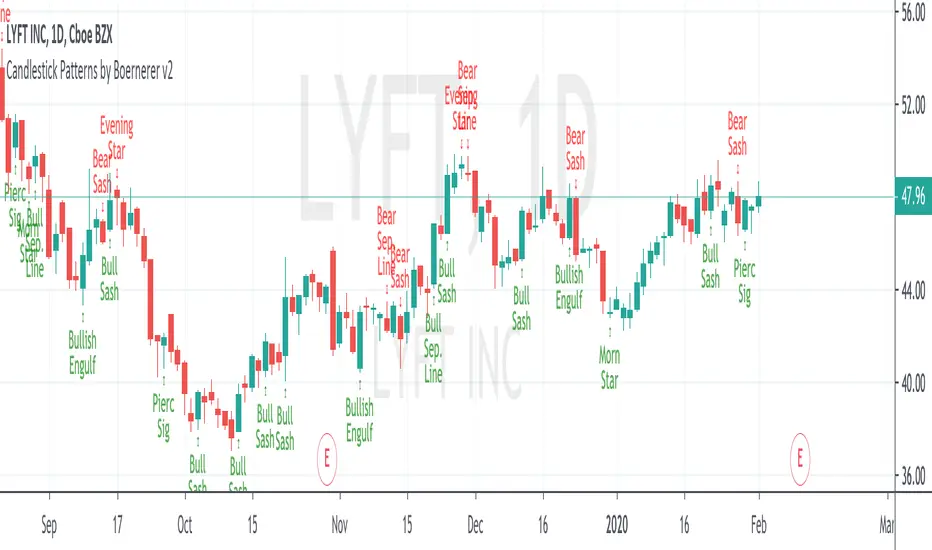
Candlestick Patterns by Boernerer v2New version 2 of my modifications of the original candlestick pattern script by Robert Waddell.
- Added window (= gaps) detection
- Added Bear/Bull Sash
- Added Bear/Bull Counter Attack
- Added Bear/Bull Seperating Line
- Modified candlestick ID code
- Added Lookback period instead of SMA (TLine) for trend detection
Candlestick Patterns With EMA and Stochastic6/11/15, Corrected barcolor errors.
Candlestick patterns identified and color coded according to position above or below 8EMA(TLine).
Special thanks to repo32, DavidR, and Chris Moody for coding ideas.
Bullish candlestick buy signals have a greater probability of success when Stochastics are oversold. Bearish ones have a
greater probability of success when overbought. Stack as many factors in your favor as possible. A candlestick signal by itself is of little value unless you apply additional information with it. An 8 EMA is coded also to help with buy/sell signals. Some of the videos by Steven Bigalow are on the Web to see how he uses it.
www.youtube.com
Regardless of systems and strategies used, make your second trade first: Know when you're going to exit. Risk management rules. Good luck and good trading.

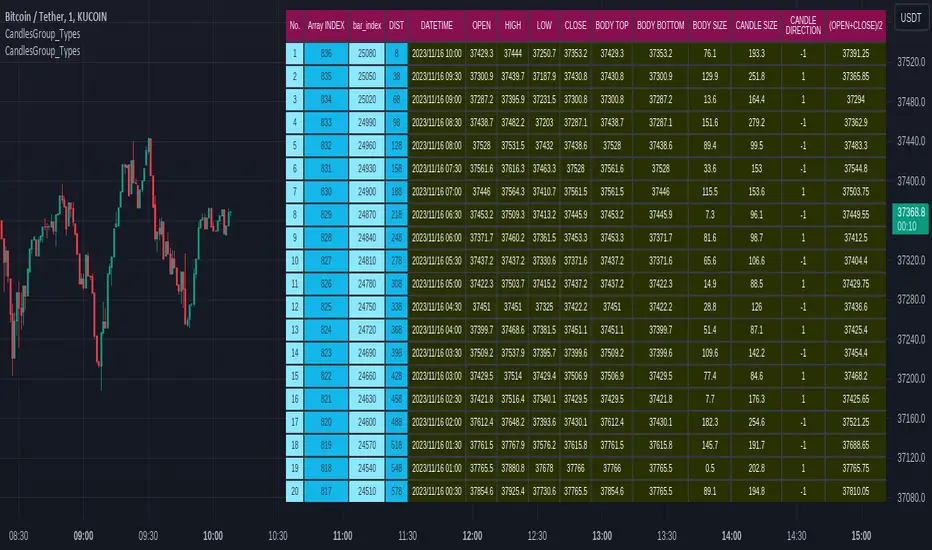
CandlesGroup_TypesLibrary "CandlesGroup_Types"
CandlesGroup Type allows you to efficiently store and access properties of all the candles in your chart.
You can easily manipulate large datasets, work with multiple timeframes, or analyze multiple symbols simultaneously. By encapsulating the properties of each candle within a CandlesGroup object, you gain a convenient and organized way to handle complex candlestick patterns and data.
For usage instructions and detailed examples, please refer to the comments and examples provided in the source code.
method init(_self)
Namespace types: CandlesGroup
Parameters:
_self (CandlesGroup)
method init(_self, propertyNames)
Namespace types: CandlesGroup
Parameters:
_self (CandlesGroup)
propertyNames (string )
method get(_self, key)
get values array from a given property name
Namespace types: CandlesGroup
Parameters:
_self (CandlesGroup) : : CandlesGroup object
key (string) : : key name of selected property. Default is "index"
Returns: values array
method size(_self)
get size of values array. By default it equals to current bar_index
Namespace types: CandlesGroup
Parameters:
_self (CandlesGroup) : : CandlesGroup object
Returns: size of values array
method push(_self, key, value)
push single value to specific property
Namespace types: CandlesGroup
Parameters:
_self (CandlesGroup) : : CandlesGroup object
key (string) : : key name of selected property
value (float) : : property value
Returns: CandlesGroup object
method push(_self, arr)
Namespace types: CandlesGroup
Parameters:
_self (CandlesGroup)
arr (float )
method populate(_self, ohlc)
populate ohlc to CandlesGroup
Namespace types: CandlesGroup
Parameters:
_self (CandlesGroup) : : CandlesGroup object
ohlc (float ) : : array of ohlc
Returns: CandlesGroup object
method populate(_self, values, propertiesNames)
populate values base on given properties Names
Namespace types: CandlesGroup
Parameters:
_self (CandlesGroup) : : CandlesGroup object
values (float ) : : array of property values
propertiesNames (string ) : : an array stores property names. Use as keys to get values
Returns: CandlesGroup object
method populate(_self)
populate values (default setup)
Namespace types: CandlesGroup
Parameters:
_self (CandlesGroup) : : CandlesGroup object
Returns: CandlesGroup object
method lookback(arr, bars_lookback)
get property value on previous candles. For current candle, use *.lookback()
Namespace types: float
Parameters:
arr (float ) : : array of selected property values
bars_lookback (int) : : number of candles lookback. 0 = current candle. Default is 0
Returns: single property value
method highest_within_bars(_self, hiSource, start, end, useIndex)
get the highest property value between specific candles
Namespace types: CandlesGroup
Parameters:
_self (CandlesGroup) : : CandlesGroup object
hiSource (string) : : key name of selected property
start (int) : : start bar for calculation. Default is candles lookback value from current candle. 'index' value is used if 'useIndex' = true
end (int) : : end bar for calculation. Default is candles lookback value from current candle. 'index' value is used if 'useIndex' = true. Default is 0
useIndex (bool) : : use index instead of lookback value. Default = false
Returns: the highest value within candles
method highest_within_bars(_self, returnWithIndex, hiSource, start, end, useIndex)
get the highest property value and bar index between specific candles
Namespace types: CandlesGroup
Parameters:
_self (CandlesGroup) : : CandlesGroup object
returnWithIndex (bool) : : the function only applicable when it is true
hiSource (string) : : key name of selected property
start (int) : : start bar for calculation. Default is candles lookback value from current candle. 'index' value is used if 'useIndex' = true
end (int) : : end bar for calculation. Default is candles lookback value from current candle. 'index' value is used if 'useIndex' = true. Default is 0
useIndex (bool) : : use index instead of lookback value. Default = false
Returns:
method highest_point_within_bars(_self, hiSource, start, end, useIndex)
get a Point object which contains highest property value between specific candles
Namespace types: CandlesGroup
Parameters:
_self (CandlesGroup) : : CandlesGroup object
hiSource (string) : : key name of selected property
start (int) : : start bar for calculation. Default is candles lookback value from current candle. 'index' value is used if 'useIndex' = true
end (int) : : end bar for calculation. Default is candles lookback value from current candle. 'index' value is used if 'useIndex' = true. Default is 0
useIndex (bool) : : use index instead of lookback value. Default = false
Returns: Point object contains highest property value
method lowest_within_bars(_self, loSource, start, end, useIndex)
get the lowest property value between specific candles
Namespace types: CandlesGroup
Parameters:
_self (CandlesGroup) : : CandlesGroup object
loSource (string) : : key name of selected property
start (int) : : start bar for calculation. Default is candles lookback value from current candle. 'index' value is used if 'useIndex' = true
end (int) : : end bar for calculation. Default is candles lookback value from current candle. 'index' value is used if 'useIndex' = true. Default is 0
useIndex (bool) : : use index instead of lookback value. Default = false
Returns: the lowest value within candles
method lowest_within_bars(_self, returnWithIndex, loSource, start, end, useIndex)
get the lowest property value and bar index between specific candles
Namespace types: CandlesGroup
Parameters:
_self (CandlesGroup) : : CandlesGroup object
returnWithIndex (bool) : : the function only applicable when it is true
loSource (string) : : key name of selected property
start (int) : : start bar for calculation. Default is candles lookback value from current candle. 'index' value is used if 'useIndex' = true
end (int) : : end bar for calculation. Default is candles lookback value from current candle. 'index' value is used if 'useIndex' = true. Default is 0
useIndex (bool) : : use index instead of lookback value. Default = false
Returns:
method lowest_point_within_bars(_self, loSource, start, end, useIndex)
get a Point object which contains lowest property value between specific candles
Namespace types: CandlesGroup
Parameters:
_self (CandlesGroup) : : CandlesGroup object
loSource (string) : : key name of selected property
start (int) : : start bar for calculation. Default is candles lookback value from current candle. 'index' value is used if 'useIndex' = true
end (int) : : end bar for calculation. Default is candles lookback value from current candle. 'index' value is used if 'useIndex' = true. Default is 0
useIndex (bool) : : use index instead of lookback value. Default = false
Returns: Point object contains lowest property value
method time2bar(_self, t)
Convert UNIX time to bar index of active chart
Namespace types: CandlesGroup
Parameters:
_self (CandlesGroup) : : CandlesGroup object
t (int) : : UNIX time
Returns: bar index
method time2bar(_self, timezone, YYYY, MMM, DD, hh, mm, ss)
Convert timestamp to bar index of active chart. User defined timezone required
Namespace types: CandlesGroup
Parameters:
_self (CandlesGroup) : : CandlesGroup object
timezone (string) : : User defined timezone
YYYY (int) : : Year
MMM (int) : : Month
DD (int) : : Day
hh (int) : : Hour. Default is 0
mm (int) : : Minute. Default is 0
ss (int) : : Second. Default is 0
Returns: bar index
method time2bar(_self, YYYY, MMM, DD, hh, mm, ss)
Convert timestamp to bar index of active chart
Namespace types: CandlesGroup
Parameters:
_self (CandlesGroup) : : CandlesGroup object
YYYY (int) : : Year
MMM (int) : : Month
DD (int) : : Day
hh (int) : : Hour. Default is 0
mm (int) : : Minute. Default is 0
ss (int) : : Second. Default is 0
Returns: bar index
method get_prop_from_time(_self, key, t)
get single property value from UNIX time
Namespace types: CandlesGroup
Parameters:
_self (CandlesGroup) : : CandlesGroup object
key (string) : : key name of selected property
t (int) : : UNIX time
Returns: single property value
method get_prop_from_time(_self, key, timezone, YYYY, MMM, DD, hh, mm, ss)
get single property value from timestamp. User defined timezone required
Namespace types: CandlesGroup
Parameters:
_self (CandlesGroup) : : CandlesGroup object
key (string) : : key name of selected property
timezone (string) : : User defined timezone
YYYY (int) : : Year
MMM (int) : : Month
DD (int) : : Day
hh (int) : : Hour. Default is 0
mm (int) : : Minute. Default is 0
ss (int) : : Second. Default is 0
Returns: single property value
method get_prop_from_time(_self, key, YYYY, MMM, DD, hh, mm, ss)
get single property value from timestamp
Namespace types: CandlesGroup
Parameters:
_self (CandlesGroup) : : CandlesGroup object
key (string) : : key name of selected property
YYYY (int) : : Year
MMM (int) : : Month
DD (int) : : Day
hh (int) : : Hour. Default is 0
mm (int) : : Minute. Default is 0
ss (int) : : Second. Default is 0
Returns: single property value
method bar2time(_self, index)
Convert bar index of active chart to UNIX time
Namespace types: CandlesGroup
Parameters:
_self (CandlesGroup) : : CandlesGroup object
index (int) : : bar index
Returns: UNIX time
Point
A point on chart
Fields:
price (series float) : : price value
bar (series int) : : bar index
bartime (series int) : : time in UNIX format of bar
Property
Property object which contains values of all candles
Fields:
name (series string) : : name of property
values (float ) : : an array stores values of all candles. Size of array = bar_index
CandlesGroup
Candles Group object which contains properties of all candles
Fields:
propertyNames (string ) : : an array stores property names. Use as keys to get values
properties (Property ) : : array of Property objects
Noteworthy CandlesticksThis indicator identifies noteworthy candlestick formations by analyzing the proportions of a candlestick’s body, wicks, and shadows in relation to its total range. It highlights specific patterns to assist in analyzing potential market activity.
Key Features
Lower Wick Candles: It identifies candlesticks with long lower wicks, which may indicate price rejection at lower levels.
Upper Wick Candles: It detects candlesticks with long upper wicks, which may indicate price rejection at higher levels.
Doji Candles: It recognizes candlesticks with small bodies relative to their range, often associated with market indecision.
Definitions of Wicks and Shadows
In traditional candlestick charting, the terms wick and shadow are interchangeable, referring to the thin lines extending above and below the candlestick's body. However, this indicator uses distinct definitions:
Wicks represent the distance from the edges of the candlestick body (the open and close prices) to the high or low.
Shadows measure the distance from the closing price to the high or low of the candlestick.
By distinguishing between wicks and shadows, the indicator provides separate insights into price extremes (wicks) and price behavior around the close (shadows).
How It Works
The indicator evaluates each candlestick against user-defined thresholds for wick and shadow length. It compares the overall range of the candlestick to the ATR (Average True Range) to ensure patterns are relevant in the context of recent volatility.
Candlesticks with noteworthy lower wicks are marked with a symbol below the bar.
Candlesticks with noteworthy upper wicks are marked with a symbol above the bar.
Doji candles are marked with symbols both above and below the bar.
Applications
This indicator can assist traders in identifying potential areas of price reversal, rejection, or indecision. It can also provide additional context when used alongside other technical tools like volume analysis, trendlines, or support and resistance levels.
Acknowledgment
This description was written by ChatGPT to facilitate the understanding of the indicator's features and functionality.

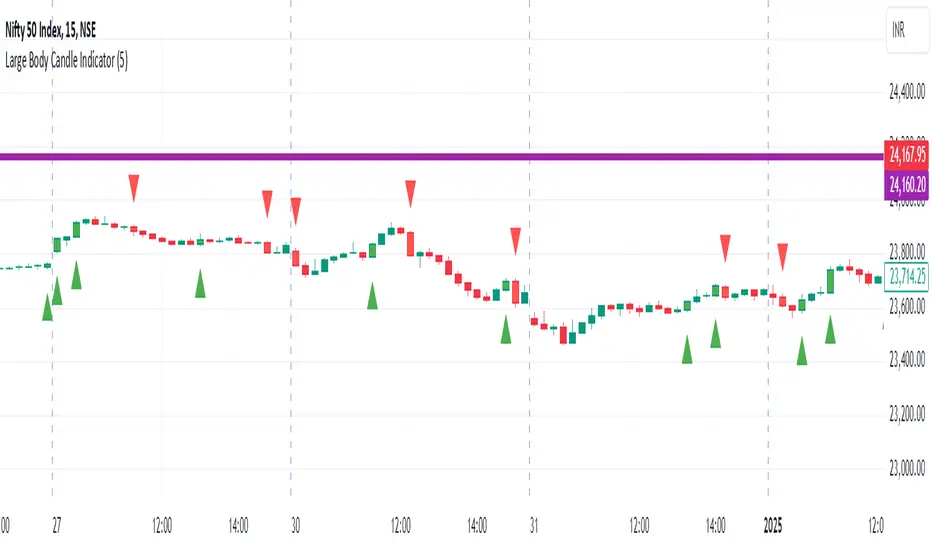
Large Body Candle IndicatorFunctionality
Comparison: The indicator compares the body size of the current candle to the maximum body size of the previous 5 candles.
Bullish Candles: When a bullish candle (close > open) has a larger body than the previous 5 candles:
A green triangle is plotted below the candle
The candle is colored green
Bearish Candles: When a bearish candle (close < open) has a larger body than the previous 5
candles:
A red triangle is plotted above the candle
The candle is colored red
Key Components
Lookback Period: Default set to 5 candles, but can be adjusted by the user.
Body Size Calculation: Calculated as the absolute difference between the open and close prices.
Maximum Previous Body Size: Determined by comparing the body sizes of the previous 5 candles.
Candle Classification: Candles are classified as bullish or bearish based on the relationship between open and close prices.
Visual Indicators:
Shape plotting for triangles
Bar coloring for highlighted candles
User Customization
Users can adjust the lookback period through the indicator settings, allowing for flexibility in identifying significant candles based on recent price action.
Use Cases
Identifying potential breakout candles
Spotting significant price movements
Enhancing visual analysis of price action
Supporting decision-making in trading strategies
Limitations
The indicator does not predict future price movements
It's based solely on recent price action and doesn't consider other technical or fundamental factors
Conclusion
The Large Body Candle Indicator provides a simple yet effective way to visually identify candles that show significant price movement relative to recent price action. It can be a valuable tool when used in conjunction with other technical analysis methods.
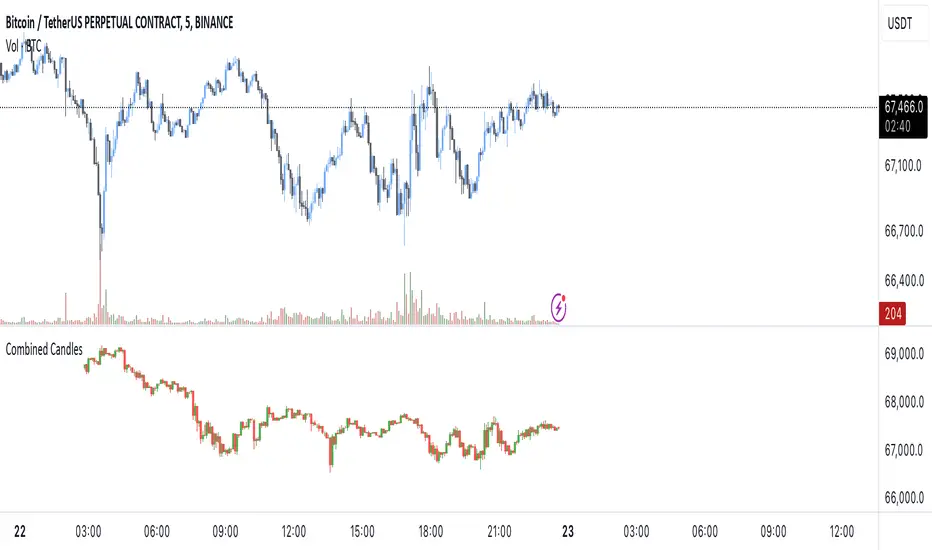
[EmreKb] Combined CandlesThis script combines multiple candlestick patterns into a single, unified candle when they are of the same type (bullish or bearish). Instead of displaying every individual candle on the chart, it merges consecutive candles based on their direction to simplify the visual analysis of price movements.
What It Does:
Combines Candles: If two or more consecutive candles are bullish (close price higher than open price) or bearish (close price lower than open price), the script merges them into a single candle, adjusting the high, low, and close values accordingly.
Displays Merged Candles: The merged candles are drawn on the chart. A green bar represents a bullish period, while a red bar represents a bearish period.
How It Works:
The script tracks whether each candle is bullish or bearish.
If a candle is the same type as the previous one, it updates the combined candle (adjusting the high, low, and close values).
When the type changes (from bullish to bearish or vice versa), it finalizes the current combined candle and starts a new one.
The merged candles are displayed on the chart at the end of the data series.
Use Case:
This script simplifies price action by grouping similar candles together, making it easier to identify trends and spot periods of sustained buying or selling pressure. It can help traders focus on the overall direction of the market rather than being distracted by small fluctuations between individual candles.
Green/Red Candle Probability (EMA 7, SMA 20, SMA 200)### Strategy Explanation for Candle Probability Indicator
This script is designed to calculate the **probability of bullish (green) and bearish (red) candles** over a given analysis period. It leverages three key moving averages to identify market trends and display these probabilities directly on the chart, making it easier for traders to make informed decisions.
#### **How the Script Works:**
1. **Trend Detection Using Moving Averages:**
- The script calculates three moving averages:
- **EMA (Exponential Moving Average) over 7 periods**
- **SMA (Simple Moving Average) over 20 periods**
- **SMA over 200 periods**
The trend is classified as:
- **Bullish:** When EMA 7 > SMA 20 > SMA 200
- **Bearish:** When EMA 7 < SMA 20 < SMA 200
2. **Candle Analysis:**
The script analyzes the last "n" candles (based on the user-defined lookback period) to count the number of bullish and bearish candles:
- **Bullish (green) candle:** The closing price is higher than the opening price.
- **Bearish (red) candle:** The closing price is lower than the opening price.
3. **Probability Calculation:**
The probabilities are calculated as a percentage of bullish and bearish candles in the lookback period:
- **Green Probability (%) = (Number of Green Candles / Lookback Period) × 100**
- **Red Probability (%) = (Number of Red Candles / Lookback Period) × 100**
4. **Displaying Results in a Table:**
The results are displayed in a table on the chart, including:
- **Green Probability (%)**
- **Red Probability (%)**
- **Current Trend (Bullish, Bearish, or Neutral)**
#### **Strategy Overview:**
This indicator provides traders with a quick overview of the candle probabilities and the current market trend based on moving averages. It helps traders:
- Gauge the likelihood of bullish or bearish candles appearing in the near future.
- Identify the prevailing trend (bullish, bearish, or neutral).
- Adjust their trading strategies based on statistical probabilities rather than assumptions.
### **Important Notes:**
- The lookback period can be customized between **10 and 200 periods**.
- The indicator does not provide buy/sell signals but gives insights into market behavior.
By understanding the candle probabilities and the trend, traders can better assess market conditions and improve their decision-making process.

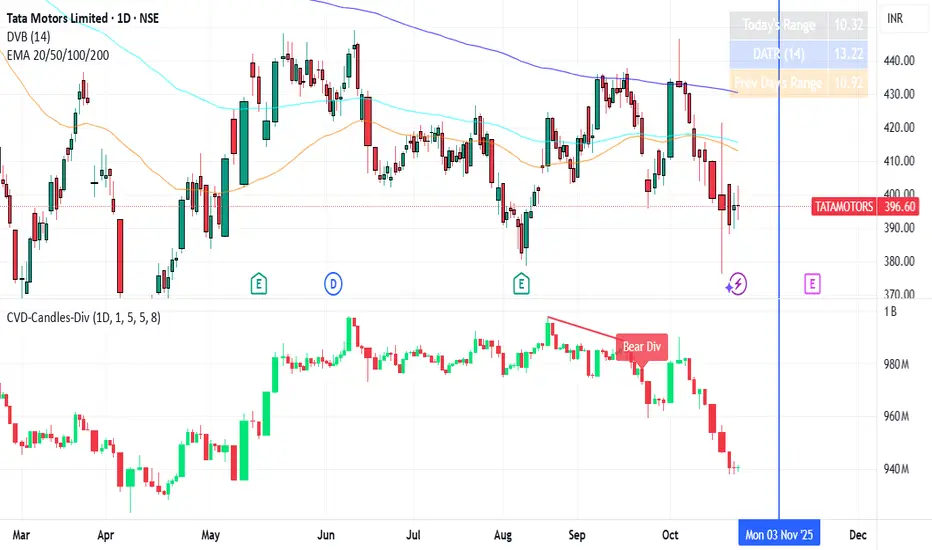
CVD Candles + Divergence (Pane) [NIRALA]This indicator provides a powerful way to analyze market dynamics by visualizing Cumulative Volume Delta (CVD) as candlesticks and automatically detecting divergences between price and order flow. It is designed to help traders spot potential trend exhaustion and reversals that may not be apparent from price action alone.
Key Concepts
Cumulative Volume Delta (CVD): CVD is a running total of the difference between buying and selling volume from market orders. A rising CVD indicates aggressive buying, while a falling CVD indicates aggressive selling. Unlike price, which can be influenced by passive limit orders, CVD shows the raw intent of aggressive market participants.
Divergence: A divergence occurs when price and CVD move in opposite directions. This signals a potential conflict between price action and the underlying order flow, often preceding a reversal.
Bearish Divergence: Price makes a new high, but CVD fails to make a new high (or makes a lower high). This suggests buying aggression is weakening despite the higher price, and a reversal to the downside may be imminent.
Bullish Divergence: Price makes a new low, but CVD fails to make a new low (or makes a higher low). This suggests selling pressure is drying up, and a reversal to the upside may be coming.
Features
CVD as Candlesticks: Plots CVD in a familiar OHLC candlestick format in a separate pane, providing a more intuitive view of order flow momentum and volatility compared to a simple line.
Automatic Divergence Detection: The script automatically identifies classic bullish and bearish divergences between price pivots and CVD pivots, drawing lines on both the main price chart and the indicator pane to clearly highlight them.
Multi-Timeframe Analysis: Calculates CVD from a user-defined lower timeframe, offering a more granular and precise view of the order flow that builds up a single candle on your chart.
Customizable Pivot Lookbacks: Allows you to adjust the sensitivity of the pivot detection for finding both short-term and long-term divergences.
Alerts: Includes built-in alerts that can notify you when a new bullish or bearish divergence is confirmed.
How to Use
Look for High-Probability Setups: This indicator is most powerful when its signals appear at key areas of support or resistance. A divergence at a major price level is a much stronger signal than one in the middle of a range.
Confirm with Price Action: Do not trade on a divergence signal alone. Wait for a confirmation candle (e.g., a bearish engulfing candle after a bearish divergence, or a bullish hammer after a bullish divergence) before considering an entry.
Combine with Your Strategy: Use this indicator as a confirmation tool to enhance your existing trading strategy. For example, if your primary strategy gives a sell signal and this indicator simultaneously prints a bearish divergence, it significantly increases the probability of the trade.
This tool is designed for discretionary traders looking to add a layer of order flow analysis to their decision-making process.