在腳本中搜尋"change"

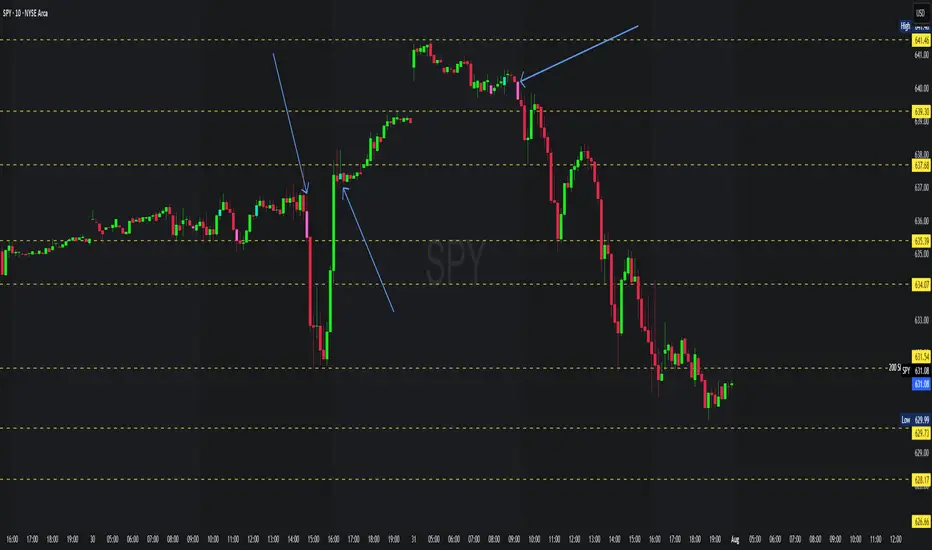
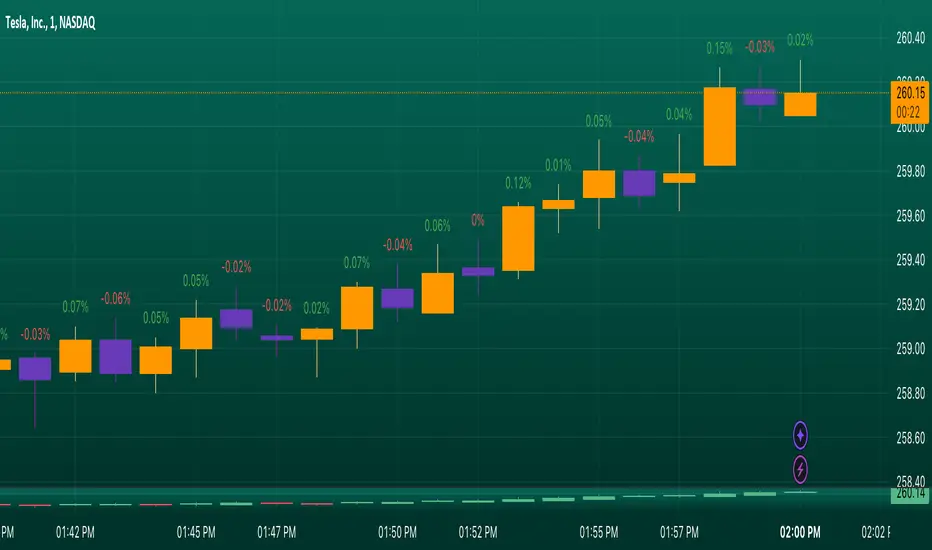
Above/Below Open Background + Percentage ChangeAbove/Below Open Background
This indicator visually highlights whether the current price is trading above or below today’s session open.
It also displays a small table showing the current percentage change relative to today’s open.
Features
• 🟢 Full chart background coloring:
• Green → Price is above today’s open.
• 🔴 Red → Price is below today’s open.
• 📊 Percentage change table in the chart corner:
• Shows real-time % difference from today’s open.
• Automatically updates as price moves.
• 🎛 Clean & lightweight — minimal resource usage, smooth performance.
How to Use
1. Add the indicator to any stock, crypto, or futures chart.
2. The background immediately shows whether price is up or down relative to today’s open.
3. The table in the corner displays the percentage gain/loss.
Best For
• Day traders who want instant visual feedback.
• Scalpers tracking session trends.
• Anyone who wants a quick snapshot of intraday performance.

Relative Weighted Rate of Change (WROC) vs Nifty 50Relative Weighted Rate of Change (WROC) vs Nifty 50

EMA 8 & 21 crossover change EMA 8 & 21 crossover change Indicator This custom TradingView indicator highlights trend shifts by changing candle colors when the 8 EMA crosses the 21 EMA. Bullish crossovers turn candles different color, while bearish crossovers turns different as well—making it easy to visually identify emerging trends and momentum shifts in real time.
Price Widget on ScreenSimple yet useful script, to see the PRICE/CHANGE of the chart you are on. I use it in my 6/8 charts screen, so you can see the graph and the price.

Weekly % Change Screener (5% Sell Threshold)This is a weekly screener for a 5% change in the stock value. If it increases by 5%, we sell and if it decreases by 5% we buy the stock. Good for stable high value stocks. Buy before testing.
CME Futures RTH net change % levelsRTH Session time calculated for AMERICAN FUTURES ONLY.
Plots the net change % from the last session's RTH close, a.k.a daily % change for that specific instrument. Best used as support and resistance zones in confluence with other analysis, and also serve as a gauge for how volatile the session is.

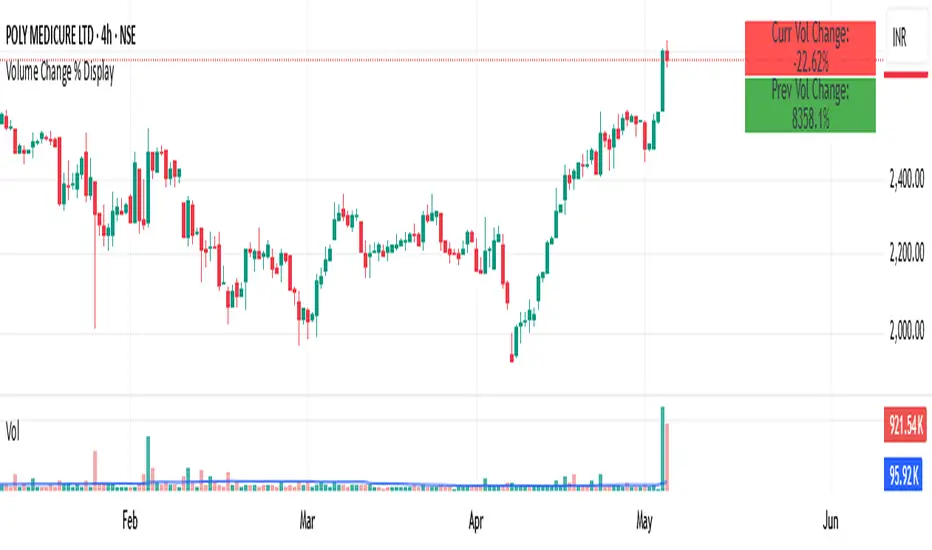
Volume Change % Display1- Current bar's volume change %
2- Previous bar's volume change %
* Each line uses its own color based on volume rising or falling.
* Keeps the layout compact and readable.
Intraday vs Overnight Change TrackerThis indicator tracks a synthetic price path based on either intraday or overnight return behavior, allowing users to analyze which component of daily price movement is contributing more to long-term performance.
***THIS INDICATOR ONLY WORKS ON THE DAILY TIMEFRAME***
Intraday mode compounds price change from market open to close: close / open
Overnight mode compounds price change from previous close to current open: open / close
The user can select one of these two modes using a dropdown input. The synthetic price series starts from the second bar of the chart and compounds forward bar-by-bar using the selected return type. The result is a line that reflects cumulative return based solely on either intraday or overnight activity.
⚙️ Inputs
Synthetic Price Type: Select between "Intraday" or "Overnight" to visualize the respective compounded price series.
📈 Usage Notes
This indicator is intended for visual comparison of intraday vs. overnight price dynamics over time. It can be useful for identifying behavioral patterns, session-based return anomalies, or testing session bias strategies.
Only one synthetic line is shown at a time based on user selection.
If you want to view both intraday and overnight lines, then you can add the indicator twice, which is shown above.

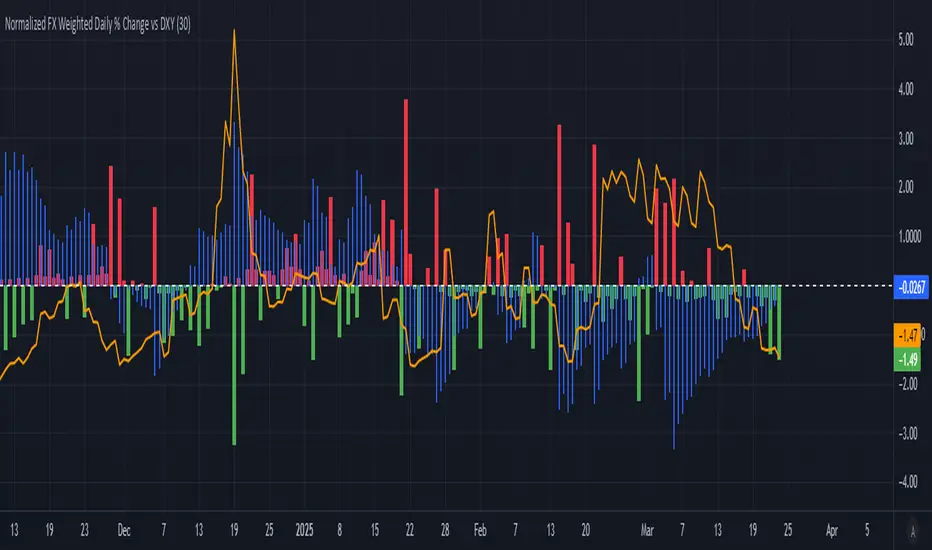
Normalized FX Weighted Daily % Change vs DXYThis indicator tracks international liquidity flows by measuring the USD’s relative strength against major currencies—EUR, CNY, JPY, GBP, and CAD. It calculates the weighted percentage change of each pair over a specified interval. A positive reading means the USD is weakening (liquidity flowing out of the US), while a negative reading indicates the USD is strengthening (liquidity flowing in). Additionally, the indicator incorporates the DXY index and VIX, with all components normalized using Z-scores for clear, comparable insights into market dynamics.
Weekly Change(Green&Red) & Percentage Change(Blue&Yellow)Display bar chart of weekly price action. Use to determine the maximum price change in one week. It would be the possible strike price for a covered call option for weekly income.

Candle Percentage Changendicator Setup: The script creates an indicator that overlays on the price chart.
Percentage Calculation: It calculates the percentage change between the current and previous candle closes.
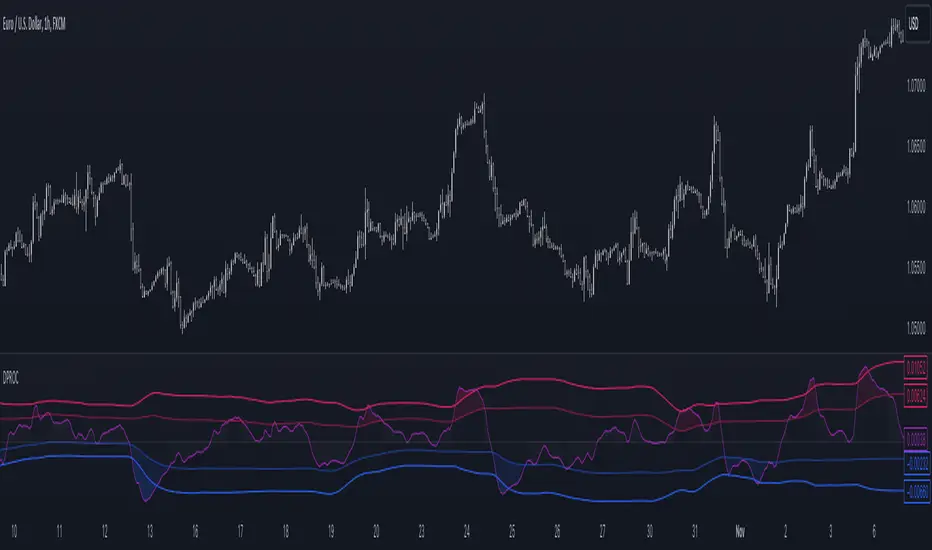
Detrended Price Rate of ChangeThe Detrended Price Rate of Change is an oscillator developed to help traders identify potential conditions of overbought and oversold markets.
The formula of the oscillator includes both the Detrended price formula, useful to spot divergences, and the Rate of change simplified formula, which helps in identifying overextended markets and gives useful information on price momentum.
YOY Change (Log Scale)ear-Over-Year Change Indicator (Log Scale) calculates the percentage change of a security's price over the past year, on a logarithmic scale. It is a momentum indicator that can be used to identify trends and potential reversals.
A positive value on the indicator indicates that the security's price has increased over the past year, while a negative value indicates that the price has decreased. A larger positive or negative value indicates a stronger trend.
The indicator can be used to identify overbought and oversold conditions. When the indicator is significantly above or below zero, it may be a sign that the security is overbought or oversold and a reversal may be imminent.

Price Change IndicatorEnglish:
This indicator calculates the percentage change in price from the opening to the high and from the opening to the low for the current candle. It allows users to set a threshold percentage for both price increases and decreases. If the price change exceeds the specified threshold, the indicator generates signals and marks them on the chart. A green triangle indicates a price increase exceeding the set threshold, and a red triangle indicates a price decrease exceeding the set threshold.
Inputs:
% UP: Percentage threshold for a price increase.
% DOWN: Percentage threshold for a price decrease.
------------------------
Russian:
Этот индикатор рассчитывает процентное изменение цены от открытия до максимума и от открытия до минимума для текущей свечи. Он позволяет установить пороговый процент как для увеличения, так и для уменьшения цены. Если изменение цены превышает установленный порог, индикатор генерирует сигналы и отмечает их на графике. Зеленый треугольник указывает на увеличение цены сверх установленного порога, а красный треугольник - на уменьшение цены сверх установленного порога.
Настройки:
% ВВЕРХ: Пороговый процент для увеличения цены.
% ВНИЗ: Пороговый процент для уменьшения цены.

Trend Change DetectorThe trend change detector oscillator is a tool designed to help traders identify the current trend direction paired with the potential reversal zones.
The oscillator is made of multiple parts:
- The colored histogram, that displays the current long-term trend direction (long if above 0, short if below)
- The trend line, which shows the price in relation to the fair value of the current trend
- The reversal zones, which are the area that alarms the traders that the price might reverse soon after having touched them
The indicator can work with three different inputs. In the Source panel, you can choose between "Price", "Price and Volume" and "Ponderated Volume". The price input uses only the price, the price and volume use the average between the price and the ponderated volume, and the ponderated volume shows the indicator working with volume data, with formulas such as the On Balance Volume and the Accumulation-Distribution line.
This indicator can be used both for trend following technique, using the cross of the trend line with the 0-line as signals in conjunction with the bias given by the histogram, and for mean reversal technique thanks to the reversal zones that allow traders to identify potential tops and bottoms.


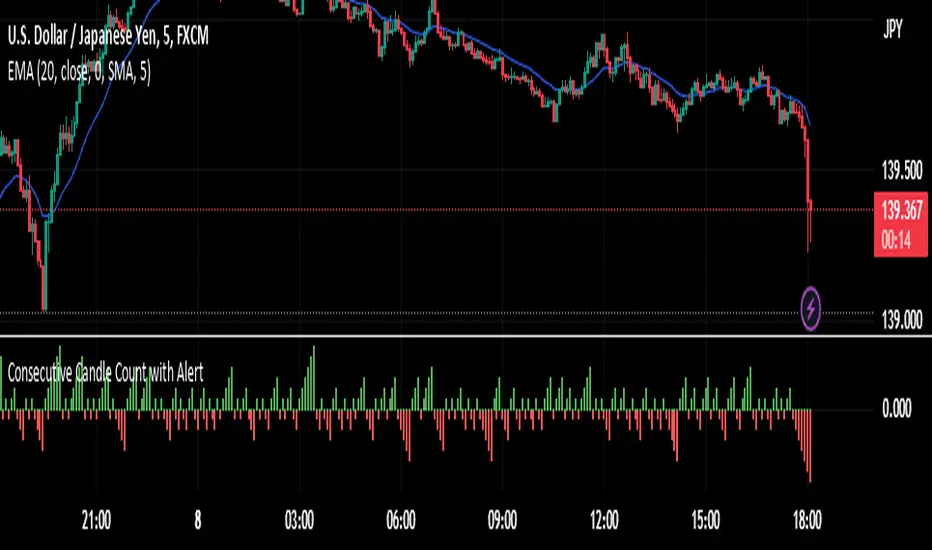
Candle Body Color change with Alert-Yogesh PawarThose who wants to get alert for Candle Body Color change, can try this. It will help you.
Rate Of Change [Hyperbolic]Rate Of Change just got fixed!
Do note that you have to activate the "exotic calculations" inside the ROC-H settings.
A hyperbolic curve now transforms price. No more infinities on your indicators!
You may use the "exotic" function, that is embedded in my script in your own scripts.
This formula basically transforms the input (which may be zero or negative) into a strictly positive one.
While the mathematicians out there would opt for alternative formulae (like the exponential for negative numbers), I used the hyperbolic curve for continuity purposes. Feel free to build upon my calculations, and make them even better!
Tread lightly, for this is hallowed ground.
-Father Grigori
P.S. I cannot lock the source code. Science and knowledge belongs to humanity. Knowledge must not be up for sale.

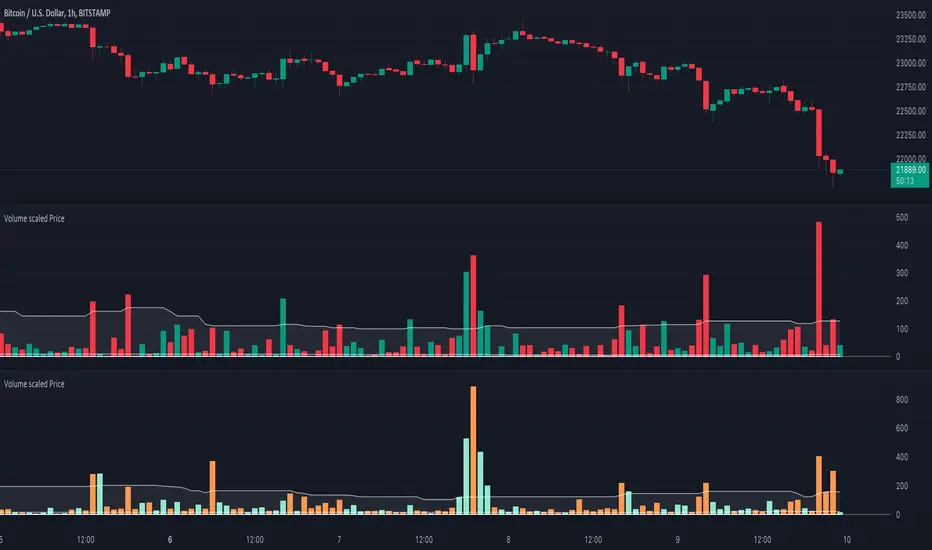
Volume scaled Price + auto colour change light/dark mode🔶 OVERVIEW
🔹 This script shows price in a similar style as volume . To accomplish this we use the body of the candle ( close - open ), which is placed on a zero line.
This can be useful when comparing volume ~ price .
🔹 3 options are included to show additional lines, to make comparisons easier:
· Percentile nearest rank
· Bollinger Bands (BB)
· Simple Moving Average (SMA)
🔶 SETTINGS
🔹 Option : choose whether to show price (candles) or volume . Adding 2 versions of this indicator on the chart enables you to compare these 2 options:
🔹 Lines:
· (Percentile nearest rank (only the setting mult is used for this option).
· Bollinger Bands (BB) (only the setting % perc. nearest rank is used for this option).
· Simple Moving Average (SMA )
All 3 options will use length , this is the amount of bars used for calculations.
🔹 Show wick will show you... wicks :)
🔶 PERCENTILE NEAREST RANK
🔹 This script has 2 extra types of background color
dvP = volume > volume and z < z and z < prP_ and volume > prV
· In this case:
· volume is higher than previous volume ( volume > volume )
· volume is above 90th percentile rank ( volume > prV )
· price is lower than previous price ( z < z )
· price is below 10th percentile rank ( z < prP_ )
dvV = volume < volume and z > z and z > prP and volume < prV_
· The second type background color is reversed ( volume lower, price higher)
🔶 AUTOMATIC COLOUR CHANGE WHEN SWITCHING DARK/LIGHT MODE
🔹 chart.bg_color returns the color of the chart’s background from the "Chart settings/Appearance/Background" field, while chart.fg_color returns a color providing optimal contrast with chart.bg_color .
· Following technique gives you the possibility to pick your own colour for either dark/light time.
· We first retrieve separately the red, green and blue component of the measured chart.bg_color
r = color.r(chart.bg_color)
g = color.g(chart.bg_color)
b = color.b(chart.bg_color)
The following assumption states when all 3 colour components' values are below 80, we are in the dark mode:
isDark = r < 80 and g < 80 and b < 80
Now we can use isDark to automatically show your own dark/light mode colours (chosen at settings), dependable on the mode:
Cheers!
ROC (Rate of Change) Refurbished▮ Introduction
The Rate of Change indicator (ROC) is a momentum oscillator.
It was first introduced in the early 1970s by the American technical analyst Welles Wilder.
It calculates the percentage change in price between periods.
ROC takes the current price and compares it to a price 'n' periods (user defined) ago.
The calculated value is then plotted and fluctuates above and below a Zero Line.
A technical analyst may use ROC for:
- trend identification;
- identifying overbought and oversold conditions.
Even though ROC is an oscillator, it is not bounded to a set range.
The reason for this is that there is no limit to how far a security can advance in price but of course there is a limit to how far it can decline.
If price goes to $0, then it obviously will not decline any further.
Because of this, ROC can sometimes appear to be unbalanced.
(TradingView)
▮ Improvements
The following features were added:
1. Eight moving averages for the indicator;
2. Dynamic Zones;
3. Rules for coloring bars/candles.
▮ Motivation
Averages have been added to improve trend identification.
For finer tuning, you can choose the type of averages.
You can hide them if you don't need them.
The Dynamic Zones has been added to make it easier to identify overbought/oversold regions.
Unlike other oscillators like the RSI for example, the ROC does not have a predetermined range of oscillations.
Therefore, a fixed line that defines an overbought/oversold range becomes unfeasible.
It is in this matter that the Dynamic Zone helps.
It dynamically adjusts as the indicator oscillates.
▮ About Dynamic Zones
'Most indicators use a fixed zone for buy and sell signals.
Here's a concept based on zones that are responsive to the past levels of the indicator.'
The concept of Dynamic Zones was described by Leo Zamansky (Ph.D.) and David Stendahl, in the magazine of Stocks & Commodities V15:7 (306-310).
Basically, a statistical calculation is made to define the extreme levels, delimiting a possible overbought/oversold region.
Given user-defined probabilities, the percentile is calculated using the method of Nearest Rank.
It is calculated by taking the difference between the data point and the number of data points below it, then dividing by the total number of data points in the set.
The result is expressed as a percentage.
This provides a measure of how a particular value compares to other values in a data set, identifying outliers or values that are significantly higher or lower than the rest of the data.
▮ Thanks and Credits
- TradingView: for ROC and Moving Averages
- allanster: for Dynamic Zones

Weekly Change % This script shows Weekly Change % in Histogram. Start date of Week is Friday and End date of Week is Thursday. This script is useful for trade who deal with Weekly Options in Nifty and Bank Nifty
