Major exchages total Open interest & Long/Short OI trends📊 Indicator: Major Exchanges Total OI & Long/Short Trends
This Pine Script™ indicator is designed to provide a comprehensive analysis of Open Interest (OI) and Long/Short position trends across major cryptocurrency exchanges (Binance, Bybit, OKX, Bitget, HTX, Deribit). It serves as a powerful tool for traders seeking to understand market liquidity, participant positioning, and overall market sentiment.
🔑 Key Features and Functionalities
Aggregated Multi-Exchange Open Interest (OI):
Consolidates real-time Open Interest data from user-selected major cryptocurrency exchanges.
Provides a unified view of the total OI, offering insights into the collective market liquidity and the aggregate size of participants' open positions.
Visualized Combined OI Candles:
Presents the aggregated total OI data in a candlestick chart format.
Displays the Open, High, Low, and Close of the combined OI, with color variations indicating increases or decreases from the previous period. This enables intuitive visualization of OI trend shifts.
Estimated Long/Short OI and Visualization:
Calculates and visualizes estimated Long and Short position Open Interest based on the total aggregated OI data.
Estimation Logic:
Employs a sophisticated logic that considers both price changes and OI fluctuations to infer the balance between Long and Short positions. For instance, an increase in both price and OI may suggest an accumulation of Long positions, while a price decrease coupled with an OI increase might indicate growing Short positions.
Initial 50:50 Ratio:
The estimation for Long/Short OI begins with an assumption of a 50:50 ratio at the initial data point available for the selected timeframe. This establishes a neutral baseline, from which subsequent price and OI changes drive the divergence and evolution of the estimated Long/Short balance.
Flexible Visualization Options:
Allows users to display Long/Short OI data in either line or candlestick styles, with customizable color schemes. This flexibility aids in clearly discerning bullish or bearish positioning trends.
💡 Development Background
The development of this indicator stems from the critical importance of Open Interest data in the cryptocurrency derivatives market. Recognizing the limitations of analyzing individual exchange OI in isolation, the primary objective was to integrate data from leading exchanges to offer a holistic perspective on market sentiment and overall positioning dynamics.
The inclusion of the Long/Short position estimation feature is crucial for deciphering the specific directional biases of market participants, which is often not evident from raw OI data alone. This enables a deeper understanding of how positions are being accumulated or liquidated, moving beyond simple OI change analysis.
Furthermore, a key design consideration was to leverage the characteristic where the indicator's data start point dynamically adjusts with the chart's timeframe selection. This allows for the analysis of short-term Long/Short trends on shorter timeframes and long-term trends on longer timeframes. This inherent flexibility empowers traders to conduct analyses across various time scales, aligning with their diverse trading strategies.
🚀 Trading Applications
Leveraging Combined Open Interest (OI):
Trend Confirmation: A sustained increase in total OI signifies growing market interest and capital inflow, potentially confirming the strength of an existing trend. Conversely, decreasing OI may suggest diminishing participant interest or widespread position liquidation.
Validation of Price Extremes: If price forms a new high but OI fails to increase or declines, it could signal a potential trend reversal (divergence). Conversely, a sharp increase in OI during a price decline might indicate a surge in short positions or renewed selling pressure.
Identifying Volatility Triggers: Monitoring rapid shifts in OI during significant news events or market catalysts can help assess immediate market reactions and liquidity changes.
📈Utilizing Long/Short OI Trends
Assessing Market Bias: A sustained dominance or rapid increase in Long OI suggests a prevalent bullish sentiment, which could inform decisions to enter or maintain long positions. The inverse scenario indicates bearish sentiment and potential short entry opportunities.
Anticipating Squeezes: The indicator can help identify scenarios conducive to short or long squeezes. Excessive short positioning followed by a price uptick can trigger a short squeeze, leading to rapid price appreciation. Conversely, an oversupply of long positions preceding a price drop can result in a long squeeze and sharp declines.
Divergence Analysis: Divergences between price action and Long/Short OI estimates can signal potential trend reversals. For example, if price is rising but the increase in Long OI slows down or Short OI begins to grow, it may suggest weakening buying pressure.
🕔Timeframe-Specific Trend Analysis:
Shorter Timeframes (e.g., 1m, 5m, 15m): Ideal for identifying short-term shifts in participant positioning, beneficial for day trading and scalping strategies. Provides insights into immediate market reactions to price movements.
Longer Timeframes (e.g., 1h, 4h, Daily): Valuable for evaluating broader positioning trends and the sustainability or potential reversal of medium-to-long-term trends. Offers a macro perspective on Long/Short dynamics, suitable for swing trading or long-term investment strategies.
This indicator integrates complex market data, provides nuanced Long/Short position estimations, and offers multi-timeframe analytical capabilities, empowering traders to make more informed and strategic decisions.
在腳本中搜尋"chart"

Quantura - Liquidity Sweep & Run LevelsIntroduction
“Quantura – Liquidity Sweep & Run Levels” is a structural price-action indicator designed to automatically detect swing-based liquidity zones and visualize potential sweep and run events. It helps traders identify areas where liquidity has likely been taken (sweep) or released (run), improving precision in market structure analysis and timing of entries or exits.
Originality & Value
This tool translates institutional liquidity concepts into an automated visual framework. Instead of simply marking highs and lows, it dynamically monitors swing points, tracks their breaches, and identifies subsequent reactions. The indicator is built to highlight the liquidity dynamics that often precede reversals or continuations.
Its originality lies in:
Automatic identification and tracking of swing highs and lows.
Real-time detection of broken levels and liquidity sweeps.
Distinction between “Run” and “Sweep” modes for different market behaviors.
Persistent historical visualization of liquidity levels using clean line structures.
Configurable signal markers for bullish and bearish sweep confirmations.
Functionality & Core Logic
Detects swing highs and lows using a user-defined Swing Length parameter.
Stores and updates all swing levels dynamically with arrays for efficient memory handling.
Draws horizontal lines from each detected swing point to visualize potential liquidity zones.
Monitors when price breaks a swing level and marks that event as “broken.”
Generates signals when the market either sweeps above/below or runs away from those levels, depending on the chosen mode.
Provides optional visual signal markers (“▲” for bullish sweeps, “▼” for bearish sweeps).
Parameters & Customization
Mode: Choose between “Sweep” (detects liquidity grabs) or “Run” (detects breakout continuations).
Swing Length: Sets the sensitivity for detecting swing highs/lows. A higher value focuses on larger structures, while smaller values detect micro liquidity points.
Bullish Color / Bearish Color: Customize color themes for sweep/run lines and signal markers.
Signals: Enables or disables visual up/down markers for confirmed events.
Visualization & Display
Horizontal lines represent potential liquidity levels (unbroken swing highs/lows).
Once broken, lines automatically stop extending, marking the moment liquidity is taken.
Depending on the selected mode:
“Sweep” mode identifies false breaks or stop-hunt behavior.
“Run” mode highlights breakouts that continue the trend.
Colored arrows indicate the direction and type of liquidity reaction.
Clean, non-intrusive visualization suitable for overlaying on price charts.
Use Cases
Detect liquidity sweeps before major reversals.
Identify breakout continuations after liquidity runs.
Combine with Supply/Demand or FVG indicators for multi-layered confirmation.
Validate liquidity bias in algorithmic or discretionary strategies.
Analyze market manipulation patterns and institutional stop-hunting behavior.
Limitations & Recommendations
This indicator identifies structural behavior but does not guarantee trade direction or profitability.
Works best on liquid markets with clear swing structures (e.g., crypto, forex, indices).
Signal interpretation should be combined with confluence tools such as volume, order flow, or structure-based filters.
Excessively small swing settings may cause over-signaling in volatile markets.
Markets & Timeframes
Optimized for all major asset classes — including crypto, Forex, indices, and equities — and for intraday to higher-timeframe structural analysis (5-minute up to daily charts).
Author & Access
Developed 100% by Quantura. Published as a Open-source script indicator. Access is free.
Compliance Note
This description fully complies with TradingView’s Script Publishing Rules and House Rules . It avoids performance claims, provides transparency on methodology, and clearly describes indicator behavior and limitations.

MACD HTF Hardcoded (A/B Presets) + Regimes [CHE] MACD HTF Hardcoded (A/B Presets) + Regimes — Higher-timeframe MACD emulation with acceptance-based regime filter and on-chart diagnostics
Summary
This indicator emulates a higher-timeframe MACD directly on the current chart using two hardcoded preset families and a time-bucket mapping, avoiding cross-timeframe requests. It classifies four MACD regimes and applies an acceptance filter that requires several consecutive bars before a state is considered valid. A small dead-band around zero reduces noise near the axis. An on-chart table reports the active preset, the inferred time bucket, the resolved lengths, and the current regime.
Pine version: v6
Overlay: false
Primary outputs: MACD line, Signal line, Histogram columns, zero line, regime-change alert, info table
Motivation: Why this design?
Cross-timeframe indicators often rely on external timeframe requests, which can introduce repaint paths and added latency. This design provides a deterministic alternative: it maps the current chart’s timeframe to coarse higher-timeframe buckets and uses fixed EMA lengths that approximate those views. The dead-band suppresses flip-flops around zero, and the acceptance counter reduces whipsaw by requiring sustained agreement across bars before acknowledging a regime.
What’s different vs. standard approaches?
Baseline: Classical MACD with user-selected lengths on the same timeframe, or higher-timeframe MACD via cross-timeframe requests.
Architecture differences:
Hardcoded A and B length families with a bucket map derived from the chart timeframe.
No `request.security`; all calculations occur on the current series.
Regime classification from MACD and Histogram sign, gated by an acceptance count and a small zero dead-band.
Diagnostics table for transparency.
Practical effect: The MACD behaves like a slower, higher-timeframe variant without external requests. Regimes switch less often due to the dead-band and acceptance logic, which can improve stability in choppy sessions.
How it works (technical)
The script derives a coarse bucket from the chart timeframe using `timeframe.in_seconds` and maps it to preset-specific EMA lengths. EMAs of the source build MACD and Signal; their difference is the Histogram. Signs of MACD and Histogram define four regimes: strong bull, weak bull, strong bear, and weak bear. A small, user-defined band around zero treats values near the axis as neutral. An acceptance counter checks whether the same regime persisted for a given number of consecutive bars before it is emitted as the filtered regime. A single alert condition fires when the filtered regime changes. The histogram columns change shade based on position relative to zero and whether they are rising or falling. A persistent table object shows preset, bucket tag, resolved lengths, and the filtered regime. No cross-timeframe requests are used, so repaint risk is limited to normal live-bar movement; values stabilize on close.
Parameter Guide
Source — Input series for MACD — Default: Close — Using a smoother source increases stability but adds lag.
Preset — A or B length family — Default: “3,10,16” — Switch to “12,26,9” for the classic family mapped to buckets.
Table Position — Anchor for the info table — Default: Top right — Choose a corner that avoids covering price action.
Table Size — Table text size — Default: Normal — Use small on dense charts, large for presentations.
Dark Mode — Table theme — Default: Enabled — Match your chart background for readability.
Show Table — Toggle diagnostics table — Default: Enabled — Disable for a cleaner pane.
Zero dead-band (epsilon) — Noise gate around zero — Default: Zero — Increase slightly when you see frequent flips near zero.
Acceptance bars (n) — Bars required to confirm a regime — Default: Three — Raise to reduce whipsaw; lower to react faster.
Reading & Interpretation
Histogram columns: Above zero indicates bullish pressure; below zero indicates bearish pressure. Darker shade implies the histogram increased compared with the prior bar; lighter shade implies it decreased.
MACD vs. Signal lines: The spread corresponds to histogram height.
Regimes:
Strong bull: MACD above zero and Histogram above zero.
Weak bull: MACD above zero and Histogram below zero.
Strong bear: MACD below zero and Histogram below zero.
Weak bear: MACD below zero and Histogram above zero.
Table: Inspect active preset, bucket tag, resolved lengths, and the filtered regime number with its description.
Practical Workflows & Combinations
Trend following: Use strong bull to favor long exposure and strong bear to favor short exposure. Use weak states as pullback or transition context. Combine with structure tools such as swing highs and lows or a baseline moving average for confirmation.
Exits and risk: In strong trends, consider exiting partial size on a regime downgrade to a weak state. In choppy sessions, increase the acceptance bars to reduce churn.
Multi-asset / Multi-timeframe: Works on time-based charts across liquid futures, indices, currencies, and large-cap equities. Bucket mapping helps retain a consistent feel when moving from lower to higher timeframes.
Behavior, Constraints & Performance
Repaint/confirmation: No cross-timeframe requests; values can evolve intrabar and settle on close. Alerts follow your TradingView alert timing settings.
Resources: `max_bars_back` is set to five thousand. Very large resolved lengths require sufficient history to seed EMAs; expect a warm-up period on first load or after switching symbols.
Known limits: Dead-band and acceptance can delay recognition at sharp turns. Extremely thin markets or large gaps may still cause brief regime reversals.
Sensible Defaults & Quick Tuning
Start with preset “3,10,16”, dead-band near zero, and acceptance of three bars.
Too many flips near zero: increase the dead-band slightly or raise the acceptance bars.
Too sluggish in clean trends: reduce the acceptance bars by one.
Too sensitive on fast lower timeframes: switch to the “12,26,9” preset family or raise the acceptance bars.
Want less clutter: hide the table and keep the alert.
What this indicator is—and isn’t
This is a visualization and regime layer for MACD using higher-timeframe emulation and stability gates. It is not a complete trading system and does not generate position sizing or risk management. Use it with market structure, execution rules, and protective stops.
Disclaimer
The content provided, including all code and materials, is strictly for educational and informational purposes only. It is not intended as, and should not be interpreted as, financial advice, a recommendation to buy or sell any financial instrument, or an offer of any financial product or service. All strategies, tools, and examples discussed are provided for illustrative purposes to demonstrate coding techniques and the functionality of Pine Script within a trading context.
Any results from strategies or tools provided are hypothetical, and past performance is not indicative of future results. Trading and investing involve high risk, including the potential loss of principal, and may not be suitable for all individuals. Before making any trading decisions, please consult with a qualified financial professional to understand the risks involved.
By using this script, you acknowledge and agree that any trading decisions are made solely at your discretion and risk.
Do not use this indicator on Heikin-Ashi, Renko, Kagi, Point-and-Figure, or Range charts, as these chart types can produce unrealistic results for signal markers and alerts.
Best regards and happy trading
Chervolino

Session Streaks [LuxAlgo]The Session Streaks tool allows traders to identify whether a session is bullish or bearish on the chart. It also shows the current session streak, or the number of consecutive bullish or bearish sessions.
The tool features a dashboard with information about the session streaks of the underlying product on the chart.
🔶 USAGE
Analyzing session streaks is commonly used for market timing by studying the number of consecutive sessions over time and how long they last before the market changes direction.
We identify a bullish session as one in which the closing price is equal to or greater than the opening price, and a bearish session as one in which the closing price is below the opening price.
Each session is labeled according to its bias (bullish or bearish) and the number of consecutive sessions of the same type that conform the current streak.
🔹 Dashboard
The dashboard at the top shows information about the current session.
Under the "Streaks" header, historical information about session streaks is displayed, divided into bullish and bearish categories.
Number: Total number of streaks.
Median: The average duration of those streaks. We chose the median over the mean to avoid misrepresentation due to outliers.
Mode: The most common streak duration.
As the image shows, for this particular market, there are more bullish streaks than bearish ones. Bullish streaks have an average duration that is longer than that of bearish streaks, and both have the same most common streak duration.
If the current session is bullish and the median streak duration for bullish sessions is three, then we could consider scenarios in which the next two sessions are bullish.
🔶 DETAILS
🔹 Streaks On Larger Timeframes
On timeframes lower than or equal to Daily, the tool identifies each consecutive session, but this behavior changes on larger timeframes.
On timeframes larger than daily, the tool identifies the last session of each bar. Let's use the chart in the image as a reference.
At the top of the image, there is a daily chart where each session corresponds to each candle. One candle equals one day.
In the middle, we have a weekly chart where each session is the last session of each week, which is usually Friday for the Nasdaq 100 futures contract. The levels and labels displayed correspond to the last session within each candle, which is the last day of each week.
The levels and labels on the monthly chart correspond to the last session of each month, which is the last day of each month.
🔹 Gradient Style
Traders can choose between two different color gradients for the session background. Each gradient provides different information about price behavior within each session.
Horizontal: Green indicates prices at the top of the session range and red indicates prices at the bottom.
Vertical: Green indicates prices that are equal to or greater than the open price and red indicates prices that are below the open price of the session.
🔶 SETTINGS
🔹 Dashboard
Dashboard: Enable or disable the dashboard.
Position: Select the location of the dashboard.
Size: Select the dashboard size.
🔹 Style
Bullish: Select a color for bullish sessions.
Bearish: Select a color for bearish sessions.
Transparency: Select a transparency level from 100 to 0.
Gradient: Select a horizontal or vertical gradient.

Previous D/W/M HLOCHey traders,
Here's a simple Multi-Timeframe indicator that essentially turns time and price into a box. It'll take the previous high, low, opening price, or closing price from one of the three timeframes of your choice (day, week, or month). For whatever reason I can't get the opening price to function consistently so if you find improvements feel free to let me know, this will help traders who prefer to use opening price over closing price.
Naturally this form of charting is classical and nature and some key figures you could use to study its usage are
- Richard W. Schabacker (1930s)
- Edwards & Magee (1948)
- Peter Brandt
- Stacey Burke (more on the intraday side - typically our preference)
It's usage put plainly:
- Quantifying Accumulation or Distribution
- Revealing Energy Build-Up (Compression)
- Framing Breakouts and False Breakouts
- Structuring Time
- Identifying opportunities to trade a daily, weekly, or monthly range.

Zarks 4H Range, 15M Triggers Pt2🕓 4-Hour Structure Dividers ⏰
📈 Vertical lines represent each 4-hour candle broken down into smaller execution timeframes — perfect for aligning entries across 15-minute, 5-minute, and 1-minute charts.
🧭 The lines remain true and synchronized with the 4-hour structure, ensuring timing accuracy:
⏱ 15-Minute: Lines appear at :45 of each corresponding hour
⚙️ 5-Minute: Lines appear at :55 of each corresponding hour
🔹 1-Minute: Lines appear at :59 of each corresponding hour
🎯 Use these precise vertical dividers to visualize higher-timeframe structure while executing on lower-timeframe setups — ideal for confluence traders combining HTF bias with LTF precision.

HTF Session Boxes H4 > H2 > H1HTF Session Boxes H4 > H2 > H1
Visualize higher timeframe candle structures on lower timeframe charts with nested, customizable boxes.
Overview
HTF Session Boxes plots 4-hour, 2-hour, and 1-hour candle ranges as nested boxes directly on your lower timeframe charts (15M and below). This provides instant visual context of higher timeframe structure without switching between different chart timeframes.
Key Features
- Three Timeframe Levels: Simultaneously displays 4H, 2H, and 1H candle boxes
- Nested Design: Boxes are layered inside each other for clear hierarchical structure
- Real-Time Updates: Boxes dynamically adjust as higher timeframe candles develop
Fully Customizable:
-Individual colors and transparency for each timeframe
-Custom border colors, widths, and styles (solid, dashed, dotted)
-Toggle each timeframe on/off independently
Best Use Cases
-Scalping & Day Trading: Maintain awareness of higher timeframe structure while trading lower
timeframes
-Session Analysis: Clearly see 4H session boundaries and internal 2H/1H divisions
-Support/Resistance: Identify key levels where higher timeframe candles open, close, or create
highs/lows
-Multi-Timeframe Confluence: Spot when multiple timeframes align at key price levels

SECTOR ROTATION Sector Rotation Indicator with Auto Chart Symbol
This indicator helps traders track relative performance across multiple indices/sectors simultaneously, making it easy to identify sector rotation and market leadership.
Key Features:
✅ 21 Symbols Tracking: Monitor 20 customizable symbols + your current chart symbol automatically(DIVIDEND SYMBOL)
✅ Percentage Performance: All moving averages show percentage gain/loss from 1 timeframe period ago
✅ Color-Coded Visualization: Heat map coloring (red to green) based on relative performance ranking
✅ Flexible Timeframes: Works on any timeframe from 1-minute to 12-month charts
✅ Performance Table: Quick-view table showing candle performance with inside/outside bar detection
✅ Indian Market Ready: Pre-configured with NSE indices (NIFTY, BANKNIFTY, and sectoral indices)
Default Symbols (Customizable):
NIFTY, CNXSMALLCAP, CNXMIDCAP, BANKNIFTY
Sector indices: IT, AUTO, PHARMA, METAL, ENERGY, FMCG, etc.
Plus your current chart symbol (automatically added)
How It Works:
Select your preferred timeframe (1D, 1W, 1M, etc.)
The indicator calculates percentage performance from given period ago
Moving averages show smoothed performance trends
Colors indicate relative strength: Green = outperformers, Red = underperformers
Perfect For:
Sector rotation analysis
Relative strength comparison
Market breadth assessment
Index/ETF traders
Swing and position traders
Settings:
Adjustable MA length (default: 20)
Customizable colors and table position
Show/hide percentage labels
Horizontal or vertical table layout
This is not any buy or sell signal or recommendation, consult with your advisor first.

Buyside & Sellside Liquidity The Buyside & Sellside Liquidity Indicator is an advanced Smart Money Concepts (SMC) tool that automatically detects and visualizes liquidity zones and liquidity voids (imbalances) directly on the chart.
🟢 Function and meaning:
1. Buyside Liquidity (green):
Highlights price zones above current price where short traders’ stop-loss orders are likely resting.
When price sweeps these areas, it often indicates a liquidity grab or stop hunt.
👉 These zones are labeled with 💵💰 emojis for a clear visual cue where smart money collects liquidity.
2. Sellside Liquidity (red):
Highlights zones below the current price where long traders’ stop-losses are likely placed.
Once breached, these often signal a potential reversal upward.
👉 The 💵💰🪙 emojis make these liquidity targets visually intuitive on the chart.
3. Liquidity Voids (bright areas):
Indicate inefficient price areas, where the market moved too quickly without filling orders.
These zones are often revisited later as the market seeks balance (fair value).
👉 Shown as light shaded boxes with 💰 emojis to emphasize imbalance regions.
💡 Usage:
• Helps spot smart money manipulation and stop hunts.
• Marks potential reversal or breakout zones.
• Great for traders applying SMC, ICT, or Fair Value Gap strategies.
✨ Highlight:
Dollar and money bag emojis (💵💰🪙💸) are integrated directly into chart labels to create a clear and visually engaging representation of liquidity areas.

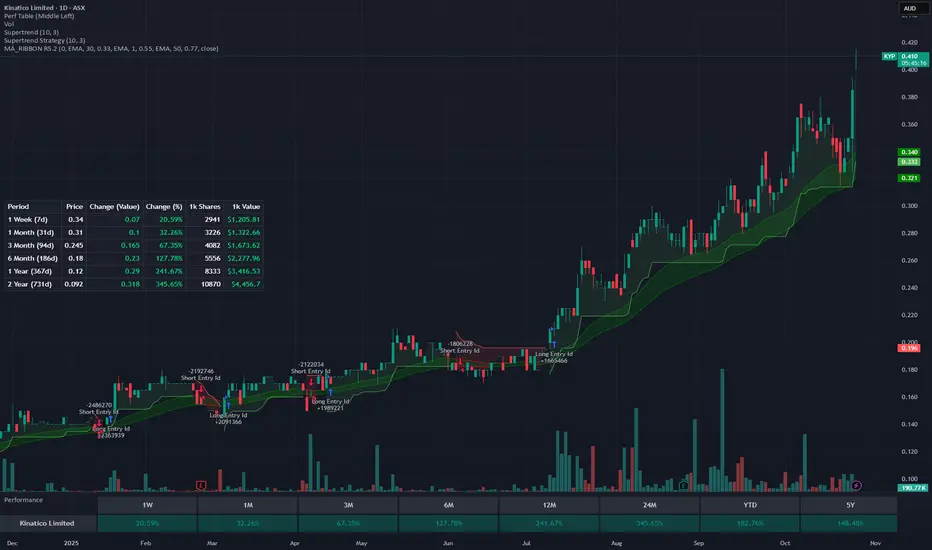
Rolling Performance Metrics TableRolling Performance Metrics Table
A clean, customizable table overlay that displays rolling performance metrics across multiple time periods. Perfect for quickly assessing price momentum and performance trends at a glance.
FEATURES:
- Displays performance across 5 time periods: 1 Week, 3 Month, 6 Month, 1 Year, and 2 Year
- Shows historical price at the start of each period
- Calculates both absolute price change and percentage change
- Color-coded results: Green for positive performance, Red for negative performance
- Fully transparent design with no background or borders - text floats cleanly over your chart
- Customizable table position (9 placement options)
DISPLAY COLUMNS:
1. Period - The lookback timeframe
2. Price - The historical price at the start of the period
3. Change (Value) - Absolute price change from the period start
4. Change (%) - Percentage return over the period
CUSTOMIZATION:
- Adjust the number of bars for each period (default: 1 Week = 5 bars, 3 Month = 63 bars, 6 Month = 126 bars, 1 Year = 252 bars, 2 Year = 504 bars)
- Choose from 9 table positions: Top, Middle, Bottom combined with Left, Center, Right
- Default position: Middle Left
USAGE:
Perfect for traders who want to quickly assess momentum across multiple timeframes. The transparent overlay design ensures minimal obstruction of chart analysis while providing critical performance data at a glance.
NOTE:
- The table only appears on the last bar of your chart
- Customize bar counts in settings to match your specific timeframe needs (e.g., daily vs hourly charts)
- "N/A" appears when historical data is insufficient for the selected period
Institutional Zones: Opening & Closing Trend HighlightsDescription / Content:
Track key institutional trading periods on Nifty/Bank Nifty charts with dynamic session zones:
Opening Volatility Zone: 9:15 AM – 9:45 AM IST (Green)
Closing Institutional Zone: 1:30 PM – 3:30 PM IST (Orange)
Both zones are bounded by the day’s high and low to help visualize institutional activity and price behavior.
Key Observations:
Breakout in both closing trend and opening trends often occurs on uptrending days.
Breakdown in both closing range and opening range usually happens on downside trending days.
Price opening above the previous closing trend is often a sign of a strong opening.
This script helps traders identify trend strength, breakout/breakdown zones, and institutional participation during critical market hours.
Disclaimer:
This indicator is for educational and informational purposes only. It is not a financial advice or recommendation to buy or sell any instrument. Always confirm with your own analysis before taking any trade.
Pine Script Features:
Dynamic boxes for opening and closing sessions
Boxes adjust to the day’s high and low
Optional labels at session start
Works on intraday charts (1m, 5m, 15m, etc.)
Usage Tip:
Use this indicator in combination with trend analysis and volume data to spot strong breakout/breakdown opportunities in Nifty and Bank Nifty.

TriAnchor Elastic Reversion US Market SPY and QQQ adaptedSummary in one paragraph
Mean-reversion strategy for liquid ETFs, index futures, large-cap equities, and major crypto on intraday to daily timeframes. It waits for three anchored VWAP stretches to become statistically extreme, aligns with bar-shape and breadth, and fades the move. Originality comes from fusing daily, weekly, and monthly AVWAP distances into a single ATR-normalized energy percentile, then gating with a robust Z-score and a session-safe gap filter.
Scope and intent
• Markets: SPY QQQ IWM NDX large caps liquid futures liquid crypto
• Timeframes: 5 min to 1 day
• Default demo: SPY on 60 min
• Purpose: fade stretched moves only when multi-anchor context and breadth agree
• Limits: strategy uses standard candles for signals and orders only
Originality and usefulness
• Unique fusion: tri-anchor AVWAP energy percentile plus robust Z of close plus shape-in-range gate plus breadth Z of SPY QQQ IWM
• Failure mode addressed: chasing extended moves and fading during index-wide thrusts
• Testability: each component is an input and visible in orders list via L and S tags
• Portable yardstick: distances are ATR-normalized so thresholds transfer across symbols
• Open source: method and implementation are disclosed for community review
Method overview in plain language
Base measures
• Range basis: ATR(length = atr_len) as the normalization unit
• Return basis: not used directly; we use rank statistics for stability
Components
• Tri-Anchor Energy: squared distances of price from daily, weekly, monthly AVWAPs, each divided by ATR, then summed and ranked to a percentile over base_len
• Robust Z of Close: median and MAD based Z to avoid outliers
• Shape Gate: position of close inside bar range to require capitulation for longs and exhaustion for shorts
• Breadth Gate: average robust Z of SPY QQQ IWM to avoid fading when the tape is one-sided
• Gap Shock: skip signals after large session gaps
Fusion rule
• All required gates must be true: Energy ≥ energy_trig_prc, |Robust Z| ≥ z_trig, Shape satisfied, Breadth confirmed, Gap filter clear
Signal rule
• Long: energy extreme, Z negative beyond threshold, close near bar low, breadth Z ≤ −breadth_z_ok
• Short: energy extreme, Z positive beyond threshold, close near bar high, breadth Z ≥ +breadth_z_ok
What you will see on the chart
• Standard strategy arrows for entries and exits
• Optional short-side brackets: ATR stop and ATR take profit if enabled
Inputs with guidance
Setup
• Base length: window for percentile ranks and medians. Typical 40 to 80. Longer smooths, shorter reacts.
• ATR length: normalization unit. Typical 10 to 20. Higher reduces noise.
• VWAP band stdev: volatility bands for anchors. Typical 2.0 to 4.0.
• Robust Z window: 40 to 100. Larger for stability.
• Robust Z entry magnitude: 1.2 to 2.2. Higher means stronger extremes only.
• Energy percentile trigger: 90 to 99.5. Higher limits signals to rare stretches.
• Bar close in range gate long: 0.05 to 0.25. Larger requires deeper capitulation for longs.
Regime and Breadth
• Use breadth gate: on when trading indices or broad ETFs.
• Breadth Z confirm magnitude: 0.8 to 1.8. Higher avoids fighting thrusts.
• Gap shock percent: 1.0 to 5.0. Larger allows more gaps to trade.
Risk — Short only
• Enable short SL TP: on to bracket shorts.
• Short ATR stop mult: 1.0 to 3.0.
• Short ATR take profit mult: 1.0 to 6.0.
Properties visible in this publication
• Initial capital: 25000USD
• Default order size: Percent of total equity 3%
• Pyramiding: 0
• Commission: 0.03 percent
• Slippage: 5 ticks
• Process orders on close: OFF
• Bar magnifier: OFF
• Recalculate after order is filled: OFF
• Calc on every tick: OFF
• request.security lookahead off where used
Realism and responsible publication
• No performance claims. Past results never guarantee future outcomes
• Fills and slippage vary by venue
• Shapes can move during bar formation and settle on close
• Standard candles only for strategies
Honest limitations and failure modes
• Economic releases or very thin liquidity can overwhelm mean-reversion logic
• Heavy gap regimes may require larger gap filter or TR-based tuning
• Very quiet regimes reduce signal contrast; extend windows or raise thresholds
Open source reuse and credits
• None
Strategy notice
Orders are simulated by TradingView on standard candles. request.security uses lookahead off where applicable. Non-standard charts are not supported for execution.
Entries and exits
• Entry logic: as in Signal rule above
• Exit logic: short side optional ATR stop and ATR take profit via brackets; long side closes on opposite setup
• Risk model: ATR-based brackets on shorts when enabled
• Tie handling: stop first when both could be touched inside one bar
Dataset and sample size
• Test across your visible history. For robust inference prefer 100 plus trades.

FluxGate Daily Swing StrategySummary in one paragraph
FluxGate treats long and short as different ecosystems. It runs two independent engines so the long side can be bold when the tape rewards upside persistence while the short side can stay selective when downside is messy. The core reads three directional drivers from price geometry then removes overlap before gating with clean path checks. The complementary risk module anchors stop distance to a higher timeframe ATR so a unit means the same thing on SPY and BTC. It can add take profit breakeven and an ATR trail that only activates after the trade earns it. If a stop is hit the strategy can re enter in the same direction on the next bar with a daily retry cap that you control. Add it to a clean chart. Use defaults to see the intended behavior. For conservative workflows evaluate on bar close.
Scope and intent
• Markets. Large cap equities and liquid ETFs major FX pairs US index futures and liquid crypto pairs
• Timeframes. From one minute to daily
• Default demo in this publication. SPY on one day timeframe
• Purpose. Reduce false starts without missing sustained trends by fusing independent drivers and suppressing activity when the path is noisy
• Limits. This is a strategy. Orders are simulated on standard candles. Non standard chart types are not supported for execution
Originality and usefulness
• Unique fusion. FluxGate extracts three drivers that look at price from different angles. Direction measures slope of a smoothed guide and scales by realized volatility so a point of slope does not mean a different thing on different symbols. Persistence looks at short sign agreement to reward series of closes that keep direction. Curvature measures the second difference of a local fit to wake up during convex pushes. These three are then orthonormalized so a strong reading in one does not double count through another.
• Gates that matter. Efficiency ratio prefers direct paths over treadmills. Entropy turns up versus down frequency into an information read. Light fractal cohesion punishes wrinkly paths. Together they slow the system in chop and allow it to open up when the path is clean.
• Separate long and short engines. Threshold tilts adapt to the skew of score excursions. That lets long engage earlier when upside distribution supports it and keeps short cautious where downside surprise and venue frictions are common.
• Practical risk behavior. Stops are ATR anchored on a higher timeframe so the unit is portable. Take profit is expressed in R so two R means the same concept across symbols. Breakeven and trailing only activate after a chosen R so early noise does not squeeze a good entry. Re entry after stop lets the system try again without you babysitting the chart.
• Testability. Every major window and the aggression controls live in Inputs. There is no hidden magic number.
Method overview in plain language
Base measures
• Return basis. Natural log of close over prior close for stability and easy aggregation through time. Realized volatility is the standard deviation of returns over a moving window.
• Range basis for risk. ATR computed on a higher timeframe anchor such as day week or month. That anchor is steady across venues and avoids chasing chart specific quirks.
Components
• Directional intensity. Use an EMA of typical price as a guide. Take the day to day slope as raw direction. Divide by realized volatility to get a unit free measure. Soft clip to keep outliers from dominating.
• Persistence. Encode whether each bar closed up or down. Measure short sign agreement so a string of higher closes scores better than a jittery sequence. This favors push continuity without guessing tops or bottoms.
• Curvature. Fit a short linear regression and compute the second difference of the fitted series. Strong curvature flags acceleration that slope alone may miss.
• Efficiency gate. Compare net move to path length over a gate window. Values near one indicate direct paths. Values near zero indicate treadmill behavior.
• Entropy gate. Convert up versus down frequency into a probability of direction. High entropy means coin toss. The gate narrows there.
• Fractal cohesion. A light read of path wrinkliness relative to span. Lower cohesion reduces the urge to act.
• Phase assist. Map price inside a recent channel to a small signed bias that grows with confidence. This helps entries lean toward the right half of the channel without becoming a breakout rule.
• Shock control. Compare short volatility to long volatility. When short term volatility spikes the shock gate temporarily damps activity so the system waits for pressure to normalize.
Fusion rule
• Normalize the three drivers after removing overlap
• Blend with weights that adapt to your aggression input
• Multiply by the gates to respect path quality
• Smooth just enough to avoid jitter while keeping timing responsive
• Compute an adaptive mean and deviation of the score and set separate long and short thresholds with a small tilt informed by skew sign
• The result is one long score and one short score that can cross their thresholds at different times for the same tape which is a feature not a bug
Signal rule
• A long suggestion appears when the long score crosses above its long threshold while all gates are active
• A short suggestion appears when the short score crosses below its short threshold while all gates are active
• If any required gate is missing the state is wait
• When a position is open the status is in long or in short until the complementary risk engine exits or your entry mode closes and flips
Inputs with guidance
Setup Long
• Base length Long. Master window for the long engine. Typical range twenty four to eighty. Raising it improves selectivity and reduces trade count. Lowering it reacts faster but can increase noise
• Aggression Long. Zero to one. Higher values make thresholds more permissive and shorten smoothing
Setup Short
• Base length Short. Master window for the short engine. Typical range twenty eight to ninety six
• Aggression Short. Zero to one. Lower values keep shorts conservative which is often useful on upward drifting symbols
Entries and UI
• Entry mode. Both or Long only or Short only
Complementary risk engine
• Enable risk engine. Turns on bracket exits while keeping your signal logic untouched
• ATR anchor timeframe. Day Week or Month. This sets the structural unit of stop distance
• ATR length. Default fourteen
• Stop multiple. Default one point five times the anchor ATR
• Use take profit. On by default
• Take profit in R. Default two R
• Breakeven trigger in R. Default one R
Usage recipes
Intraday trend focus
• Entry mode Both
• ATR anchor Week
• Aggression Long zero point five Aggression Short zero point three
• Stop multiple one point five Take profit two R
• Expect fewer trades that stick to directional pushes and skip treadmill noise
Intraday mean reversion focus
• Session windows optional if you add them in your copy
• ATR anchor Day
• Lower aggression both sides
• Breakeven later and trailing later so the first bounce has room
• This favors fade entries that still convert into trends when the path stays clean
Swing continuation
• Signal timeframe four hours or one day
• Confirm timeframe one day if you choose to include bias
• ATR anchor Week or Month
• Larger base windows and a steady two R target
• This accepts fewer entries and aims for larger holds
Properties visible in this publication
• Initial capital 25.000
• Base currency USD
• Default order size percent of equity value three - 3% of the total capital
• Pyramiding zero
• Commission zero point zero three percent - 0.03% of total capital
• Slippage five ticks
• Process orders on close off
• Recalculate after order is filled off
• Calc on every tick off
• Bar magnifier off
• Any request security calls use lookahead off everywhere
Realism and responsible publication
• No performance promises. Past results never guarantee future outcomes
• Fills and slippage vary by venue and feed
• Strategies run on standard candles only
• Shapes can update while a bar is forming and settle on close
• Keep risk per trade sensible. Around one percent is typical for study. Above five to ten percent is rarely sustainable
Honest limitations and failure modes
• Sudden news and thin liquidity can break assumptions behind entropy and cohesion reads
• Gap heavy symbols often behave better with a True Range basis for risk than a simple range
• Very quiet regimes can reduce score contrast. Consider longer windows or higher thresholds when markets sleep
• Session windows follow the exchange time of the chart if you add them
• If stop and target can both be inside a single bar this strategy prefers stop first to keep accounting conservative
Open source reuse and credits
• No reused open source beyond public domain building blocks such as ATR EMA and linear regression concepts
Legal
Education and research only. Not investment advice. You are responsible for your decisions. Test on history and in simulation with realistic costs

Smart Money Dynamics Blocks - Pearson MatrixSmart Money Dynamics Blocks — Pearson Matrix
A structural fusion of Prime Number Theory, Pearson Correlation, and Cumulative Delta Geometry.
1. Mathematical Foundation
This indicator is built on the intersection of Prime Number Theory and the Pearson correlation coefficient, creating a structural framework that quantifies how price and time evolve together.
Prime numbers — unique, indivisible, and irregular — are used here as nonlinear time intervals. Each prime length (2, 3, 5, 7, 11…97) represents a regression horizon where correlation is measured between price and time. The result is a multi-scale correlation lattice — a geometric matrix that captures hidden directional strength and temporal bias beyond traditional moving averages.
2. The Pearson Matrix Logic
For every prime interval p, the indicator calculates the linear correlation:
r_p = corr(price, bar_index, p)
Each r_p reflects how closely price and time move together across a prime-defined window. All r_p values are then averaged to create avgR, a single adaptive coefficient summarizing overall structural coherence.
- When avgR > 0.8 → strong positive correlation (labeled R+).
- When avgR < -0.8 → strong negative correlation (labeled R−).
This approach gives a mathematically grounded definition of trend — one that isn’t based on pattern recognition, but on measurable correlation strength.
3. Sequential Prime Slope and Median Pivot
Using the ordered sequence of 25 prime intervals, the model computes sequential slopes between adjacent primes. These slopes represent the rate of change of structure between two prime scales. A robust median aggregator smooths the slopes, producing a clean, stable directional vector.
The system anchors this slope to the 41-bar pivot — the median of the first 25 primes — serving as the geometric midpoint of the prime lattice. The resulting yellow line on the chart is not an ordinary regression line; it’s a dynamic prime-slope function, adapting continuously with correlation feedback.
4. Regression-Style Parallel Bands
Around this prime-slope line, the indicator constructs parallel bands using standard deviation envelopes — conceptually similar to a regression channel but recalculated through the prime–Pearson matrix.
These bands adjust dynamically to:
- Volatility, via standard deviation of residuals.
- Correlation strength, via avgR sign weighting.
Together, they visualize statistical deviation geometry, making it easier to observe symmetry, expansion, and contraction phases of price structure.
5. Volume and Cumulative Delta Peaks
Below the geometric layer, the indicator incorporates a custom lower-timeframe volume feed — by default using 15-second data (custom_tf_input_volume = “15S”). This allows precise delta computation between up-volume and down-volume even on higher timeframe charts.
From this feed, the indicator accumulates delta over a configurable period (default: 100 bars). When cumulative delta reaches a local maximum or minimum, peak and trough markers appear, showing the precise bar where buying or selling pressure statistically peaked.
This combination of geometry and order flow reveals the intersection of market structure and energy — where liquidity pressure expresses itself through mathematical form.
6. Chart Interpretation
The primary chart view represents the live execution of the indicator. It displays the relationship between structural correlation and volume behavior in real time.
Orange “R+” and blue “R−” labels indicate regions of strong positive or negative Pearson correlation across the prime matrix. The yellow median prime-slope line serves as the structural backbone of the indicator, while green and red parallel bands act as dynamic regression boundaries derived from the underlying correlation strength. Peaks and troughs in cumulative delta — displayed as numerical annotations — mark statistically significant shifts in buying and selling pressure.
The secondary visualization (Prime Regression Concept) expands on this by illustrating how regression behavior evolves across prime intervals. Each colored regression fan corresponds to a prime number window (2, 3, 5, 7, …, 97), demonstrating how multiple regression lines would appear if drawn independently. The indicator integrates these into one unified geometric model — eliminating the need to plot tens of regression lines manually. It’s a conceptual tool to help visualize the internal logic: the synthesis of many small-scale regressions into a single coherent structure.
7. Interpretive Insight
This model is not a prediction tool; it’s an instrument of mathematical observation. By translating price dynamics into a prime-structured correlation space, it reveals how coherence unfolds through time — not as a forecast, but as a measurable evolution of structure.
It unifies three analytical domains:
- Prime distribution — defines a nonlinear temporal architecture.
- Pearson correlation — quantifies statistical cohesion.
- Cumulative delta — expresses behavioral imbalance in order flow.
The synthesis creates a geometric analysis of liquidity and time — where structure meets energy, and where the invisible rhythm of market flow becomes measurable.
8. Contribution & Feedback
Share your observations in the comments:
- The time gap and alternation between R+ and R− clusters.
- How different timeframes change delta sensitivity or reveal compression/expansion.
- Prime intervals/clusters that tend to sit near turning points or liquidity shifts.
- How avgR behaves across assets or regimes (trending, ranging, high-vol).
- Notable interactions with the parallel bands (touches, breaks, mean-revert).
Your field notes help others read the model more effectively and compare contexts.
Summary
- Primes define the structure.
- Pearson quantifies coherence.
- Slope median stabilizes geometry.
- Regression bands visualize deviation.
- Cumulative delta locates imbalance.
Together, they construct a framework where mathematics meets market behavior.

Wolfe Waves [BigBeluga]🔵 OVERVIEW
The Wolfe Waves pattern was first introduced by Bill Wolfe , a trader and analyst in the 1980s–1990s who specialized in market geometry and natural rhythm cycles. Wolfe observed that price often forms symmetrical wave structures that anticipate equilibrium points where supply and demand meet. These formations, called Wolfe Waves , gained popularity as a reliable pattern for forecasting both short- and long-term reversals.
The Wolfe Waves indicator automatically detects these patterns in real time. It tracks sequences of five pivots (points 1 through 5) and connects them with wave lines. Users can select either Bullish or Bearish Wolfe Waves depending on their trading bias. When the pattern fails, the lines automatically turn red to highlight invalidation.
🔵 CONCEPTS
Five-Point Structure – Wolfe Waves are defined by five pivots (1–5), which together form the basis of the wave pattern.
Bullish Pattern – Occurs when price compresses downward into point 5, signaling a potential upside reversal.
Bearish Pattern – Occurs when price extends upward into point 5, forecasting a downside reversal.
Validation & Failure – The pattern is considered valid once all five pivots form; if price fails to respect the expected breakout, the indicator marks the structure as broken with red lines.
🔵 FEATURES
Automatic detection of Bullish and Bearish Wolfe Waves.
Labels each pivot (1–5) on the chart for clarity.
Draws connecting lines between pivots to visualize the wave structure.
Projects target/dashed lines (EPA/ETA) based on Wolfe Wave geometry.
Lines automatically turn red when the pattern is broken, giving immediate feedback.
Customizable color scheme for bullish (lime) and bearish (orange) waves.
Adjustable sensitivity for pivot detection.
🔵 HOW TO USE
Choose between Bullish or Bearish mode depending on your analysis.
Watch for the formation of all five pivots; the indicator labels them clearly.
Look for potential entries near point 5, with the expectation that price will travel toward the projected EPA line.
Use invalidation (lines turning red) as a risk management warning to exit failed setups.
Combine with momentum, volume, or higher-timeframe analysis to increase reliability.
🔵 CONCLUSION
The Wolfe Waves brings the classic Wolfe Wave theory into an automated TradingView tool. Inspired by Bill Wolfe’s original concept of natural market cycles, this indicator detects, labels, and validates Wolfe Waves in real time. With automatic invalidation marking and customizable settings, it offers traders a structured way to harness one of the most well-known geometric reversal patterns.

Aktien Spike Detector by DavidDescription:
This indicator marks the daily high and low on the chart and provides a visual and audible alert whenever the current price touches either of these levels. Additionally, the indicator highlights the candlestick that reaches the daily high or low to quickly identify significant market movements or potential reversal points.
Features:
📈 Daily high and low are automatically calculated and displayed as lines on the chart.
🔔 Alert notification when the price touches the daily high or low.
🕯️ Highlighting of the touch candlestick (e.g., color-coded) for better visual orientation.
💡 Ideal for traders trading breakouts, rejections, or intraday reversals.
Areas of application:
Perfect for day traders, scalpers, and intraday analysts who want to see precisely when the market reaches key daily levels.
GpPa - Φ Frames (V5.0.1)# GpPa — Φ Frames (V5.0.1)
**What it does**
This tool overlays nine “Phi Frames” on your chart. Each frame builds a dynamic price **box** from the **highest high** and **lowest low** over a user-defined lookback on a fixed timeframe. The boxes help you read structure, extremes, and balance zones across multiple scales in one view. No signals are generated.
**How it works (simple)**
* For every frame, the script requests data at a fixed resolution (e.g., 1D, 610m, 233m, 89m, etc.).
* It scans the last *N* bars at that resolution (your input).
* It draws a box from the start of that window to the current time, bounded by the window’s high and low.
* Optional “Re-Analysis Zone” guides project a vertical line into the future at a user-set offset, giving you a planning marker.
**Frames included**
* **M1** – 1D resolution (default length 258 bars)
* **M2** – 1D resolution (default length 160 bars)
* **M3** – 610-minute resolution (default length 233 bars)
* **M4** – 233-minute resolution (default length 377 bars)
* **M5** – 89-minute resolution (default length 610 bars)
* **M6** – 34-minute resolution (default length 987 bars)
* **M7** – 13-minute resolution (default length 1597 bars)
* **M8** – 5-minute resolution (default length 2584 bars)
* **M9** – 2-minute resolution (default length 4181 bars)
These durations follow a Fibonacci/Φ scheme. Using multiple frames together reveals confluence and nested ranges.
**Inputs & customization**
* **Per-frame controls:**
* *Length (bars)* — lookback window at the frame’s resolution.
* *Show/Hide* — toggle a frame on or off.
* *Color* — box border color.
* **Re-Analysis Zone (M4, M5, M6):**
* *Offset (bars)* — projects a future reference time from the right edge of the box.
* *Show/Hide* and *Color.*
* The line spans slightly above and below the box (+/-10% of its height) for visibility.
**Tips**
* Start with 2–3 frames to reduce clutter. Add more as needed.
* On lower chart resolutions, higher-timeframe boxes will “step” at their own closes.
* Use frames as context for your own entries, risk, and targets.
* Colors are semi-transparent by design so overlaps remain readable.
**Behavior & notes**
* Boxes update intrabar; values settle when the source timeframe closes.
* No alerts, signals, or strategy logic are included.
* Works on any symbol and timeframe.
* Overlay: **true**.
**Disclaimer**
This tool is for educational and informational purposes only. It is not financial advice. Always do your own research and manage risk.
**Credits**
Pine Script™ v6. © thewayofrichie.

Swing Points & Liquidity — ENHANCED PRO (Dark/Light Mode)This indicator — “Swing Points & Liquidity — ENHANCED PRO (Dark/Light Mode)” — automatically detects and visualizes swing highs, swing lows, and liquidity levels on the chart with rich analytics and customizable visuals.
🔍 Core Features
Smart Swing Detection: Identifies pivot highs/lows based on adjustable left/right bar settings.
Liquidity Visualization: Draws dynamic boxes and lines for liquidity pools and swing zones.
Volume & OI Integration: Filters and colors levels using volume and Open Interest Δ (change).
Strength Meter: Highlights strong liquidity levels with color gradients based on OI + volume intensity.
Automatic Trendlines: Connects swing points with selectable style and width.
Fibonacci Mapping: Automatically projects fib retracements (23.6%, 38.2%, 50%, 61.8%, 78.6%) from swing-to-swing for confluence zones.
Statistics Panel: Displays live metrics — total levels, active/filled count, success rate, and average strength.
Alerts System: Alerts for new swing formations and when price touches or breaks a level.
Multi-Timeframe Option: Analyze swing structures from higher timeframes on any chart.
Dual Theme Mode: Fully optimized for both Dark and Light interface preferences.
⚙️ Advanced Options
Adjustable lookback range
Hide or extend filled levels
Configurable volume and OI thresholds
Supports multiple OI data sources (Binance, BitMEX, Kraken)
Fully dynamic text, color, and label alignment settings
💡 Use Case
Perfect for Smart Money Concept (SMC) and ICT-style analysis, liquidity sweeps, and swing-based trading.
Traders can quickly visualize where liquidity sits, track how it gets filled, and monitor structure shifts in real time.

Image Plotter [theUltimator5]Image Plotter is a visual alerting tool that drops fun, high-contrast ASCII (braille) art (e.g., Rocket, Cat “hang in there”, Babe Ruth, etc.) directly on your price chart when a technical trigger fires. It’s designed for quick, glanceable callouts without cluttering your chart with lines or sub-indicators.
If there are any specific images you would like to be able to add to your plot, please comment with the image you want to see and if it is reasonable, I will add it.
How it works
On each bar close, the script evaluates your selected Trigger Source. When the condition is true, it places a label that contains the selected ASCII art at a configurable offset above or below the candle.
You can choose to only keep the most recent art on the chart, or accumulate every trigger as a historical breadcrumb trail.
Positioning uses either the bar’s high (for above-candle placements) or low (for below-candle placements), then applies your vertical % offset and horizontal bar shift.
Inputs & Controls
Trigger Source
Select which condition will fire the ASCII placement:
RSI Oversold / Overbought — Triggers on cross through the threshold (under/over).
MACD Bullish Cross / Bearish Cross — MACD line crossing the Signal line.
BB Lower Touch / BB Upper Touch — Price crossing below the lower band / above the upper band.
Stochastic Oversold / Overbought — %K crossing through your thresholds.
Volume Spike — Current volume > (Volume MA × Spike Multiplier).
Price Cross MA — Close crossing above the chosen moving average (bullish only).
Custom Condition — Optional user condition (see “Custom Condition” below).
Plot Mode
Latest Only — The indicator deletes the previous label and keeps only the newest trigger on chart.
Every Trigger — Leaves all triggered labels on the chart (historical markers).
Note: TradingView caps the number of labels per script; this indicator sets max_labels_count=500. Heavy triggering can still hit limits.
Practical usage tips
Choose “Latest Only” for cleanliness if your trigger is frequent. Use “Every Trigger” when you want a visual audit trail.
Tune vertical offset by symbol — low-priced tickers may need a smaller %; volatile names may need more spacing.
Quick start
Add the indicator to any chart (any timeframe).
Pick a Trigger Source (e.g., RSI Oversold) and set thresholds/lengths.
Choose ASCII Image, Position Above/Below, Offsets, and Plot Mode.
(Optional) Enable Custom Condition and select your Custom Plot Source.
Create an Alert on “ASCII Trigger Alert” using Once Per Bar Close.
Have a variant you’d like (e.g., bearish MA cross, multi-alert pack by trigger, or time-window filters)? Tell me what workflow you want and I’ll tailor the script/description to match.

Friday & Monday HighlighterFriday & Monday Institutional Range Marker — Know Where Big Firms Set the Trap!
🧠 Description
This indicator automatically highlights Friday and Monday sessions on your chart — days when institutional players and algorithmic firms (like Citadel, Jane Street, or Tower Research) quietly shape the upcoming week’s price structure.
🔍 Why Friday & Monday matter
Friday : Large institutions often book profits or hedge into the weekend. Their final-hour moves reveal the next week’s bias.
Monday : Big players rebuild positions, absorbing liquidity left behind by retail traders.
Together, these two days define the range traps and breakout zones that often control price action until midweek.
> In short, the Friday–Monday high and low often act as invisible walls — guiding scalpers, option sellers, and swing traders alike.
🧩 What this tool does
✅ Highlights Friday (red) and Monday (green) sessions
✅ Adds optional day labels above bars
✅ Works across all timeframes (best on 15min to 1hr charts)
✅ Helps you visually identify where institutions likely built their positions
Use it to quickly spot:
* Range boundaries that trap traders
* Gap zones likely to get filled
* High–low sweeps before reversals
⚙️ Recommended Use
1. Mark Friday’s high–low → Watch for liquidity sweeps on Monday.
2. When Monday holds above Friday’s high , breakout continuation is likely.
3. When Monday fails below Friday’s low , expect a reversal or trap.
4. Combine this with OI shifts, IV crush, and FII–DII flow data for confirmation.
⚠️ Disclaimer
This indicator is for **educational and analytical purposes only**.
It does **not constitute financial advice** or a trading signal.
Markets are dynamic — always perform your own research before trading or investing.

Volume BubblesVolume Bubbles Indicator
Introduction
The Volume Bubbles indicator is a powerful tool designed to visually highlight significant volume spikes on your TradingView charts. It helps traders identify potential areas of whale accumulation (large buying activity) or dumping (large selling activity) by displaying colored bubbles on candles where volume exceeds a customizable threshold. Green bubbles indicate bullish (buy) volume on up candles, suggesting possible accumulation, while red bubbles signal bearish (sell) volume on down candles, indicating potential dumping. The bubble size scales with the volume magnitude, making it easy to spot major market moves at a glance.
This indicator is particularly useful for crypto, forex, and stock traders looking to gauge market sentiment and large player involvement without cluttering the chart. It's built in Pine Script v5 and overlays directly on your price action.
How It Works
The indicator calculates a moving average of volume (default: 20-period SMA) and detects spikes when current volume exceeds this average by a multiplier (default: 2x).
Buy Bubbles (Green): Appear on bullish candles (close >= open) at the low wick, representing potential whale buying or accumulation zones.
Sell Bubbles (Red): Appear on bearish candles (close < open) at the high wick, indicating potential whale selling or dumping zones.
Bubble Size: Dynamically sized based on volume thresholds – huge for >1M, large for 500K-1M, normal for <500K.
Transparency: Increases with volume ratio for better visibility on extreme spikes.
Tooltip:
Hover over a bubble to see detailed info like total volume, average volume, and ratio.
By focusing on these high-volume events, traders can spot key support/resistance levels where whales might be active.
How to Use for Whale Accumulation and Dumping
Whales (large holders) often move markets with high-volume trades. This indicator helps spot them:
Accumulation (Buying): Look for clusters of large green bubbles at price lows or during consolidations. This suggests whales are buying dips, potentially signaling a reversal or uptrend start. Combine with support levels for confirmation.
Dumping (Selling): Watch for big red bubbles at price highs or after rallies. This indicates whales unloading positions, which could lead to downtrends or corrections. Pair with resistance levels.
Tips:
Use on higher timeframes (e.g., 1H+) for reliable signals.
Confirm with other indicators like RSI or MACD to avoid false positives.
In trending markets, buy bubbles in uptrends confirm strength; sell bubbles in downtrends signal continuation.
Credits and Disclaimer
Inspired by volume analysis techniques. This is free to use; feedback welcome! Not financial advice – trade at your own risk.

Digital RPM HUD — 4 Feeds + Confidence + Timeline (v3)🏎️ Digital RPM HUD — 4 Feeds + Confidence + Timeline (v3)
A performance-style trading dashboard for momentum-driven traders.
The Digital RPM HUD gives you an instant visual readout of market “engine speed” — combining four customizable data feeds (Trend, Momentum, Volume, Volatility) into a single confidence score (0–100) and a color-coded timeline of regime changes.
Think of it as a racing-inspired control panel: you only “hit the throttle” when confidence is high and all systems agree.
🔧 Key Features
4 Data Feeds – assign your own logic (EMA, RSI, RVOL, ATR, etc.).
Confidence Meter – blends the four feeds into one smooth 0–100 reading.
Timeline Strip – shows recent bullish / bearish / neutral states at a glance.
Visual Trade Cues – optional on-chart LONG / SHORT / EXIT markers.
Fully Customizable – thresholds, weights, smoothing, colors, layout.
HUD Overlay – clean, minimal, and adjustable to any corner of your chart.
💡 How to Use
Configure each feed to reflect your preferred signals (e.g., trend EMA 200, momentum RSI 14, volume RVOL 20, volatility ATR 14).
Watch the Confidence gauge:
✅ Above Bull Threshold → Market acceleration / long bias.
❌ Below Bear Threshold → Momentum loss / short bias.
⚪ Between thresholds → Neutral zone; stay patient.
Use the Timeline to confirm trend consistency — more green = bullish regime, more red = bearish.
⚙️ Recommended Setups
Scalping: Trend EMA 50 + RSI 7 + RVOL 10 + ATR 7 → Fast response.
Intraday: EMA 200 + RSI 14 + RVOL 20 + ATR 14 → Balanced signal.
Swing: Multi-TF Trend + MACD + RVOL + ATR → Smooth and steady.
⚠️ Disclaimer
This script is not a trading strategy and does not execute trades.
All signals are visual aids — always confirm with your own analysis and risk management.

TradeScope: MA Reversion • RVOL • Trendlines • GAPs • TableTradeScope is an all-in-one technical analysis suite that brings together price action, momentum, volume dynamics, and trend structure into one cohesive and fully customizable indicator.
An advanced, modular trading suite that combines moving averages, reversion signals, RSI/CCI momentum, relative volume, gap detection, trendline analysis, and dynamic tables — all within one powerful dashboard.
Perfect for swing traders, intraday traders, and analysts who want to read price strength, volume context, and market structure in real time.
⚙️ Core Components & Inputs
🧮 Moving Average Settings
Moving Average Type & Length:
Choose between SMA or EMA and set your preferred period for smoother or more reactive trend tracking.
Multi-MA Plotting:
Up to 8 customizable moving averages (each with independent type, color, and length).
Includes a “window filter” to show only the last X bars, reducing chart clutter.
MA Reversion Engine:
Detects when price has extended too far from its moving average.
Reversion Lookback: Number of bars analyzed to determine historical extremes.
Reversion Threshold: Sensitivity multiplier—lower = more frequent signals, higher = stricter triggers.
🔄 Trend Settings
Short-Term & Long-Term Trend Lookbacks:
Uses linear regression to detect the slope and direction of the short- and long-term trend.
Results are displayed in the live table with color-coded bias:
🟩 Bullish | 🟥 Bearish
📈 Momentum Indicators
RSI (Relative Strength Index):
Adjustable period; displays the current RSI value, overbought (>70) / oversold (<30) zones, and trending direction.
CCI (Commodity Channel Index):
Customizable length with color-coded bias:
🟩 Oversold (< -100), 🟥 Overbought (> 100).
Tooltip shows whether the CCI is trending up or down.
📊 Volume Analysis
Relative Volume (RVOL):
Estimates end-of-day projected volume using intraday progress and compares it against the 20-day average.
Displays whether today’s volume is expected to exceed yesterday’s, and highlights color by strength.
Volume Trend (Short & Long Lookbacks):
Visual cues for whether current volume is above or below short-term and long-term averages.
Estimated Full-Day Volume & Multiplier:
Converts raw volume into “X” multiples (e.g., 2.3X average) for quick interpretation.
🕳️ Gap Detection
Automatically identifies and plots bullish and bearish price gaps within a defined lookback period.
Gap Lookback: Defines how far back to search for gaps.
Gap Line Width / Visibility: Controls the thickness and display of gap lines on chart.
Displays the closest open gap in the live table, including its distance from current price (%).
🔍 ATR & Volatility
14-day ATR (% of price):
Automatically converts the Average True Range into a percent, providing quick volatility context:
🟩 Low (<3%) | 🟨 Moderate (3–5%) | 🟥 High (>5%)
💬 Candlestick Pattern Recognition
Auto-detects popular reversal and continuation patterns such as:
Bullish/Bearish Engulfing
Hammer / Hanging Man
Shooting Star / Inverted Hammer
Doji / Harami / Kicking / Marubozu / Morning Star
Each pattern is shown with contextual color coding in the table.
🧱 Pivot Points & Support/Resistance
Optional Pivot High / Pivot Low Labels
Adjustable left/right bar lengths for pivot detection
Theme-aware text and label color options
Automatically drawn diagonal trendlines for both support and resistance
Adjustable line style, color, and thickness
Detects and tracks touches for reliability
Includes breakout alerts (with optional volume confirmation)
🚨 Alerts
MA Cross Alerts:
Triggers when price crosses the fast or slow moving average within a tolerance band (default ±0.3%).
Diagonal Breakout Alerts:
Detects and alerts when price breaks diagonal trendlines.
Volume-Confirmed Alerts:
Filters breakouts where volume exceeds 1.5× the 20-bar average.
🧾 Live Market Table
A fully dynamic table displayed on-chart, customizable via input toggles:
Choose which rows to show (e.g., RSI, ATR, RVOL, Gaps, CCI, Trend, MA info, Diff, Low→Close%).
Choose table position (top-right, bottom-left, etc.) and text size.
Theme selection: Light or Dark
Conditional background colors for instant visual interpretation:
🟩 Bullish or Oversold
🟥 Bearish or Overbought
🟨 Neutral / Moderate
🎯 Practical Uses
✅ Identify confluence setups combining MA reversion, volume expansion, and RSI/CCI extremes.
✅ Track trend bias and gap proximity directly in your dashboard.
✅ Monitor relative volume behavior for intraday strength confirmation.
✅ Automate MA cross or breakout alerts to stay ahead of key price action.
🧠 Ideal For
Swing traders seeking confluence-based setups
Intraday traders monitoring multi-factor bias
Analysts looking for compact market health dashboards
💡 Summary
TradeScope is designed as a single-pane-of-glass market view — combining momentum, trend, volume, structure, and reversion into one clear visual system.
Fully customizable. Fully dynamic.
Use it to see what others miss — clarity, confluence, and confidence in every trade.
