Dual MA Crossover with Profit Targets + Stop-LossChatGPT script and is a dual moving average crossover script with profit targets and stop loss
在腳本中搜尋"chatgpt"

Holding ValueTrading view requires me to add a larger description:
Short done by me: Show your holding value at each candlestick
Chatgpt:
This Pine Script plugin is designed to help traders and investors visualize the current value of their holdings in USD directly on TradingView charts. The plugin calculates the total value of the specified holdings based on the closing price of each candle and displays this value dynamically, formatted to show in thousands (k) or millions (m) with a maximum of two decimal places.
Features
Holdings Input: Allows the user to input the amount of the asset they hold.
Dynamic Calculation: Calculates the current value of holdings based on the closing price of each candle.
Formatted Display: Formats the value in thousands or millions with up to two decimal places.
Chart Label: Displays the formatted value as a label on the chart.
Data Window Display: Uses plotchar to display the current value in the data window without plotting it directly on the chart.

SA Range Rank JNJ.WEEK. 1.15.2026Signal Architect™ — Developer Note
Weekly
These daily posts are intentional.
They are not meant to showcase wins, targets, or outcomes.
They are designed to help viewers observe consistency in market behavior—specifically how structure, range, and reaction repeat across different products and timeframes.
The value is not in catching every move.
The value is in knowing when participation is unnecessary or unsupported.
Signal Architect™ tools are built to help traders avoid low-quality decisions, not to encourage constant activity.
________________________________________
What These Posts Are Demonstrating
Over time, if you observe these posts across equities and futures, you’ll begin to notice:
• The same structural traps repeat across different instruments
• The same reactions occur across multiple timeframes
• The same stop-run and absorption behaviors appear regardless of volatility
That repetition is not coincidence.
It reflects how markets consistently behave, even as prices change.
The goal of these posts is to make that behavior familiar—
because familiarity reduces hesitation, overtrading, and unnecessary loss.
Consistency is not the outcome.
Consistency is the environment.
________________________________________
What You’re Seeing (Public View)
These charts display a limited visual preview of tools within the Signal Architect™ framework.
Only visual context is shown.
Core logic, calculations, thresholds, and execution rules are intentionally not disclosed.
The tools emphasize:
• Market structure over prediction
• Environmental awareness over signals
• Risk framing over reward chasing
Nothing shown publicly is meant to tell you what to trade.
It is meant to help you recognize when not to trade.
________________________________________
Why This Matters
Most losses do not come from being wrong on direction.
They come from participating:
• too early
• too late
• during transitions
• inside structural traps
Signal Architect™ tools are designed to filter those moments out.
In many cases, the highest-value action is:
• standing aside
• reducing size
• waiting for clarity
Saving capital is part of execution.
Avoiding a bad trade is often more valuable than finding a good one.
________________________________________
Background & Scope (Context Only)
Over the years, I’ve developed a wide range of systems and analytical tools spanning:
• Equities
• Futures
• Options structure
• Portfolio construction and allocation logic
This includes extensive work on rule-based, tightly controlled frameworks designed to function across changing market conditions.
None of that internal logic is shared publicly.
These posts exist strictly for education, observation, and pattern recognition—not advice, not signals, and not promises.
________________________________________
🤝 For Those Who Find Value
If these daily posts help you see the market more clearly:
• Follow, boost, and share my scripts, Ideas, and MINDS posts
• Feel free to message me directly with questions or build requests
• Constructive feedback and collaboration are always welcome
For traders who want to go deeper, optional memberships may include:
• Additional signal access
• Early previews
• Occasional free tools and upgrades
🔗 Membership & Signals
trianchor.gumroad.com
________________________________________
⚠️ Final Note
Everything published publicly is educational and analytical only.
Markets carry risk.
Discipline, patience, and risk management always come first.
Watch the consistency.
Study the structure.
Let the market repeat itself.
— Signal Architect™
________________________________________
🔗 Personally Developed GPT Tools
• AuctionFlow GPT
chatgpt.com
• Signal Architect™ Gamma Desk – Market Intelligence
chatgpt.com
• Gamma Squeeze Watchtower™
chatgpt.com
Weekly (W) — Strategic Regime / “Where price is allowed to live”
Goal: Identify the dominant direction + structural permission for the entire week(s).
How to use:
• Treat weekly RECLAIM as regime confirmation, not an entry.
• If weekly prints Bull RECLAIM, favor long participation on lower timeframes until weekly invalidates.
• If weekly prints Bear RECLAIM, same idea but short-biased.
Best behavior to look for:
• 1–2 reclaim signals per month/quarter.
• Use it as a “macro gate.”
Recommended settings (starting point):
• dispMult 1.2–1.6
• reclaimWindow 20–40
• cooldown 8–20
🟣 WEEKLY — Macro Regime & Liquidity Clearing
1️⃣ Range Indicator (RI)
• <30 → long-term compression (energy building)
• >70 → macro expansion (trend regime active)
Use:
Defines whether markets are coiling or trending on a multi-month scale.
________________________________________
2️⃣ ZoneEngine (Structure)
• Identifies macro structural bias
• Explains why certain weekly moves fail or accelerate
Use:
Never fight weekly structure. This is your “market weather.”
________________________________________
3️⃣ Cloud / Reclaim (Behavior)
• Clouds classify regime state, not entries
• Reclaims are informational only on weekly
Use:
Helps label the regime: continuation vs transition.
________________________________________
4️⃣ Stop-Hunt Proxy
• Represents large-scale liquidity clearing
• Often tied to:
o fund rebalancing
o regime shifts
o macro events
Use:
Context only. Weekly stop-hunts explain why a regime changed — they are not trades.

SA CloudRegimes GC.5min 1.12.2026 OVERNIGHTSignal Architect™ — Developer Note
These daily posts are intentional.
They are designed to help potential users visually observe consistency—not just in outcomes, but in process—across multiple futures products, market conditions, and timeframes, using the Stop Hunt Indicator alongside my proprietary Signal Architect™ framework.
The goal is simple:
To show how structure, behavior, and probability repeat—every day—despite a constantly changing market.
If you follow these posts over time, you will begin to recognize that:
• The same behaviors appear across different futures contracts
• The same reactions occur on multiple timeframes
• The same structural traps and stop events repeat regardless of volatility regime
That consistency is not coincidence.
Consistency is the signal.
Over time, that consistency should become familiar—
and familiarity should become your edge.
________________________________________
🧠 What You’re Seeing (And Why It Matters)
This indicator includes a limited visual preview of a proprietary power signal I have personally developed and refined across:
• Futures
• Algorithmic trading systems
• Options structure
• Equity market behavior
Every tool I release is built around one core principle:
Clarity of direction without over-promising or over-fitting.
That is why all Signal Architect™ tools emphasize:
• Market structure first
• High-probability directional context
• Clear, visual risk framing
• No predictive claims
• No curve-fit illusions
What you see publicly is not the full system—only controlled, educational previews meant to demonstrate how structure and probability align in real markets.
________________________________________
📊 Background & Scope
Over the years, I have personally developed 800+ programs, including:
• Equity systems
• Futures strategies
• Options structure tools
• Dividend & income frameworks
• Portfolio construction and allocation logic
This includes 40+ Nasdaq-100 trading bots, several operating under extremely strict rule-sets and controlled deployment conditions.
Nothing shared publicly represents my complete internal framework.
Public posts exist for education, observation, and pattern recognition—not signals, not advice, and not promises.
________________________________________
🤝 For Those Who Find Value
If these daily posts help you see the market more clearly:
• Follow, boost, and share my scripts, Ideas, and MINDS posts
• Feel free to message me directly with questions or build requests
• Constructive feedback and collaboration are always welcome
For traders who want to go deeper, optional memberships may include:
• Additional signal access
• Early previews
• Occasional free tools and upgrades
🔗 Membership & Signals:
trianchor.gumroad.com
________________________________________
⚠️ Final Note
Everything published publicly is educational and analytical only.
Markets carry risk.
Discipline, patience, and risk management always come first.
Watch the consistency.
Study the structure.
Let the market repeat itself.
— Signal Architect™
________________________________________
🔗 Personally Developed GPT Tools
• AuctionFlow GPT
chatgpt.com
• Signal Architect™ Gamma Desk – Market Intelligence
chatgpt.com
• Gamma Squeeze Watchtower™
chatgpt.com
SA CloudRegimes + HLC3 Reclaim + CONF% (VWAP Always-On)
Purpose:
This is a market-regime + trigger engine. It paints cloud zones to show what the market is doing (expanding vs contracting, bullish vs bearish) and then fires reclaim signals when price confirms continuation via HLC3 reclaim + wick reclaim behavior.
What makes it different
VWAP is always enforced (session VWAP when available; otherwise a rolling VWAP proxy).
It separates regime (cloud) from execution (signal).
It gives a real-time confirmation score (CONF%) so you can filter out low-quality setups.
1) The 4 Cloud Zones (Regimes)
Each cloud represents a behavioral state. You don’t “guess direction” inside the cloud — you use the cloud to understand what kind of market you’re in, then you wait for the reclaim trigger.
🟩 GREEN Cloud — Bullish Expansion (Uptrend continuation)
Meaning: Trend is aligned and volatility/energy is expanding upward.
Conditions (conceptually):
Trend stack bullish: SMA3 > SMA8 > SMA20 > SMA50
Price above VWAP
Momentum/pressure supportive: W%R bullish, PFE bullish
Range behavior indicates expansion
How to trade it:
Best for: continuation longs
Wait for: Bull reclaim trigger (triangle up) to enter
Risk: false continuation late in the move (use CONF% + wick gate)
💗 PINK Cloud — Bearish Contraction in an Uptrend (Bull pullback / hedge phase)
Meaning: The market is still in an uptrend, but it is pulling back and compressing (often a hedge/unwind pause before continuation).
Conditions:
Trend still bullish (uptrend stack)
Price remains above VWAP
W%R is oversold, PFE weak → indicating pullback pressure
Range indicates contraction
How to trade it:
Best for: “buy-the-pullback” continuation
Wait for: Bull reclaim trigger after the pullback stabilizes
This is your “reload zone” — don’t long blindly; let reclaim confirm.
🟥 RED Cloud — Bearish Expansion (Downtrend continuation)
Meaning: Trend is aligned bearish and volatility/energy is expanding downward.
Conditions:
Trend stack bearish: SMA3 < SMA8 < SMA20 < SMA50
Price below VWAP
W%R oversold + PFE weak/negative
Range behavior indicates expansion
How to trade it:
Best for: continuation shorts
Wait for: Bear reclaim trigger (triangle down) to enter
Risk: late-stage selling → use CONF% + wick gate.
🟩 (Light Green) Cloud — Bullish Contraction in a Downtrend (Bear pullback / bounce phase)
Meaning: The market is still in a downtrend, but it’s bouncing and compressing (often the pause before continuation lower).
Conditions:
Downtrend stack remains intact
Price remains below VWAP
W%R improving / PFE stabilizing
Range indicates contraction
How to trade it:
Best for: sell-the-bounce continuation
Wait for: Bear reclaim trigger to confirm the bounce is ending.
2) Zone Signals (G / P / R / LG markers)
These are zone-entry markers that fire only on the first bar when a zone turns on.
G = Green Zone started (bull expansion)
P = Pink Zone started (bear contraction inside uptrend)
R = Red Zone started (bear expansion)
LG = Light Green Zone started (bull contraction inside downtrend)
How to use them:
These are context markers, not trade entries.
They tell you: “We just entered a new regime. Now wait for reclaim.”
3) The Actual Trade Triggers: “Reclaim” Signals (RECL triangles)
The triangle “RECL” signals are your execution triggers.
Bull Reclaim (Triangle Up)
Fires only when the system believes the market is in a bullish regime (Green or Pink) and then sees:
A bull candle
A cross back above HLC3
A prior-bar reclaim wick (optional but recommended)
Interpretation:
Pullback resolved → price reclaimed balance (HLC3) → continuation likely.
Bear Reclaim (Triangle Down)
Fires only when the system believes the market is in a bearish regime (Red or Light Green) and then sees:
A bear candle
A cross back below HLC3
A prior-bar reclaim wick (optional)
Interpretation:
Bounce resolved → price lost balance (HLC3) → continuation lower likely.
4) CONF% Bubble (Real-Time Probability Filter)
Whenever a reclaim signal fires, the script calculates a confirmation score (0–100) using weighted factors:
Trend alignment
VWAP alignment
Zone alignment
HLC3 reclaim cross
Wick reclaim gate (if enabled)
W%R alignment
PFE alignment
Default filter
Bubble only prints if CONF% ≥ 40%
You can raise it if you want fewer, cleaner trades:
50–60% = fewer but higher quality
70%+ = very selective
How to use CONF% properly
It’s not “win rate.”
It’s a confluence meter: “How many of my conditions are aligned right now?”
Use it as a trade permission layer.
5) Recommended Workflow (The Correct Way)
Step 1 — Identify the active cloud
Green/ Pink = you’re looking for long continuation
Red/ Light Green = you’re looking for short continuation
Step 2 — Let the pullback finish
Pink and Light Green are pullback/bounce phases.
Don’t jump in — wait.
Step 3 — Take ONLY reclaim triggers
Triangle up/down is your “go” signal.
Step 4 — Use CONF% to filter
If CONF% is low, skip.
If CONF% is strong, you have confluence.
6) Best Timeframes (Practical)
This tool works on many charts, but it shines where regimes develop clearly.
Best (most stable)
15m
1H
2H
4H
Faster (more signals, more noise)
3m / 5m can work, but you’ll need:
tighter tickSize accuracy
slightly looser thresholds
higher CONF% filtering
7) Key Settings You’ll Actually Adjust
If you don’t see many clouds on a timeframe:
Lower pfeBullThresh (ex: 35 → 30)
Lower expansionMin (60 → 55)
Raise contractionMax (35 → 40)
If you see too many weak signals:
Raise minConfirmPct (40 → 50/60)
Keep usePrevWickGate = true
8) Simple Interpretation Cheat Sheet
Green: bull continuation environment → wait for bull reclaim
Pink: pullback in bull trend → best “reload” → wait for bull reclaim
Red: bear continuation environment → wait for bear reclaim
Light Green: bounce in bear trend → best “sell bounce” → wait for bear reclaim

Signal Architect Stop-Hunt !GC HOUR.1.12.2026 AM Signal Architect™ — Developer Note
These daily posts are intentional.
They are designed to help potential users visually observe consistency—not just in outcomes, but in process—across multiple futures products, market conditions, and timeframes, using the Stop Hunt Indicator alongside my proprietary Signal Architect™ framework.
The goal is simple:
To show how structure, behavior, and probability repeat—every day—despite a constantly changing market.
If you follow these posts over time, you will begin to recognize that:
• The same behaviors appear across different futures contracts
• The same reactions occur on multiple timeframes
• The same structural traps and stop events repeat regardless of volatility regime
That consistency is not coincidence.
Consistency is the signal.
Over time, that consistency should become familiar—
and familiarity should become your edge.
________________________________________
🧠 What You’re Seeing (And Why It Matters)
This indicator includes a limited visual preview of a proprietary power signal I have personally developed and refined across:
• Futures
• Algorithmic trading systems
• Options structure
• Equity market behavior
Every tool I release is built around one core principle:
Clarity of direction without over-promising or over-fitting.
That is why all Signal Architect™ tools emphasize:
• Market structure first
• High-probability directional context
• Clear, visual risk framing
• No predictive claims
• No curve-fit illusions
What you see publicly is not the full system—only controlled, educational previews meant to demonstrate how structure and probability align in real markets.
________________________________________
📊 Background & Scope
Over the years, I have personally developed 800+ programs, including:
• Equity systems
• Futures strategies
• Options structure tools
• Dividend & income frameworks
• Portfolio construction and allocation logic
This includes 40+ Nasdaq-100 trading bots, several operating under extremely strict rule-sets and controlled deployment conditions.
Nothing shared publicly represents my complete internal framework.
Public posts exist for education, observation, and pattern recognition—not signals, not advice, and not promises.
________________________________________
🤝 For Those Who Find Value
If these daily posts help you see the market more clearly:
• Follow, boost, and share my scripts, Ideas, and MINDS posts
• Feel free to message me directly with questions or build requests
• Constructive feedback and collaboration are always welcome
For traders who want to go deeper, optional memberships may include:
• Additional signal access
• Early previews
• Occasional free tools and upgrades
🔗 Membership & Signals:
trianchor.gumroad.com
________________________________________
⚠️ Final Note
Everything published publicly is educational and analytical only.
Markets carry risk.
Discipline, patience, and risk management always come first.
Watch the consistency.
Study the structure.
Let the market repeat itself.
— Signal Architect™
________________________________________
🔗 Personally Developed GPT Tools
• AuctionFlow GPT
chatgpt.com
• Signal Architect™ Gamma Desk – Market Intelligence
chatgpt.com
• Gamma Squeeze Watchtower™
chatgpt.com

Signal Architect Stop-Hunt !GC. 15 MIN. 1.12.2026 . AM SESSIONSignal Architect™ — Developer Note
These daily posts are intentional.
They are designed to help potential users visually observe consistency—not just in outcomes, but in process—across multiple futures products, market conditions, and timeframes, using the Stop Hunt Indicator alongside my proprietary Signal Architect™ framework.
The goal is simple:
To show how structure, behavior, and probability repeat—every day—despite a constantly changing market.
If you follow these posts over time, you will begin to recognize that:
• The same behaviors appear across different futures contracts
• The same reactions occur on multiple timeframes
• The same structural traps and stop events repeat regardless of volatility regime
That consistency is not coincidence.
Consistency is the signal.
Over time, that consistency should become familiar—
and familiarity should become your edge.
________________________________________
🧠 What You’re Seeing (And Why It Matters)
This indicator includes a limited visual preview of a proprietary power signal I have personally developed and refined across:
• Futures
• Algorithmic trading systems
• Options structure
• Equity market behavior
Every tool I release is built around one core principle:
Clarity of direction without over-promising or over-fitting.
That is why all Signal Architect™ tools emphasize:
• Market structure first
• High-probability directional context
• Clear, visual risk framing
• No predictive claims
• No curve-fit illusions
What you see publicly is not the full system—only controlled, educational previews meant to demonstrate how structure and probability align in real markets.
________________________________________
📊 Background & Scope
Over the years, I have personally developed 800+ programs, including:
• Equity systems
• Futures strategies
• Options structure tools
• Dividend & income frameworks
• Portfolio construction and allocation logic
This includes 40+ Nasdaq-100 trading bots, several operating under extremely strict rule-sets and controlled deployment conditions.
Nothing shared publicly represents my complete internal framework.
Public posts exist for education, observation, and pattern recognition—not signals, not advice, and not promises.
________________________________________
🤝 For Those Who Find Value
If these daily posts help you see the market more clearly:
• Follow, boost, and share my scripts, Ideas, and MINDS posts
• Feel free to message me directly with questions or build requests
• Constructive feedback and collaboration are always welcome
For traders who want to go deeper, optional memberships may include:
• Additional signal access
• Early previews
• Occasional free tools and upgrades
🔗 Membership & Signals:
trianchor.gumroad.com
________________________________________
⚠️ Final Note
Everything published publicly is educational and analytical only.
Markets carry risk.
Discipline, patience, and risk management always come first.
Watch the consistency.
Study the structure.
Let the market repeat itself.
— Signal Architect™
________________________________________
🔗 Personally Developed GPT Tools
• AuctionFlow GPT
chatgpt.com
• Signal Architect™ Gamma Desk – Market Intelligence
chatgpt.com
• Gamma Squeeze Watchtower™
chatgpt.com

Signal Architect Stop-Hunt GOLD 5MINSignal Architect™ — Developer Note
These daily posts are intentional.
They are designed to help potential users visually observe consistency—not just in outcomes, but in process—across multiple futures products, market conditions, and timeframes, using the Stop Hunt Indicator alongside my proprietary Signal Architect™ framework.
The goal is simple:
To show how structure, behavior, and probability repeat—every day—despite a constantly changing market.
If you follow these posts over time, you will begin to recognize that:
• The same behaviors appear across different futures contracts
• The same reactions occur on multiple timeframes
• The same structural traps and stop events repeat regardless of volatility regime
That consistency is not coincidence.
Consistency is the signal.
Over time, that consistency should become familiar—
and familiarity should become your edge.
________________________________________
🧠 What You’re Seeing (And Why It Matters)
This indicator includes a limited visual preview of a proprietary power signal I have personally developed and refined across:
• Futures
• Algorithmic trading systems
• Options structure
• Equity market behavior
Every tool I release is built around one core principle:
Clarity of direction without over-promising or over-fitting.
That is why all Signal Architect™ tools emphasize:
• Market structure first
• High-probability directional context
• Clear, visual risk framing
• No predictive claims
• No curve-fit illusions
What you see publicly is not the full system—only controlled, educational previews meant to demonstrate how structure and probability align in real markets.
________________________________________
📊 Background & Scope
Over the years, I have personally developed 800+ programs, including:
• Equity systems
• Futures strategies
• Options structure tools
• Dividend & income frameworks
• Portfolio construction and allocation logic
This includes 40+ Nasdaq-100 trading bots, several operating under extremely strict rule-sets and controlled deployment conditions.
Nothing shared publicly represents my complete internal framework.
Public posts exist for education, observation, and pattern recognition—not signals, not advice, and not promises.
________________________________________
🤝 For Those Who Find Value
If these daily posts help you see the market more clearly:
• Follow, boost, and share my scripts, Ideas, and MINDS posts
• Feel free to message me directly with questions or build requests
• Constructive feedback and collaboration are always welcome
For traders who want to go deeper, optional memberships may include:
• Additional signal access
• Early previews
• Occasional free tools and upgrades
🔗 Membership & Signals:
trianchor.gumroad.com
________________________________________
⚠️ Final Note
Everything published publicly is educational and analytical only.
Markets carry risk.
Discipline, patience, and risk management always come first.
Watch the consistency.
Study the structure.
Let the market repeat itself.
— Signal Architect™
________________________________________
🔗 Personally Developed GPT Tools
• AuctionFlow GPT
chatgpt.com
• Signal Architect™ Gamma Desk – Market Intelligence
chatgpt.com
• Gamma Squeeze Watchtower™
chatgpt.com

Signal Architect Stop-Hunt Signal Architect™ — Developer Note
These daily posts are intentional.
They are designed to help potential users visually observe consistency—not just in outcomes, but in process—across multiple futures products, market conditions, and timeframes, using the Stop Hunt Indicator alongside my proprietary Signal Architect™ framework.
The goal is simple:
To show how structure, behavior, and probability repeat—every day—despite a constantly changing market.
If you follow these posts over time, you will begin to recognize that:
• The same behaviors appear across different futures contracts
• The same reactions occur on multiple timeframes
• The same structural traps and stop events repeat regardless of volatility regime
That consistency is not coincidence.
Consistency is the signal.
Over time, that consistency should become familiar—
and familiarity should become your edge.
________________________________________
🧠 What You’re Seeing (And Why It Matters)
This indicator includes a limited visual preview of a proprietary power signal I have personally developed and refined across:
• Futures
• Algorithmic trading systems
• Options structure
• Equity market behavior
Every tool I release is built around one core principle:
Clarity of direction without over-promising or over-fitting.
That is why all Signal Architect™ tools emphasize:
• Market structure first
• High-probability directional context
• Clear, visual risk framing
• No predictive claims
• No curve-fit illusions
What you see publicly is not the full system—only controlled, educational previews meant to demonstrate how structure and probability align in real markets.
________________________________________
📊 Background & Scope
Over the years, I have personally developed 800+ programs, including:
• Equity systems
• Futures strategies
• Options structure tools
• Dividend & income frameworks
• Portfolio construction and allocation logic
This includes 40+ Nasdaq-100 trading bots, several operating under extremely strict rule-sets and controlled deployment conditions.
Nothing shared publicly represents my complete internal framework.
Public posts exist for education, observation, and pattern recognition—not signals, not advice, and not promises.
________________________________________
🤝 For Those Who Find Value
If these daily posts help you see the market more clearly:
• Follow, boost, and share my scripts, Ideas, and MINDS posts
• Feel free to message me directly with questions or build requests
• Constructive feedback and collaboration are always welcome
For traders who want to go deeper, optional memberships may include:
• Additional signal access
• Early previews
• Occasional free tools and upgrades
🔗 Membership & Signals:
trianchor.gumroad.com
________________________________________
⚠️ Final Note
Everything published publicly is educational and analytical only.
Markets carry risk.
Discipline, patience, and risk management always come first.
Watch the consistency.
Study the structure.
Let the market repeat itself.
— Signal Architect™
________________________________________
🔗 Personally Developed GPT Tools
• AuctionFlow GPT
chatgpt.com
• Signal Architect™ Gamma Desk – Market Intelligence
chatgpt.com
• Gamma Squeeze Watchtower™
chatgpt.com

Signal Architect Stop-Hunt Proxy Signal Architect™ — Developer Note
These daily posts are intentional.
They are designed to help potential users visually observe consistency—not just in outcomes, but in process—across multiple futures products, market conditions, and timeframes, using the Stop Hunt Indicator alongside my proprietary Signal Architect™ framework.
The goal is simple:
To show how structure, behavior, and probability repeat—every day—despite a constantly changing market.
If you follow these posts over time, you will begin to recognize that:
• The same behaviors appear across different futures contracts
• The same reactions occur on multiple timeframes
• The same structural traps and stop events repeat regardless of volatility regime
That consistency is not coincidence.
Consistency is the signal.
Over time, that consistency should become familiar—
and familiarity should become your edge.
________________________________________
🧠 What You’re Seeing (And Why It Matters)
This indicator includes a limited visual preview of a proprietary power signal I have personally developed and refined across:
• Futures
• Algorithmic trading systems
• Options structure
• Equity market behavior
Every tool I release is built around one core principle:
Clarity of direction without over-promising or over-fitting.
That is why all Signal Architect™ tools emphasize:
• Market structure first
• High-probability directional context
• Clear, visual risk framing
• No predictive claims
• No curve-fit illusions
What you see publicly is not the full system—only controlled, educational previews meant to demonstrate how structure and probability align in real markets.
________________________________________
📊 Background & Scope
Over the years, I have personally developed 800+ programs, including:
• Equity systems
• Futures strategies
• Options structure tools
• Dividend & income frameworks
• Portfolio construction and allocation logic
This includes 40+ Nasdaq-100 trading bots, several operating under extremely strict rule-sets and controlled deployment conditions.
Nothing shared publicly represents my complete internal framework.
Public posts exist for education, observation, and pattern recognition—not signals, not advice, and not promises.
________________________________________
🤝 For Those Who Find Value
If these daily posts help you see the market more clearly:
• Follow, boost, and share my scripts, Ideas, and MINDS posts
• Feel free to message me directly with questions or build requests
• Constructive feedback and collaboration are always welcome
For traders who want to go deeper, optional memberships may include:
• Additional signal access
• Early previews
• Occasional free tools and upgrades
🔗 Membership & Signals:
trianchor.gumroad.com
________________________________________
⚠️ Final Note
Everything published publicly is educational and analytical only.
Markets carry risk.
Discipline, patience, and risk management always come first.
Watch the consistency.
Study the structure.
Let the market repeat itself.
— Signal Architect™
________________________________________
🔗 Personally Developed GPT Tools
• AuctionFlow GPT
chatgpt.com
• Signal Architect™ Gamma Desk – Market Intelligence
chatgpt.com
• Gamma Squeeze Watchtower™
chatgpt.com

Signal Architect Stop-Hunt ProxySignal Architect™ — Developer Note
These daily posts are intentional.
They are designed to help potential users visually observe consistency—not just in outcomes, but in process—across multiple futures products, market conditions, and timeframes, using the Stop Hunt Indicator alongside my proprietary Signal Architect™ framework.
The goal is simple:
To show how structure, behavior, and probability repeat—every day—despite a constantly changing market.
If you follow these posts over time, you will begin to recognize that:
The same behaviors appear across different futures contracts
The same reactions occur on multiple timeframes
The same structural traps and stop events repeat regardless of volatility regime
That consistency is not coincidence.
Consistency is the signal.
Over time, that consistency should become familiar—
and familiarity should become your edge.
🧠 What You’re Seeing (And Why It Matters)
This indicator includes a limited visual preview of a proprietary power signal I have personally developed and refined across:
Futures
Algorithmic trading systems
Options structure
Equity market behavior
Every tool I release is built around one core principle:
Clarity of direction without over-promising or over-fitting.
That is why all Signal Architect™ tools emphasize:
Market structure first
High-probability directional context
Clear, visual risk framing
No predictive claims
No curve-fit illusions
What you see publicly is not the full system—only controlled, educational previews meant to demonstrate how structure and probability align in real markets.
📊 Background & Scope
Over the years, I have personally developed 800+ programs, including:
Equity systems
Futures strategies
Options structure tools
Dividend & income frameworks
Portfolio construction and allocation logic
This includes 40+ Nasdaq-100 trading bots, several operating under extremely strict rule-sets and controlled deployment conditions.
Nothing shared publicly represents my complete internal framework.
Public posts exist for education, observation, and pattern recognition—not signals, not advice, and not promises.
🤝 For Those Who Find Value
If these daily posts help you see the market more clearly:
Follow, boost, and share my scripts, Ideas, and MINDS posts
Feel free to message me directly with questions or build requests
Constructive feedback and collaboration are always welcome
For traders who want to go deeper, optional memberships may include:
Additional signal access
Early previews
Occasional free tools and upgrades
🔗 Membership & Signals:
trianchor.gumroad.com
⚠️ Final Note
Everything published publicly is educational and analytical only.
Markets carry risk.
Discipline, patience, and risk management always come first.
Watch the consistency.
Study the structure.
Let the market repeat itself.
— Signal Architect™
🔗 Personally Developed GPT Tools
AuctionFlow GPT
chatgpt.com
Signal Architect™ Gamma Desk – Market Intelligence
chatgpt.com
Gamma Squeeze Watchtower™
chatgpt.com

Market Structure Break + RSI ExitSignal Architect™ — Developer Note
This indicator includes a limited visual preview of a proprietary power signal I have personally developed and refined across futures, algorithmic systems, options, and equity trading.
Every tool I release is built with one principle in mind:
clarity of direction without over-promising or under-delivering.
That is why all Signal Architect™ tools emphasize:
Market structure first
High-probability directional context
Clear, visual risk framing
No predictive claims, no curve-fit illusions
What you are seeing here is only a small glimpse of a much broader internal framework I actively use in live environments.
🧠 Background & Scope
Over the years, I have personally developed 800+ programs spanning:
Equities
Futures
Options
Dividend & income systems
Portfolio construction and allocation logic
This includes 40+ Nasdaq-100 trading bots, several of which operate under extremely strict rule-sets and controlled deployment conditions.
Nothing shared publicly represents my full system—only educational and analytical previews designed to demonstrate how structure and probability can be aligned visually.
🤝 Support & Collaboration
If you find value in what I share:
Please subscribe, boost, and share my scripts, Ideas, and MINDS posts
You are always welcome to message me directly with questions or if you need something built or adapted
Constructive feedback and collaboration are encouraged
For traders looking to go deeper, I offer optional memberships that include:
Access to additional signals
Early previews
Occasional free tools and upgrades to support your trading journey
🔗 Membership & Signals:
trianchor.gumroad.com
⚠️ Final Note
Everything published publicly is for educational and analytical purposes only.
Markets carry risk. Discipline and risk management always come first.
— Signal Architect™
You can Find my personally developed GBT below
chatgpt.com
chatgpt.com
chatgpt.com
********************************************************************************************************************WHAT THIS INDICATOR DOES
This indicator is a structure-first breakout engine designed around how price actually transitions between balance and expansion.
It does not predict reversals.
It waits for confirmed market structure breaks, then:
Anchors risk using recent wave extremes
Projects deterministic TP/SL zones
Tracks outcomes visually and statistically
Optionally exits early when momentum exhausts (RSI fade)
This makes it ideal for:
Directional traders
Swing continuation setups
Expansion phases after compression
🧠 CORE SIGNAL ARCHITECT LOGIC
1️⃣ Market Structure Identification
The system uses pivot highs and pivot lows to define true structural levels:
Pivot High break → Long bias
Pivot Low break → Short bias
This avoids:
Random candle breakouts
Intrabar noise
False momentum spikes
Only confirmed structural levels are traded.
2️⃣ Entry Trigger (Structure Break)
A trade is triggered only when price closes through structure:
Direction Requirement
Long Close breaks above last confirmed pivot high
Short Close breaks below last confirmed pivot low
📌 Important:
No signal fires if you are already in a trade — one position at a time, clean sequencing.
3️⃣ Stop-Loss Logic (Wave-Anchored Risk)
Stops are not arbitrary.
They are anchored to:
Recent wave low (for longs)
Recent wave high (for shorts)
This ensures:
Stops sit beyond real market structure
Risk reflects actual auction failure, not candle noise
4️⃣ Take-Profit Logic (Risk × Reward)
Take-profit is mechanically derived:
TP = Risk × Risk:Reward Ratio
Examples:
RR = 1.0 → TP = same distance as SL
RR = 1.5 → TP = 1.5× SL distance
RR = 2.0 → TP = expansion-focused swings
This keeps results comparable, repeatable, and testable.
5️⃣ Optional RSI Exit (Momentum Fade)
RSI is not used for entries.
It is used only as an optional early-exit filter:
Trade RSI Condition
Long RSI crosses down from Overbought
Short RSI crosses up from Oversold
This is designed for:
Reducing give-back during exhaustion
Tight markets where expansion stalls
Volatility contraction environments
🔕 You can disable this entirely for pure structure trading.
📦 VISUAL OUTPUTS
🔲 Risk Boxes (Core Feature)
Every trade plots:
Green box = profit zone
Red box = loss zone
Boxes:
Extend forward bar-by-bar
Stop updating once trade resolves
Allow instant visual expectancy review
🔺 Signal Arrows
Green ▲ = Structure Break Long
Red ▼ = Structure Break Short
No repainting.
No intrabar guessing.
🧮 Performance Stats Table
Tracks:
Total trades
Wins
Losses
Win rate %
📌 This is contextual feedback, not a promise of future results.
🎯 RECOMMENDED TIMEFRAMES (VERY IMPORTANT)
This indicator performs best when structure matters.
⭐ PRIMARY TIMEFRAMES (Recommended)
Timeframe Use Case
15-Minute Intraday structure breaks, clean expansions
30-Minute Session-level continuation
1-Hour Swing structure, reduced noise
2-Hour Institutional rhythm, fewer false breaks
4-Hour Macro structure legs
✔ These timeframes allow pivots to form properly
✔ Stops remain structurally meaningful
✔ RR math stays realistic
⚠️ SECONDARY / CONDITIONAL
Timeframe Notes
5-Minute Use only during trend days
Daily Works well, but slower signal frequency
🚫 NOT RECOMMENDED
Timeframe Why
1–3 Minute Too much pivot distortion
Tick / Seconds Breaks structure logic entirely
This is not a scalping indicator.
🟩 BACKGROUND BIAS SHADING
Green tint → Active long bias
Red tint → Active short bias
No tint → Neutral / flat
This helps:
Avoid over-trading
Stay aligned with active structure
Recognize when the system is waiting
🧠 HOW TO USE THIS CORRECTLY
Best Practices
✔ Trade only in expansion environments
✔ Let pivots form before expecting signals
✔ Respect the stop — it is structurally valid
✔ Journal results per timeframe
Avoid
✘ Forcing trades in chop
✘ Using this as a reversal indicator
✘ Lowering timeframe to “get more signals”
⚠️ IMPORTANT DISCLAIMER
This indicator is for educational and analytical purposes only.
It does not:
Predict markets
Guarantee profits
Replace risk management
Trading involves substantial risk and can result in loss of capital.
Past performance does not guarantee future results.

SA_ORB_ONR_CLOUD_vwapBandsSIGNAL ARCHITECT™ — ORB / ONR Cloud with VWAP Bands
Optimized for the 15-Minute Timeframe
Overview
The Signal Architect™ ORB / ONR Cloud is a session-structure and probability framework designed to help traders understand where price is statistically compressed, transitioning, or escaping value during the regular trading session.
On the 15-minute chart, this study excels at identifying:
High-probability consolidation zones
Early session directional intent
Fade vs continuation environments
Context for VWAP-based mean reversion or trend extension
Rather than predicting price, the indicator classifies market behavior using time-anchored ranges and volume-weighted statistics.
Core Components (15-Minute Context)
1️⃣ Overnight Range (ONR)
The Overnight Range captures price extremes formed before the regular session opens.
On the 15-minute timeframe, ONR acts as:
A higher-timeframe reference level
A source of institutional liquidity memory
A boundary where early session reactions often occur
2️⃣ Opening Range (ORB)
The Opening Range is defined as the first X minutes after the session open (default: 15 minutes).
On a 15-minute chart:
The ORB often forms entirely within a single candle
It represents initial institutional positioning
It helps differentiate initiative vs responsive behavior
3️⃣ ORB–ONR Cloud (Key Feature)
The Cloud is the overlapping area between the Overnight Range and the Opening Range.
This zone is critical on the 15-minute timeframe because it often represents:
Compressed auction
Balance / indecision
Liquidity absorption
Interpretation:
Price inside the cloud → Higher probability of consolidation, fade, or contraction
Price exiting the cloud → Transition toward expansion or trend resolution
The cloud is not a signal — it is a probability environment.
4️⃣ VWAP with Session-Weighted σ Bands
The study plots VWAP starting from the regular session open, along with true volume-weighted standard deviation bands (±1σ, ±2σ).
On the 15-minute timeframe:
VWAP defines fair value
σ bands help distinguish normal rotation vs statistical extension
Interaction with VWAP while inside the cloud often suggests mean-reverting conditions
Interaction with VWAP after leaving the cloud often confirms trend continuation
5️⃣ Breakout Classification (BRK)
A BRK event occurs when price closes outside BOTH:
The Overnight Range
The Opening Range
On the 15-minute chart:
BRK events often mark session regime changes
They are contextual markers, not entries
Arrows are color-matched to the candle (green candle → green arrow, red candle → red arrow)
To avoid clutter, breakouts can be limited to first-occurrence only.
Probability Layer (15-Minute Edge)
The indicator includes rolling probability calculations to quantify market behavior:
📊 Inside-Cloud Probability
Shows how often price remains inside the ORB–ONR cloud over the selected lookback.
Higher values → balance / compression dominant
Lower values → trend / expansion dominant
📉 Fade / Contraction Probability (Inside Cloud)
When price is inside the cloud, the study measures volatility contraction using ATR behavior.
Higher contraction % → Greater likelihood of rotation or fade
Lower contraction % → Cloud acting as launchpad rather than balance
📈 State Occupancy (5-State Model)
Tracks how price distributes its time across:
Above both ranges
Below both ranges
Inside ORB only
Inside ONR only
Inside the Cloud
This helps traders understand where the market statistically prefers to trade on the 15-minute structure.
Best Use Cases (15-Minute Chart)
✔ Contextual bias for intraday swing trades
✔ Identifying fade vs trend conditions
✔ VWAP-based execution alignment
✔ Avoiding low-probability entries inside compression
✔ Session structure awareness without lower-timeframe noise
What This Indicator Is NOT
❌ Not a buy/sell system
❌ Not predictive
❌ Not a guarantee of outcomes
It is a market structure and probability framework — designed to improve decision quality, not replace risk management.
Recommended Settings (15-Minute)
ORB Length: 15 minutes
VWAP Bands: ±1σ / ±2σ
Probability Lookback: 100–200 bars
Breakout Mode: First-occurrence only
Cloud Enabled: Yes
Risk & Compliance Notice
This tool is provided for educational and informational purposes only.
It does not constitute financial advice, investment recommendations, or trade instructions.
All trading involves risk, including the possible loss of capital.
Standalone Signal - trianchor.gumroad.com
chatgpt.com
chatgpt.com
chatgpt.com

SA Trump Volatility Pattern Wick + Volume Shock ReversalDisclaimer (read first)
Educational use only — not financial advice. This script does not provide entries/exits, targets, position sizing, or profit guarantees. Trading (especially options/futures) involves substantial risk and can result in loss of principal (and more for leveraged products). Use at your own discretion.
Best use cases on the 2-Hour timeframe
On 2H, this script becomes a high-signal-quality “shock reversal” detector instead of a noisy candle toy. You’re essentially filtering for:
Large wick rejection
Small real body
Statistically unusual volume (Z-score > threshold)
Context alignment (trend filter + prior bar direction + optional RSI)
What 2H is best for
1) Detecting “event shock” reversals
2H bars often capture:
Macro headlines
Fed commentary
earnings reactions (for equities)
sudden volatility expansions
When the script fires on 2H, it often means:
“Aggressive push happened, liquidity got rejected, and participation was unusually high.”
That’s a structural clue, not a trade instruction.
2) Filtering false breakouts / breakdowns
The wick requirement is basically “failed continuation.”
On 2H, this is powerful around:
prior day highs/lows
weekly pivots
obvious consolidation edges
key moving averages (fast SMA / slow SMA gate)
Bull pattern = flush + reclaim behavior.
Bear pattern = pop + rejection behavior.
3) Options traders: timing “premium exposure windows”
On 2H, this is great for options traders who want to avoid buying premium into a fake move.
BullTrump on 2H can be used as a “don’t chase puts / be cautious short” context shift.
BearTrump on 2H can be used as a “don’t chase calls / be cautious long” context shift.
It’s a “regime hint” for the next few sessions, not a one-bar command.
4) Futures traders: rotation vs continuation framework
A 2H “Trump Candle” often marks:
the end of a liquidation leg
a stop-run / squeeze peak
a pivot moment where the market shifts from impulse to balance
Use it to decide whether you’re in:
continuation mode (trend carries)
or rotation mode (mean-reversion / two-way)
How to use it (2H workflow)
Step A — Keep it strict at first
Recommended defaults for 2H:
wickFracThreshold: 0.40–0.55
bodyMaxFrac: 0.35–0.45
volZThresh: 1.0–1.5
useRSIFilter: ON
RSI bull min / bear max: 45 / 55 (good baseline)
Step B — Treat triggers as “context events”
When it prints, ask 3 questions:
Where did it happen? (key level or random spot)
Was it aligned with trend gate? (SMA fast/slow)
Did volume Z-score spike? (true shock vs normal wick)
Higher quality triggers happen when:
the wick pierces a known level (prior swing / range edge)
and the close re-enters the range
and volume Z-score is meaningfully positive
Step C — Confirm with the next 1–2 candles (optional)
On 2H, it’s reasonable to wait for:
a follow-through close
or a hold above/below fast SMA
or a second “acceptance” candle
You can do this manually without changing code.
Other recommended timeframes (best to worst)
✅ 4H (even cleaner, fewer signals)
Use for:
swing context
multi-day pivots
big reversal points
✅ 1H (more signals, still structured)
Use for:
intraday + overnight context
day-trade bias shifts
✅ 30m (for active traders)
Use for:
tighter responsiveness
more setups
But requires more discretion; noise increases.
⚠️ 15m and below (only if you increase strictness)
If you want to run it on 5m/15m:
raise volZThresh (ex: 1.5–2.0)
raise wickFracThreshold (ex: 0.50–0.65)
lower bodyMaxFrac (ex: 0.25–0.35)
Otherwise it will trigger too often.
Best markets for this script
Works best on:
Index futures: /NQ, /ES (big volume makes Z-score meaningful)
Liquid ETFs: SPY, QQQ
High-volume large caps (AAPL, MSFT, NVDA etc.)
Less reliable on:
thin small caps (volume Z-score gets weird)
low-volume premarket candles
illiquid options underlyings
Signal Inside the Script ✅ SA ZoneEngine Bias Filtered is a market-structure bias and confirmation tool designed for futures To request access: 👉 Purchase here: trianchor.gumroad.com
Best GBT for this indicator
chatgpt.com
chatgpt.com
chatgpt.com

Daily High/Low (15m) + EMA Pre-Market H/L + ORBStraightforward:
I built a swing-trading indicator with ChatGPT that plots 15-minute highs and lows, draws pre-market high/low lines, and adds a 15-minute opening-range breakout feature.
Technical:
Using ChatGPT, I developed a swing-trade indicator that calculates 15-minute highs/lows, overlays pre-market high and low levels, and includes a 15-minute Opening Range Breakout (ORB) module.
Promotional:
I created a ChatGPT-powered swing-trading indicator that maps 15-minute highs/lows, marks pre-market levels, and features a 15-minute Opening Range Breakout for clearer entries.

ATH대비 지정하락률에 도착 시 매수 - 장기홀딩 선물 전략(ATH Drawdown Re-Buy Long Only)본 스크립트는 과거 하락 데이터를 이용하여, 정해진 하락 %가 발생하는 경우 자기 자본의 정해진 %만큼을 진입하게 설계되어진 스트레티지입니다.
레버리지를 사용할 수 있으며 기본적으로 셋팅해둔 값이 내장되어있습니다.(자유롭게 바꿔서 쓰시면 됩니다.) 추가적으로 2번의 진입 외에도 다른 진입 기준, 진입 %를 설정하실 수 있으며 - ChatGPT에게 요청하면 수정해줄 것입니다.
실제 사용용도로는 KillSwitch 기능을 꺼주세요. 바 돋보기 기능을 켜주세요.
ATH Drawdown Re-Buy Long Only 전략 설명
1. 전략 개요
ATH Drawdown Re-Buy Long Only 전략은 자산의 역대 최고가(ATH, All-Time High)를 기준으로 한 하락폭(드로우다운)을 활용하여,
특정 구간마다 단계적으로 롱 포지션을 구축하는 자동 재매수(Long Only) 전략입니다.
본 전략은 다음과 같은 목적을 가지고 설계되었습니다.
급격한 조정 구간에서 체계적인 분할 매수 및 레버리지 활용
ATH를 기준으로 한 명확한 진입 규칙 제공
실시간으로
평단가
레버리지
청산가 추정
계좌 MDD
수익률
등을 시각적으로 제공하여 리스크와 포지션 상태를 직관적으로 확인할 수 있도록 지원
※ 본 전략은 교육·연구·백테스트 용도로 제공되며,
어떠한 형태의 투자 권유 또는 수익을 보장하지 않습니다.
2. 전략의 핵심 개념
2-1. ATH(역대 최고가) 기준 드로우다운
전략은 차트 상에서 항상 가장 높은 고가(High)를 ATH로 기록합니다.
새로운 고점이 형성될 때마다 ATH를 갱신하고, 해당 ATH를 기준으로 다음을 계산합니다.
현재 바의 저가(Low)가 ATH에서 몇 % 하락했는지
현재 바의 종가(Close)가 ATH에서 몇 % 하락했는지
그리고 사전에 설정한 두 개의 드로우다운 구간에서 매수를 수행합니다.
1차 진입 구간: ATH 대비 X% 하락 시
2차 진입 구간: ATH 대비 Y% 하락 시
각 구간은 ATH가 새로 갱신될 때마다 한 번씩만 작동하며,
새로운 ATH가 생성되면 다시 “1차 / 2차 진입 가능 상태”로 초기화됩니다.
2-2. 첫 포지션 100% / 300% 특수 규칙
이 전략의 중요한 특징은 **“첫 포지션 진입 시의 예외 규칙”**입니다.
전략이 현재 어떠한 포지션도 들고 있지 않은 상태에서
최초로 롱 포지션을 진입하는 시점(첫 포지션)에 대해:
기본적으로는 **자산의 100%**를 기준으로 포지션을 구축하지만,
만약 그 순간의 가격이 ATH 대비 설정값 이상(예: 약 –72.5% 이상 하락한 상황) 이라면
→ 자산의 300% 규모로 첫 포지션을 진입하도록 설계되어 있습니다.
이 규칙은 다음과 같이 동작합니다.
첫 진입이 1차 드로우다운 구간에서 발생하든,
첫 진입이 2차 드로우다운 구간에서 발생하든,
현재 하락폭이 설정된 기준 이상(예: –72.5% 이상) 이라면
→ “이 정도 하락이면 첫 진입부터 더 공격적으로 들어간다”는 의미로 300% 규모로 진입
그 이하의 하락폭이라면
→ 첫 진입은 100% 규모로 제한
즉, 전략은 다음 두 가지 모드로 동작합니다.
일반적인 상황의 첫 진입: 자산의 100%
심각한 드로우다운 구간에서의 첫 진입: 자산의 300%
이 특수 규칙은 깊은 하락에서는 공격적으로, 평소에는 상대적으로 보수적으로 진입하도록 설계된 것입니다.
3. 전략 동작 구조
3-1. 매수 조건
차트 상 High 기준으로 ATH를 추적합니다.
각 바마다 해당 ATH에서의 하락률을 계산합니다.
사용자가 설정한 두 개의 드로우다운 구간(예시):
1차 구간: 예를 들어 ATH – 50%
2차 구간: 예를 들어 ATH – 72.5%
각 구간에 대해 다음과 같은 조건을 확인합니다.
“이번 ATH 구간에서 아직 해당 구간 매수를 한 적이 없는 상태”이고,
현재 바의 저가(Low)가 해당 구간 가격 이하를 찍는 순간
→ 해당 바에서 매수 조건 충족으로 간주
실제 주문은:
해당 구간 가격에 맞춰 롱 포지션 진입(리밋/시장가 기반 시뮬레이션) 으로 처리됩니다.
3-2. ATH 갱신과 진입 기회 리셋
차트 상에서 새로운 고점(High)이 기존 ATH를 넘어서는 순간,
ATH가 갱신되고,
1차 / 2차 진입 여부를 나타내는 내부 플래그가 초기화됩니다.
이를 통해, 시장이 새로운 고점을 돌파해 나갈 때마다,
해당 구간에서 다시 한 번씩 1차·2차 드로우다운 진입 기회를 갖게 됩니다.
4. 포지션 사이징 및 레버리지
4-1. 계좌 자산(Equity) 기준 포지션 크기 결정
전략은 현재 계좌 자산을 다음과 같이 정의하여 사용합니다.
현재 자산 = 초기 자본 + 실현 손익 + 미실현 손익
각 진입 구간에서의 포지션 가치는 다음과 같이 결정됩니다.
1차 진입 구간:
“자산의 몇 %를 사용할지”를 설정값으로 입력
설정된 퍼센트를 계좌 자산에 곱한 뒤,
다시 전략 내 레버리지 배수(Leverage) 를 곱하여 실제 포지션 가치를 계산
2차 진입 구간:
동일한 방식으로, 독립된 퍼센트 설정값을 사용
즉, 포지션 가치는 다음과 같이 계산됩니다.
포지션 가치 = 현재 자산 × (해당 구간 설정 % / 100) × 레버리지 배수
그리고 이를 해당 구간의 진입 가격으로 나누어 실제 수량(토큰 단위) 를 산출합니다.
4-2. 첫 포지션의 예외 처리 (100% / 300%)
첫 포지션에 대해서는 위의 일반적인 퍼센트 설정 대신,
다음과 같은 고정 비율이 사용됩니다.
기본: 자산의 100% 규모로 첫 포지션 진입
단, 진입 시점의 ATH 대비 하락률이 설정값 이상(예: –72.5% 이상) 일 경우
→ 자산의 300% 규모로 첫 포지션 진입
이때 역시 다음 공식을 사용합니다.
포지션 가치 = 현재 자산 × (100% 또는 300%) × 레버리지
그리고 이를 가격으로 나누어 실제 진입 수량을 계산합니다.
이 규칙은:
첫 진입이 1차 구간이든 2차 구간이든 동일하게 적용되며,
“충분히 깊은 하락 구간에서는 첫 진입부터 더 크게,
평소에는 비교적 보수적으로” 라는 운용 철학을 반영합니다.
4-3. 실레버리지(Real Leverage)의 추적
전략은 각 바 단위로 다음을 추적합니다.
바가 시작할 때의 기존 포지션 크기
해당 바에서 새로 진입한 수량
이를 바탕으로, 진입이 발생한 시점에 다음을 계산합니다.
실제 레버리지 = (포지션 가치 / 현재 자산)
그리고 차트 상에 예를 들어:
Lev 2.53x 와 같은 형식의 레이블로 표시합니다.
이를 통해, 매수 시점마다 실제 계좌 레버리지가 어느 정도였는지를 직관적으로 확인할 수 있습니다.
5. 시각화 및 모니터링 요소
5-1. 차트 상 시각 요소
전략은 차트 위에 다음과 같은 정보를 직접 표시합니다.
ATH 라인
High 기준으로 계산된 역대 최고가를 주황색 선으로 표시
평단가(평균 진입가) 라인
현재 보유 포지션이 있을 때,
해당 포지션의 평균 진입가를 노란색 선으로 표시
추정 청산가(고정형 청산가) 라인
포지션 수량이 변화하는 시점을 감지하여,
당시의 평단가와 실제 레버리지를 이용해 근사적인 청산가를 계산
이를 빨간색 선으로 차트에 고정 표시
포지션이 없거나 레버리지가 1배 이하인 경우에는 청산가 라인을 제거
매수 마커 및 레이블
1차/2차 매수 조건이 충족될 때마다 해당 지점에 매수 마커를 표시
"Buy XX% @ 가격", "Lev XXx" 형태의 라벨로
진입 비율과 당시 레버리지를 함께 시각화
레이블의 위치는 설정에서 선택 가능:
바 아래 (Below Bar)
바 위 (Above Bar)
실제 가격 위치 (At Price)
5-2. 우측 상단 정보 테이블
차트 우측 상단에는 현재 계좌·포지션 상태를 요약한 정보 테이블이 표시됩니다.
대표적으로 다음 항목들이 포함됩니다.
Pos Qty (Token)
현재 보유 중인 포지션 수량(토큰 기준, 절대값 기준)
Pos Value (USDT)
현재 포지션의 시장 가치 (수량 × 현재 가격)
Leverage (Now)
현재 실레버리지 (포지션 가치 / 현재 자산)
DD from ATH (%)
현재 가격 기준, 최근 ATH에서의 하락률(%)
Avg Entry
현재 포지션의 평균 진입 가격
PnL (%)
현재 포지션 기준 미실현 손익률(%)
Max DD (Equity %)
전략 전체 기간 동안 기록된 계좌 기준 최대 손실(MDD, Max Drawdown)
Last Entry Price
가장 최근에 포지션을 추가로 진입한 직후의 평균 진입 가격
Last Entry Lev
위 “Last Entry Price” 시점에서의 실레버리지
Liq Price (Fixed)
위에서 설명한 고정형 추정 청산가
Return from Start (%)
전략 시작 시점(초기 자본) 대비 현재 계좌 자산의 총 수익률(%)
이 테이블을 통해 사용자는:
현재 계좌와 포지션의 상태
리스크 수준
누적 성과
를 직관적으로 파악할 수 있습니다.
6. 시간 필터 및 라벨 옵션
6-1. 전략 동작 기간 설정
전략은 옵션으로 특정 기간에만 전략을 동작시키는 시간 필터를 제공합니다.
“Use Date Range” 옵션을 활성화하면:
시작 시각과 종료 시각을 지정하여
해당 구간에 한해서만 매매가 발생하도록 제한
옵션을 비활성화하면:
전략은 전체 차트 구간에서 자유롭게 동작
6-2. 진입 라벨 위치 설정
사용자는 매수/레버리지 라벨의 위치를 선택할 수 있습니다.
바 아래 (Below Bar)
바 위 (Above Bar)
실제 가격 위치 (At Price)
이를 통해 개인 취향 및 차트 가독성에 맞추어
시각화 방식을 유연하게 조정할 수 있습니다.
7. 활용 대상 및 사용 예시
본 전략은 다음과 같은 목적에 적합합니다.
현물 또는 선물 롱 포지션 기준 장기·스윙 관점 추매 전략 백테스트
“고점 대비 하락률”을 기준으로 한 규칙 기반 운용 아이디어 검증
레버리지 사용 시
계좌 레버리지·청산가·MDD를 동시에 모니터링하고자 하는 경우
특정 자산에 대해
“새로운 고점이 형성될 때마다
일정한 규칙으로 깊은 조정 구간에서만 분할 진입하고자 할 때”
실거래에 그대로 적용하기보다는,
전략 아이디어 검증 및 리스크 프로파일 분석,
자신의 성향에 맞는 파라미터 탐색 용도로 사용하는 것을 권장합니다.
8. 한계 및 유의사항
백테스트 결과는 미래 성과를 보장하지 않습니다.
과거 데이터에 기반한 시뮬레이션일 뿐이며,
실제 시장에서는
유동성
슬리피지
수수료 체계
강제청산 규칙
등 다양한 변수가 존재합니다.
청산가는 단순화된 공식에 따른 추정치입니다.
거래소별 실제 청산 규칙, 유지 증거금, 수수료, 펀딩비 등은
본 전략의 계산과 다를 수 있으며,
청산가 추정 라인은 참고용 지표일 뿐입니다.
레버리지 및 진입 비율 설정에 따라 손실 폭이 매우 커질 수 있습니다.
특히 **“첫 포지션 300% 진입”**과 같이 매우 공격적인 설정은
시장 급락 시 계좌 손실과 청산 리스크를 크게 증가시킬 수 있으므로
신중한 검토가 필요합니다.
실거래 연동 시에는 별도의 리스크 관리가 필수입니다.
개별 손절 기준
포지션 상한선
전체 포트폴리오 내 비중 관리 등
본 전략 외부에서 추가적인 안전장치가 필요합니다.
9. 결론
ATH Drawdown Re-Buy Long Only 전략은 단순한 “저가 매수”를 넘어서,
ATH 기준으로 드로우다운을 구조적으로 활용하고,
첫 포지션에 대한 **특수 규칙(100% / 300%)**을 적용하며,
레버리지·청산가·MDD·수익률을 통합적으로 시각화함으로써,
하락 구간에서의 규칙 기반 롱 포지션 구축과
리스크 모니터링을 동시에 지원하는 전략입니다.
사용자는 본 전략을 통해:
자신의 시장 관점과 리스크 허용 범위에 맞는
드로우다운 구간
진입 비율
레버리지 설정
다양한 시나리오에 대한 백테스트와 분석
을 수행할 수 있습니다.
다시 한 번 강조하지만,
본 전략은 연구·학습·백테스트를 위한 도구이며,
실제 투자 판단과 책임은 전적으로 사용자 본인에게 있습니다.
/ENG Version.
This script is designed to use historical drawdown data and automatically enter positions when a predefined percentage drop from the all-time high occurs, using a predefined percentage of your account equity.
You can use leverage, and default parameter values are provided out of the box (you can freely change them to suit your style).
In addition to the two main entry levels, you can add more entry conditions and custom entry percentages – just ask ChatGPT to modify the script.
For actual/live usage, please turn OFF the KillSwitch function and turn ON the Bar Magnifier feature.
ATH Drawdown Re-Buy Long Only Strategy
1. Strategy Overview
The ATH Drawdown Re-Buy Long Only strategy is an automatic re-buy (Long Only) system that builds long positions step-by-step at specific drawdown levels, based on the asset’s all-time high (ATH) and its subsequent drawdown.
This strategy is designed with the following goals:
Systematic scaled buying and leverage usage during sharp correction periods
Clear, rule-based entry logic using drawdowns from ATH
Real-time visualization of:
Average entry price
Leverage
Estimated liquidation price
Account MDD (Max Drawdown)
Return / performance
This allows traders to intuitively monitor both risk and position status.
※ This strategy is provided for educational, research, and backtesting purposes only.
It does not constitute investment advice and does not guarantee any profits.
2. Core Concepts
2-1. Drawdown from ATH (All-Time High)
On the chart, the strategy always tracks the highest high as the ATH.
Whenever a new high is made, ATH is updated, and based on that ATH the following are calculated:
How many percent the current bar’s Low is below the ATH
How many percent the current bar’s Close is below the ATH
Using these, the strategy executes buys at two predefined drawdown zones:
1st entry zone: When price drops X% from ATH
2nd entry zone: When price drops Y% from ATH
Each zone is allowed to trigger only once per ATH cycle.
When a new ATH is created, the “1st / 2nd entry possible” flags are reset, and new opportunities open up for that ATH leg.
2-2. Special Rule for the First Position (100% / 300%)
A key feature of this strategy is the special rule for the very first position.
When the strategy currently holds no position and is about to open the first long position:
Under normal conditions, it builds the position using 100% of account equity.
However, if at that moment the price has dropped by at least a predefined threshold from ATH (e.g. around –72.5% or more),
→ the strategy will open the first position using 300% of account equity.
This rule works as follows:
Whether the first entry happens at the 1st drawdown zone or at the 2nd drawdown zone,
If the current drawdown from ATH is at or below the threshold (e.g. –72.5% or worse),
→ the strategy interprets this as “a sufficiently deep crash” and opens the initial position with 300% of equity.
If the drawdown is less severe than the threshold,
→ the first entry is capped at 100% of equity.
So the strategy has two modes for the first entry:
Normal market conditions: 100% of equity
Deep drawdown conditions: 300% of equity
This special rule is intended to be aggressive in extremely deep crashes while staying more conservative in normal corrections.
3. Strategy Logic & Execution
3-1. Entry Conditions
The strategy tracks the ATH using the High price.
For each bar, it calculates the drawdown from ATH.
The user defines two drawdown zones, for example:
1st zone: ATH – 50%
2nd zone: ATH – 72.5%
For each zone, the strategy checks:
If no buy has been executed yet for that zone in the current ATH leg, and
If the current bar’s Low touches or falls below that zone’s price level,
→ That bar is considered to have triggered a buy condition.
Order simulation:
The strategy simulates entering a long position at that zone’s price level
(using a limit/market-like approximation for backtesting).
3-2. ATH Reset & Entry Opportunity Reset
When a new High goes above the previous ATH:
The ATH is updated to this new high.
Internal flags that track whether the 1st and 2nd entries have been used are reset.
This means:
Each time the market makes a new ATH,
The strategy once again has a fresh opportunity to execute 1st and 2nd drawdown entries for that new ATH leg.
4. Position Sizing & Leverage
4-1. Position Size Based on Account Equity
The strategy defines current equity as:
Current Equity = Initial Capital + Realized PnL + Unrealized PnL
For each entry zone, the position value is calculated as follows:
The user inputs:
“What % of equity to use at this zone”
The strategy:
Multiplies current equity by that percentage
Then multiplies by the strategy’s leverage factor
Thus:
Position Value = Current Equity × (Zone % / 100) × Leverage
Finally, this position value is divided by the entry price to determine the actual position size in tokens.
4-2. Exception for the First Position (100% / 300%)
For the very first position (when there is no open position),
the strategy does not use the zone % parameters. Instead, it uses fixed ratios:
Default: Enter the first position with 100% of equity.
If the drawdown from ATH at that moment is greater than or equal to a predefined threshold (e.g. –72.5% or more)
→ Enter the first position with 300% of equity.
The position value is computed as:
Position Value = Current Equity × (100% or 300%) × Leverage
Then it is divided by the entry price to obtain the token quantity.
This rule:
Applies regardless of whether the first entry occurs at the 1st zone or 2nd zone.
Embeds the philosophy:
“In very deep crashes, go much larger on the first entry; otherwise, stay more conservative.”
4-3. Tracking Real Leverage
On each bar, the strategy tracks:
The existing position size at the start of the bar
The newly added size (if any) on that bar
When a new entry occurs, it calculates the real leverage at that moment:
Real Leverage = (Position Value / Current Equity)
This is then displayed on the chart as a label, for example:
Lev 2.53x
This makes it easy to see the actual leverage level at each entry point.
5. Visualization & Monitoring
5-1. On-Chart Visual Elements
The strategy plots the following directly on the chart:
ATH Line
The all-time high (based on High) is plotted as an orange line.
Average Entry Price Line
When a position is open, the average entry price of that position is plotted as a yellow line.
Estimated Liquidation Price (Fixed) Line
The strategy detects when the position size changes.
At each size change, it uses the current average entry price and real leverage to compute an approximate liquidation price.
This “fixed liquidation price” is then plotted as a red line on the chart.
If there is no position, or if leverage is 1x or lower, the liquidation line is removed.
Entry Markers & Labels
When 1st/2nd entry conditions are met, the strategy:
Marks the entry point on the chart.
Displays labels such as "Buy XX% @ Price" and "Lev XXx",
showing both entry percentage and real leverage at that time.
The label placement is configurable:
Below Bar
Above Bar
At Price
5-2. Information Table (Top-Right Panel)
In the top-right corner of the chart, the strategy displays a summary table of the current account and position status. It typically includes:
Pos Qty (Token)
Absolute size of the current position (in tokens)
Pos Value (USDT)
Market value of the current position (qty × current price)
Leverage (Now)
Current real leverage (position value / current equity)
DD from ATH (%)
Current drawdown (%) from the latest ATH, based on current price
Avg Entry
Average entry price of the current position
PnL (%)
Unrealized profit/loss (%) of the current position
Max DD (Equity %)
The maximum equity drawdown (MDD) recorded over the entire backtest period
Last Entry Price
Average entry price immediately after the most recent add-on entry
Last Entry Lev
Real leverage at the time of the most recent entry
Liq Price (Fixed)
The fixed estimated liquidation price described above
Return from Start (%)
Total return (%) of equity compared to the initial capital
Through this table, users can quickly grasp:
Current account and position status
Current risk level
Cumulative performance
6. Time Filters & Label Options
6-1. Strategy Date Range Filter
The strategy provides an option to restrict trading to a specific time range.
When “Use Date Range” is enabled:
You can specify start and end timestamps.
The strategy will only execute trades within that range.
When this option is disabled:
The strategy operates over the entire chart history.
6-2. Entry Label Placement
Users can customize where entry/leverage labels are drawn:
Below Bar (Below Bar)
Above Bar (Above Bar)
At the actual price level (At Price)
This allows you to adjust visualization according to personal preference and chart readability.
7. Use Cases & Applications
This strategy is suitable for the following purposes:
Long-term / swing-style re-buy strategies for spot or futures long positions
Testing rule-based strategies that rely on “drawdown from ATH” as a main signal
Monitoring account leverage, liquidation price, and MDD when using leverage
Handling situations where, for a given asset:
“Every time a new ATH is formed,
you want to wait for deep corrections and enter only at specific drawdown zones”
It is generally recommended to use this strategy not as a direct plug-and-play live system, but as a tool for:
Strategy idea validation
Risk profile analysis
Parameter exploration to match your personal risk tolerance and style
8. Limitations & Warnings
Backtest results do not guarantee future performance.
They are based on historical data only.
In live markets, additional factors exist:
Liquidity
Slippage
Fee structures
Exchange-specific liquidation rules
Funding fees, etc.
The liquidation price is only an approximate estimate, derived from a simplified formula.
Actual liquidation rules, maintenance margin requirements, fees, and other details differ by exchange.
The liquidation line should be treated as a reference indicator, not an exact guarantee.
Depending on the configured leverage and entry percentages, losses can be very large.
In particular, extremely aggressive settings such as “first position 300% of equity” can greatly increase the risk of large account drawdowns and liquidation during sharp market crashes.
Use such settings with extreme caution.
For live trading, additional risk management is essential:
Your own stop-loss rules
Maximum position size limits
Portfolio-level exposure controls
And other external safety mechanisms beyond this strategy
9. Conclusion
The ATH Drawdown Re-Buy Long Only strategy goes beyond simple “buy the dip” logic. It:
Systematically utilizes drawdowns from ATH as a structural signal
Applies a special first-position rule (100% / 300%)
Integrates visualization of leverage, liquidation price, MDD, and returns
All of this supports rule-based long position building in drawdown phases and comprehensive risk monitoring.
With this strategy, users can:
Explore different:
Drawdown zones
Entry percentages
Leverage levels
Run various backtests and scenario analyses
Better understand the risk/return profile that fits their own market view and risk tolerance
Once again, this strategy is intended for research, learning, and backtesting only.
All real trading decisions and their consequences are solely the responsibility of the user.

Custom Session Background Highlighter (Asia / London / NY)This was something i am used to using with Motivewave, and did not see a good one with TV. You can set any time frame, and change the background color to any color you want. I like to have a lightly different color background for Asia (6pm to 3am),, London, (3am to 9:30 am) and NY (9:30am to 5 pm). You can set your time as you wish, and change the colors as you like. This was created with the help of ChatGPT and seems to be working perfectly fine, but if you encounter any issues copy and paste the code to chatgpt and ask to revise it as needed.

Candle Range Trading (CRT) with Alerts
📌 Description:
The Candle Range Trading (CRT) indicator identifies potential reversal or continuation setups based on specific two-candle price action patterns.
It analyzes pairs of candles to detect Bullish or Bearish CRT patterns and provides visual signals (triangles) and alert notifications to support scalp or swing trading strategies.
🔍 How It Works:
🔻 Bearish CRT Pattern:
Candle 1 is bullish
Candle 2 is bearish
Candle 2's high > Candle 1's high
Candle 2 closes within Candle 1’s range
🔺 Red triangle above candle
🔺 Bullish CRT Pattern:
Candle 1 is bearish
Candle 2 is bullish
Candle 2's low < Candle 1's low
Candle 2 closes within Candle 1’s range
🔻 Green triangle below candle
📈 Visual Features:
🔺 Red triangle = Bearish CRT
🔻 Green triangle = Bullish CRT
📏 Optional box showing CRT High and CRT Low
🔔 Built-in Alerts:
Bullish CRT Alert: "Bullish CRT Pattern Detected"
Bearish CRT Alert: "Bearish CRT Pattern Detected"
Set alerts to get notified instantly when a pattern is detected.
⚠️ Note:
Use in conjunction with trend filters, support/resistance, or volume for best results.
Ideal for scalping or short-term trades.
Avoid trading in choppy or low-volume markets.
⚠️ Disclaimer:
This script was generated with the assistance of ChatGPT by OpenAI and is intended for educational and informational purposes only.
All strategies, alerts, and signals derived from this indicator should be thoroughly backtested and validated before using in live trading.
Trading involves substantial risk, and past performance is not indicative of future results. The author and ChatGPT bear no responsibility for any trading losses or financial decisions made using this script.
Users are solely responsible for the risks associated with their trading actions. Always apply proper risk management and perform your own due diligence before making any financial decisions.

Inside/Outside Bar Direction Highlighter
Here’s a trading indicator in Pine Script (v6) that combines the essence of the Inside Bar, Outside Bar, and directional patterns inspired by TT3 Theory. This indicator highlights bars based on their classification as inside, outside, or directional and provides potential trade signals.
Inside Outside Indicator
Explanation:
Bar Classification:
Inside Bar: Current high is less than the previous high, and the low is greater than the previous low.
Outside Bar: Current high exceeds the previous high, and the low breaks below the previous low.
Up/Down Bars: Closing prices relative to the previous high/low.
Visual Highlights:
Bars are visually highlighted with colors for easy identification.
Trade Signals:
Long Signal: When the close crosses above the previous high and it's a directional up bar.
Short Signal: When the close crosses below the previous low and it's a directional down bar.
Customizable Inputs:
Colors for inside, outside, up, and down bars can be modified.
You can copy and paste this script into the Pine Editor on TradingView to see it in action. Adjust the logic to fit your trading strategy as needed.
You said:
summary of how to use this indicator without buy/sell signal
ChatGPT said:
ChatGPT
How to Use the Inside/Outside Bar Direction Highlighter Indicator (Without Buy/Sell Signals)
Understand the Bar Classifications:
Inside Bars: Highlighted in blue (default). These indicate periods of market consolidation. Look for potential breakouts in either direction.
Outside Bars: Highlighted in orange (default). These represent increased volatility, where both higher highs and lower lows are made. Watch for reversals or continuations based on broader trends.
Directional Up Bars: Highlighted in green (default). These occur when the current close is above the previous high, signaling bullish momentum.
Directional Down Bars: Highlighted in red (default). These occur when the current close is below the previous low, indicating bearish momentum.
Identify Key Patterns:
Use the highlighted bars to spot price action setups, such as:
Breakouts from inside bars.
Reversal signals following outside bars.
Continuation patterns when directional bars align with the trend.
Combine with Your Analysis:
Trend Analysis: Match bar classifications with trend direction on larger timeframes (e.g., daily, 4-hour).
Support/Resistance: Use inside and outside bars near key levels for confirmation or reversal signals.
Volume: Higher volume on directional bars strengthens the momentum signal.
Customize the Colors:
Adjust the bar highlight colors to fit your chart theme for better visibility.
No Automatic Signals:
This indicator doesn’t provide explicit buy/sell recommendations. Instead, use the visual highlights to make informed decisions based on your trading strategy.
By interpreting these bar patterns, you can better gauge market behavior and make more confident decisions without relying on preset signals.

Intraday Volume### Intraday Volume Indicator Explanation
--- this was Mostly created by OpenAI ChatGPT --- it's pretty good!
--- My Commentary: One of the problems I find is with Volume is - it is skewed by the overwhelming volume around the Open and Close. So, as an experiment, I asked ChatGPT to create an indicator to plot the volume everywhere BUT the open.
I added in the CandleColor() function and set the times.
I also changed the Intraday Volume calculation from Cumulative to live.
still Chat GPT - did about 90% of the heavy lift! And, wrote the summary !
----
The "Intraday Volume" indicator is a custom script designed for use on the TradingView platform. It provides a visual representation of the total accumulated trading volume during the intraday trading session, specifically between the market open and close times. Below is a detailed explanation of its functionality:
#### **Key Features:**
1. **Session Times:**
- The indicator defines the intraday session as the period between 9:30 AM EST (market open) and 4:00 PM EST (market close).
- It uses the `timestamp` function to set these times dynamically for each trading day.
2. **Intraday Volume Calculation:**
- During the defined intraday session, the indicator accumulates the trading volume from each bar (candlestick).
- Outside the intraday session, the volume is reset to `na` (not available) to ensure only intraday data is plotted.
3. **Plotting the Volume:**
- The accumulated intraday volume is plotted as a blue column chart in a separate pane below the price chart.
- This provides a clear visualization of how the trading volume evolves throughout the trading session.
4. **Horizontal Reference Line:**
- A horizontal line is added at zero as a visual reference, making it easier to interpret the volume data.
#### **Use Cases:**
- **Volume Analysis:**
- Traders can use the indicator to identify periods of high or low trading activity during the intraday session.
- Peaks in the volume chart may correspond to key market events, such as news releases or significant price movements.
- **Trend Confirmation:**
- Comparing intraday volume with price action can help traders confirm the strength of a trend or the likelihood of a reversal.
- **Custom Time Frames:**
- Although this script is tailored for regular U.S. market hours, it can be adapted for other markets or time zones by modifying the session times.
#### **Customization:**
- **Colors and Styles:**
- The plot color (blue) and style (columns) can be customized to suit user preferences.
- **Session Times:**
- Users can change the session start and end times to match their trading needs or regional market hours.
This indicator is especially useful for intraday traders seeking insights into trading volume dynamics within the trading day. By visualizing the intraday volume, traders can gain a deeper understanding of market behavior and make informed decisions.
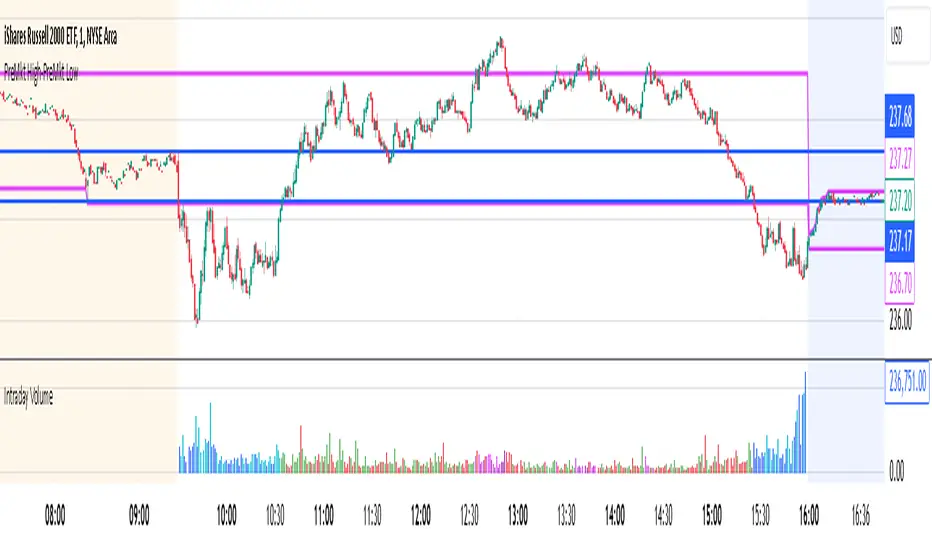
Pair Trade Beta Calculator (WORKING VERSION)wrote by chatgpt5, calucate the beta for pair trading
Asset A: The asset you would like to long
Assest B: The asset you would like to short
