MAC-Z & MACD Leader signal [ChuckBanger]This is a combination of my MACD Leader script and MAC-Z with option to add Laguerre filter. The advantage of the MAC-Z over MACD is that it is a more accurate and “assumption-free” indicator that can more accurately describe how a market actually perform. But you can use this as a regular MACD indicator.
Crossovers signals
The MAC-Z line and signal line can be utilized in the same way as a stochastic oscillator, with the crossover between the two lines providing buy and sell signals. As with most crossover strategies, a buy signal comes when the shorter-term, more reactive line – in this case the MAC-Z line (blue line) crosses above the slower signal line (orange line). For example, when the MAC-Z line crosses below the signal line it provides a bearish sell signal.
Zero line crossing
The zero cross strategy is based on either of the lines crossing the zero line. If the MAC-Z crosses the zero line from below, it is a signal for a possible new uptrend, while the MAC-Z crossing from above is a signal that a new downtrend may be starting. This is special powerful if the lines has a fast up or down movement but the price action doesn't reflect that movement.
Divergences
Bearish and bullish divergences is my favorite signals. When price action and oscillators follow the same path it is called Convergences, when they don’t, it’s called a Divergence. Don't confuse the two because they have not the same meaning. But be aware that for example during consolidation or low liquidity, some small divergences between price and indicators might form, but that doesn't mean we should consider them as real divergences.
There is many different types of divergences. It is easier to show a picture then explaining it so I recommend you to check out the link below. Especially the top image. It sums this up very well
medium.com
MACD Leader
The MACD leader is only showing the crossing of MACD as a vertical line
Green vertical line = MACD Leader Bullish Cross
Red vertical line = MACD Leader Bearish Cross
MACD Leader:
MAC-Z:
More Information
cssanalytics.wordpress.com
en.wikipedia.org
drive.google.com
在腳本中搜尋"crossover债券是什么"

MASelect Crossover StratBasic Crossover Strategy for backtesting purposes, to use with the study+alert script.
Use "Format" to change your settings. Both Moving Averages can be changed individually to swap between EMA (Exponential Moving Average), SMA (Simple Moving Average), WMA (Weighted Moving Average), DEMA (Double Exponential Moving Average) and VWMA (Volume Weighted Moving Average).
"Active Length" should be shorter than "Base Length". As usual with crossover strategies, candle resolution will affect results greatly. Longer=better.
Strategy options are "Long+Short" or "Long Only".
Entries/Exits are based on crossovers/crossunders only, but I encourage you to add further exit conditions and play around with the code.
I made this for beginners on Autoview discord to have something to play with, and added some unnecessary visual changes just to give code examples (changing things like background color, candle color, line color, plotting shapes, different plot styles).
Play around combining different types of Moving Averages of different lengths.

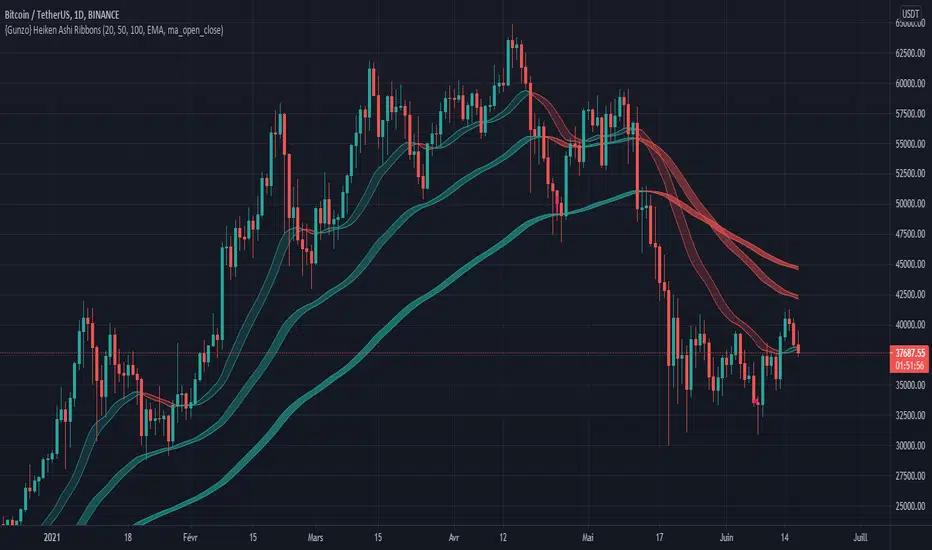
{Gunzo} Heiken Ashi RibbonsHeiken Ashi Ribbons is a trend-following indicator which gives entry and exit points for short-term, medium-term and long term trading (using Exponential Moving Averages and Heiken Ashi formulas).
OVERVIEW :
The Heiken Ashi Ribbons indicator is composed of 3 moving average ribbons (slow, normal and fast) that are computed using the Heiken Ashi formulas. The 3 ribbons give a clear vision of the current trend as they use moving averages that smooth out the price and filter noise from short term fluctuations. In a simplified way, you can consider each ribbon as a moving average with a larger body size.
If the price is above the slow ribbon, we consider the asset as trending up in the short term (trending down otherwise). If the price is above the fast ribbon, we consider the asset as trending up in the long term (trending down otherwise).
CALCULATION :
First of all, to compute a ribbon for this indicator we calculate a moving average (EMA by default) for common sources (OHLC) :
EMA (open), EMA (high), EMA (low), EMA (close)
We then apply the Heiken Ashi formulas to the moving averages calculated previously.
HA (open) = HA (open) previous + HA (close) previous
HA (close) = ( EMA (open) + EMA (high) + EMA (low) + EMA (close) ) / 4
HA (high) = max( EMA (open), EMA (close), EMA (high) )
HA (low) = min ( EMA (open), EMA (close), EMA (low) )
The ribbon displayed (by default) on the chart is the area between HA (open) and HA (close).
SETTINGS :
1st Moving average length : Length of the slow moving average
2nd Moving average length : Length of the normal moving average
3rd Moving average length : Length of the fast moving average
Moving average method : Moving average calculation method (EMA : Exponential Moving Average, SMA : Simple Moving Average, WMA : Weighted Moving Average)
Ribbon type : standard ribbon uses the area between HA (open) and HA (close). Large ribbon uses the area between HA (low) and HA (high)
Display ribbon as candles : change the type of visualization between area and candles
Display short term buy/sell signals : Display short term buy/sell signals (crosses) when the fast moving average and normal moving average are crossing
Display long term buy/sell signals : Display long buy/sell signals (circles) when the fast moving average and slow moving average are crossing
Display ribbon trending up signals : Display ribbon direction change (triangle up) when the trend of the ribbon changes to trending up
Display ribbon trending down signals : Display ribbon direction change (triangle down) when the trend of the ribbon changes to trending down
VISUALIZATIONS :
This indicator has 2 possible visualizations :
Ribbons : the ribbons can be considered as enhanced moving averages for trading purposes. They represent the area between the Heiken Ashi of the moving average of the open and closing price. The color of the moving average line is green when the ribbon is trending up and red when the ribbon is trending down.
Signals : Various signals can be displayed at the bottom of the chart (Buy/Sell signals, Ribbon direction changes signals).
USAGE :
This indicator can be used in many strategies, just like when you are using multiple moving averages. You should test these strategies and use the one that best fits your trading style.
Strategy based on crossovers :
When the fast ribbon crosses above the normal ribbon, it is a short term buy signal (it is recommended to wait for a confirmation)
When the fast ribbon crosses under the normal ribbon, it is a short term sell signal (it is recommended to wait for a confirmation)
When the fast ribbon crosses above the slow ribbon, it is a long term buy signal
When the fast ribbon crosses over the slow ribbon, it is a long term buy signal
Strategy based on price position :
When the prices closes above the ribbon, it is a buy signal (long term if above slow ribbon, short term if above fast ribbon)
When the prices closes below the ribbon, it is a sell signal (long term if below slow ribbon, short term if below fast ribbon)
Strategy based on price bouncing :
When the price decreases and reaches the green long term ribbon, the price candles may not be able to cross the ribbon. If the price increases, we consider that move as a bounce on the ribbon, which is a buy signal
When the price increases and reaches a red long term ribbon, the price candles may not be able to cross the ribbon. If the price decreases, we consider that move as a bounce on the ribbon, which is a sell signal
Strategy based on ribbon direction :
When the direction of the ribbon changes, the trend of the asset is changing which may lead to a crossover to the next candles if the trend is continuing in that direction (it is recommended to validate the entry points with a second indicator as this strategy may have some false signals).
EMA Crossover Strategy ExampleThis is a script written as an example of how to build a simple strategy with user-defined inputs based on a simple Moving Average crossover.
--
This indicator is used for backtesting Moving Average crossover strategies (only for long trades).
A "short" and "long" moving average period and calculation method (the "smoothing type") are user-adjustable. The trade is triggered when the "short" moving average crosses over the "long" moving average.
A third customizable moving average is provided which is used as a trigger to exit the trade when the *close* of a candle crosses below this "exit" moving average. Again the period and smoothing type are user-adjustable.

MA Crossover Strategy with MA Turning Point Exits + ADX filterThis strategy is based upon @rthomson's MA Crossover Strategy with MA Turning Point Exits.
I just added an ability to filter out entries when ADX < 20. In fact you have a choice to set this ADX threshold value.
In a sideways market, the MA crossovers end up in yielding entry trades with losses. ADX value around 20 to 25 indicates a sideway market. By introducing ADX threshold, we are trying to prevent potential loss making entries.

Double EMA CROSS
Double EMA CROSS (DEC)
Useful for identifying and receiving alerts about uptrends and downtrends.
This script uses two Exponential Moving Averages (EMAs) to find price uptrends and downtrends.
An Exponential Moving Average ( EMA ) is a type of moving average that places a greater weight and significance on the most recent data points.
The script produces uptrend and downtrend signals based on crossovers and divergences between the two EMAs,
the user will be able to spot a trend change (when the EMAs crossover) and to determine the strength of the current trend (when the EMAs diverge).
It is also posible to get alerts for uptrends and downtrends on the web and mobile app with sound and pop-ups as well as via email.
The optimal time to enter and exit the market can be concluded from this trend changes.
The user can set their own EMAs, by default they are set to 25 and 75 periods for medium and long term respectively.
When the medium term EMA crosses below the long term EMA the asset is in a downtrend and the price will decline, and when the
medium term EMA crosses above the long term EMA the asset is in an uptrend and price will increase.
This scripts plots the following indicators and signals on the chart to help the user to identify trends:
1.- Medium and long term EMAs as lines overlaid on the price chart.
2.- Up green triangles above bars when the price is on an uptrend and down red triangles below bars when the price is on a downtrend.
3.- Arrows with text to indicate the start of an uptrend or downtrend.
The user can enable and disable the indicators and signals as well as set colors and shapes to their liking.
This script also lets the user create alerts for uptrends and downtrends. To create a new alert using this script follow this instructions:
1.- Once you added this script to your chart, go to the alerts panel (right on web or bottom tool bar on the mobile app) and add a new alert (alarm clock icon with a plus sign).
2.- A modal window will open. On the “Condition” dropdown menu select “DEC”.
3.- On the next dropdown menu (right below the “Condition” one) you can select.
4.- Lastly you can set all the normal alert options and create the alert.

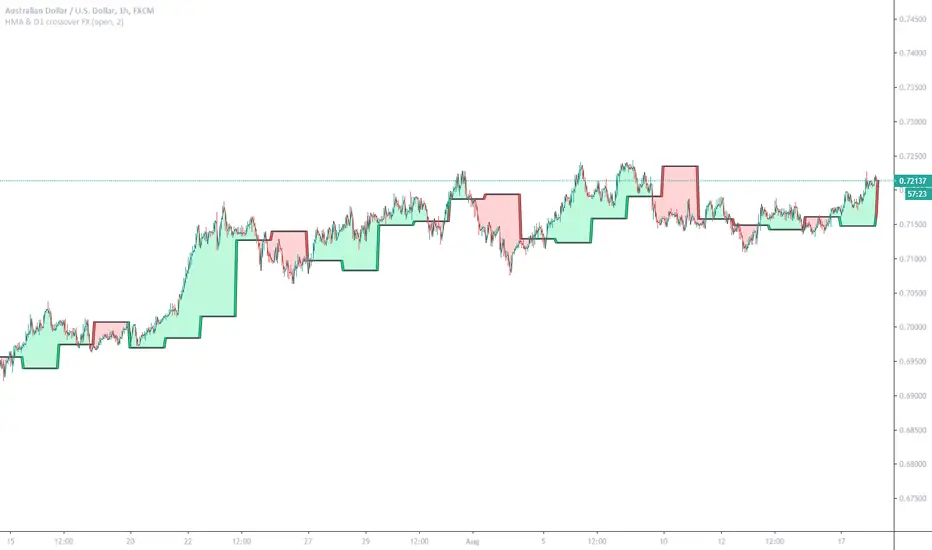
HMA & D1 crossover FX (Study)Can work on other Forex pairs if change settings: Period
This example tuned for AUDUSD (FX Version)
Enter new order on HMA ( Hull Moving Average ) and D1 ( Daily Candle) crossovers, Exit orders as basket when profit = Your Target Profit
This study version built for users of Alerts. Crossover of HMA and DailyCandle1 (and/or DailyCandle1 cross DailyCandle2) (also possible Price cross HMA)
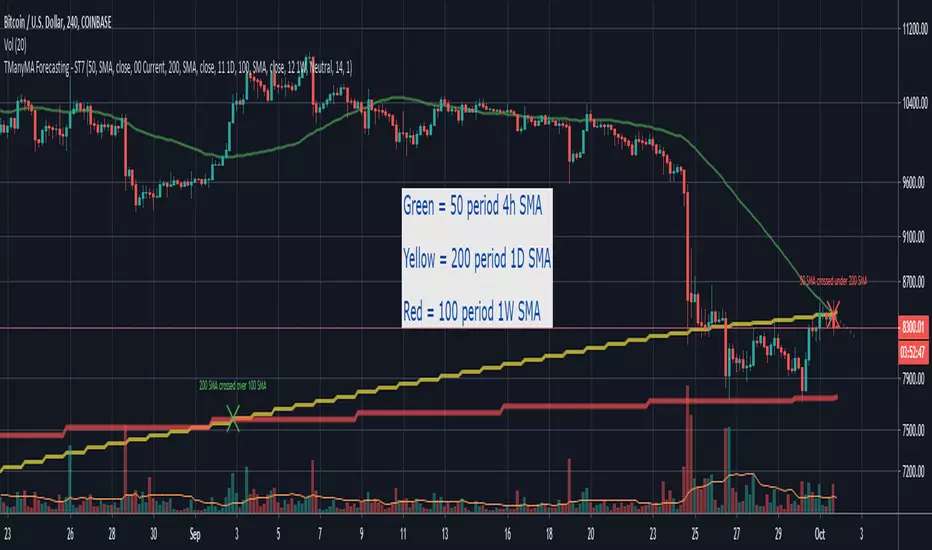
Scripting Tutorial 8 - Triple Many Moving Averages RibbonsThis script is for a triple moving average indicator where the user can select from different types of moving averages, price sources, lookback periods and resolutions.
Features:
- 3 Moving Averages with variable MA types, periods, price sources, resolutions and the ability to disable each individually
- Crossovers are plotted on the chart with detailed information regarding the crossover (Ex: 50 SMA crossed over 200 SMA )
- Forecasting available for all three MAs. MA values are forecasted 5 values out and plotted as if a continuation to the MA.
- Forecast bias also applies to all forecasting. Bias means we can forecast based on an anticipated bullish, bearish or neutral direction in the market.
- To understand bias, please read the source code, or if you can't read the code just send me a message on here or Twitter. Twitter should be linked to my profile.
- Ribbons added and on by default. Optional setting to disable the ribbons. 5 ribbons between MA1 and MA2 and another 5 between MA2 and MA3.
- Ribbons are alpha-color coded based on their relation to their default MAs.
- Ribbons are only visible between MAs if the MAs being compared share the same Type, Resolution, and Source because there is no way to consolidate those three in a simple manner.
- Ribbon values are calculated based on calculated MA Periods between the MAs.
This script is meant as an educational script with well-formatted styling, and references for specific functions.

Scripting Tutorial 7 - Triple Many Moving Averages ResolutionsThis script is for a triple moving average indicator where the user can select from different types of moving averages, price sources, lookback periods and resolutions.
Features:
- 3 Moving Averages with variable MA types, periods, price sources, resolutions and the ability to disable each individually
- Crossovers are plotted on the chart with detailed information regarding the crossover (Ex: 50 SMA crossed over 200 SMA )
- Forecasting available for all three MAs. MA values are forecasted 5 values out and plotted as if a continuation to the MA.
- Forecast bias also applies to all forecasting. Bias means we can forecast based on an anticipated bullish, bearish or neutral direction in the market.
- To understand bias, please read the source code, or if you can't read the code just send me a message on here or Twitter. Twitter should be linked to my profile.
This script is meant as an educational script with well-formatted styling, and references for specific functions.
Scripting Tutorial 6 - Triple Many Moving Averages ForecastingThis script is for a triple moving average indicator where the user can select from different types of moving averages, price sources and lookback periods.
Features:
- 3 Moving Averages with variable MA types, periods, price sources and ability to disable each individually
- Crossovers are plotted on the chart with detailed information regarding the crossover (Ex: 50 SMA crossed over 200 SMA )
- Forecasting available for all three MAs. MA values are forecasted 5 values out and plotted as if a continuation to the MA.
- Forecast bias also applies to all forecasting. Bias means we can forecast based on an anticipated bullish, bearish or neutral direction in the market.
- To understand bias, please read the source code, or if you can't read the code just send me a message on here or Twitter. Twitter should be linked on my profile.
This script is meant as an educational script with well-formatted styling, and references for specific functions.

Chaikin Oscillator w/ crossover arrows [seiglerj]I added crossover arrows to the system Chaikin Oscillator to make crossovers easier to see

ORB + SMA 20/50 Crossover BUY/SELL by Yuvaraj Veppampattu Plots ORB High & Low lines for the first X minutes.
Adds SMA 20 & SMA 50 lines on chart.
Shows BUY arrow when SMA20 crosses ABOVE SMA50.
Shows SELL arrow when SMA20 crosses BELOW SMA50.
Adds alerts for both ORB breakouts & SMA crossovers.

Average True Range CrossoverPlots two ATR indictors, of different period length, to see crossovers. To be used on daily or longer period bars. When the fast ATR crosses above the slow ATR, momentum strategies tend to work better. When the fast ATR crosses below the slow ATR, mean reversion strategies tend to work better.

EMA CrossoverThis is a simple script that gives buy and sell alerts based on EMA 12, 26 and 55 crossovers.


Medium EMA Cross for Binary OptionsThis is a rework of one of Chris Moody's EMA scripts, but made useful for binary options trading. The color of the indicator is the direction of the trade you should take immediately after the bar closes. This is ideal for 5 minute charts. Overlays are based on EMA crossovers. This is dead simple - green overlay = CALL, red overlay = PUT.

Trend ChannelThis Trend Channel is designed to simplify how traders view trends, while also keeping track of potential shifts in trends with signals. It is designed for traders that prefer less over more.
The indicator can be used for trend following, trend reversals and confirmation in combination with price or other indicators.
At the core is one EMA and a smoothed volatility based channel around it.
The purpose of the channel is to avoid false signals on trend reclaim or trend loss and instead identify trend deviations.
The indicator also incorporates long and short EMA cross-over signals to recognize possible shifts in trend without having to overlay multiple EMAs and keep the chart cleaner.
Additionally the indicator fires warnings for potential false signals on golden/death crosses with a letter "W" above/below the signal candle. Those warnings are based on the distance between price and the crossover. When the distance is above a certain threshold the indicator fires a warning that price might mean revert.
Traders can customize all inputs in the settings.

OKX: MA CrossoverEXAMPLE Scripte from my stream , how to use OKX webhooks for create strategy on Pine with real\demo trading on your OKX account. This strategy only for test the functional forward orders to OKX. The backtest not included commisions and other.
OKX MA Crossover. This strategy generate JSONs for place orders on the exchange by alerts and webhooks.
In the script 2 function to generate entry and exit orders, and input parameters that needed for setup exchange.
Use it for test this stack and to write you own strategy for trade on the OKX Exchange.

WMA Combo Crossover V2Before I begin I want to mention:
1. This is an upgrade of my indicator WMA Combo Crossover. (Link: www.tradingview.com)
2. The upgrade was inspired from the CCI and Bollinger Bands indicator by matsu_bitmex. (Link: www.tradingview.com)
3. I have combined the indictor with Bollinger Bands , coloring those sections as yellow, to increase winning trades as well as avoid losing trades by spotting potential reversals with the aid of news avoidance
4. This indicator is designed primarily for NNFX (No Nonsense Forex) though it can be used for any type of trading style
5. Also, I want to thank kurtisbu for helping me out. Thank you!
The indicator:
1. When WMA 25 is blue and is going upwards, it means there is an uptrend
2. When WMA 25 is red and is going down, it means there is a downtrend
3. During a trend, the color may switch to red and blue occasionally. When the color switches back to the direction of the trend, it can be used for re-entries
4. All trades based on the yellow color MUST be during a trend
5. When the color changes to yellow that means price is very volatile and only on the 1st candle is it advisable to enter a trade. (I have not backtested entering on the 2nd candle of a yellow color change)
6. During a trend, when the color changes to yellow and there is an incoming news event, then the chances of a reversal increase and I recommended avoid entering

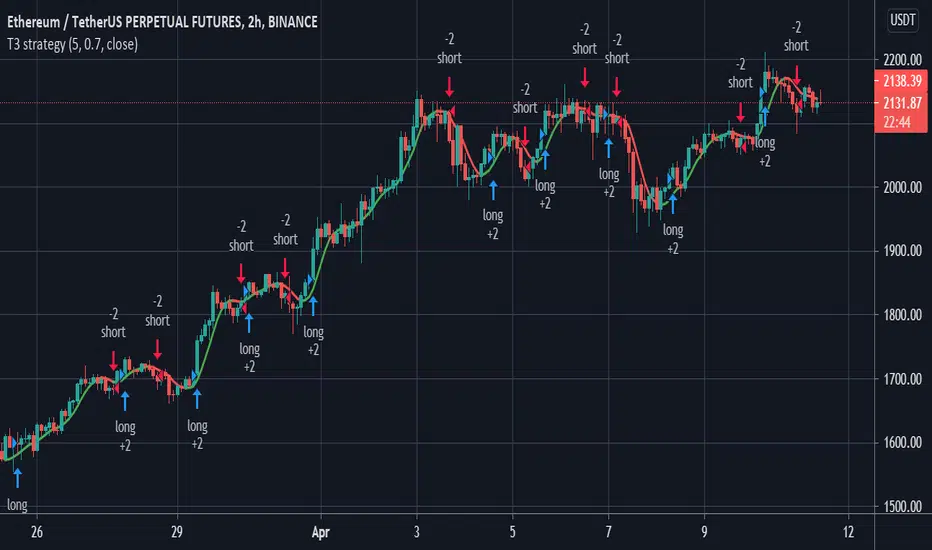
T3 crossover strategyHi everybody,
Hereby a simple strategy based on T3 moving average crossover. If people are interested we can also add some alerts in people are interested.
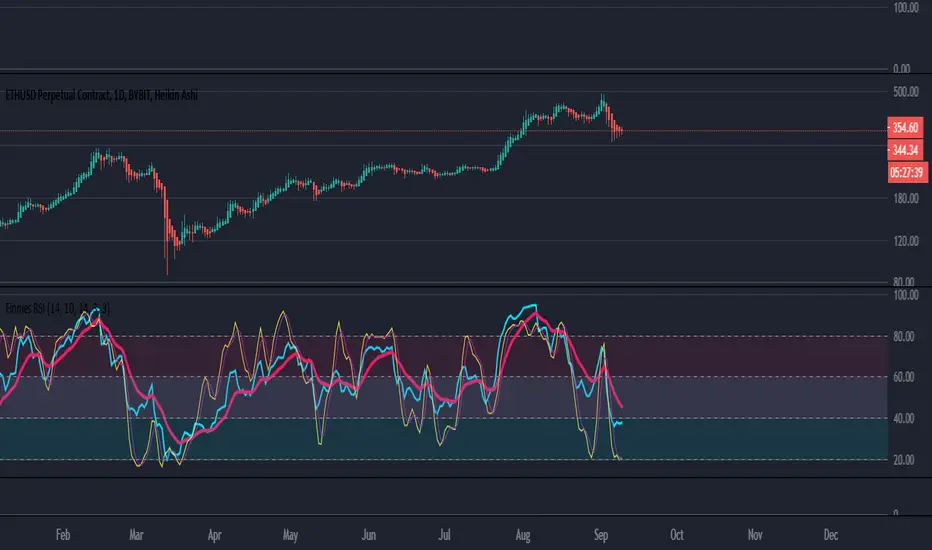
Finnie's RSI with EMA crossover + StochRSI seams to be one of the most used indicators by far, and that comes because of merit. With that in mind, the goal of this indicator is to expand upon the tradition RSI or Relative Strength Index we all know and love :) I started by adding an EMA crossover. Which gives you, the users, a general idea of when to buy and sell outside of just watching a line go down and up. To take thinks even further, I decided to add options for both Fast and Slow Stochastic oscillators. Adding STOCH brings in another variable when deciding on an entry, technically its a bit hard to explain but in practice it would go something like this: you notice RSI is down around the level 20 mark and RSI is crossing up above it's EMA, which is BULLISH signal, and you're thinking about going long. As a second confirmation you can look at the STOCH rsi, if it's also crossing above the previously spoken EMA that's another BULLISH signal. This process can be repeated once RSI has risen to find an exit.
EDIT: If you find the indicator is a bit too cluttered for you, feel free to disable the 'STOCH rsi' feature in settings :)

[INDICATOR]Renko Emulator OCC v1 by JustUncleLThis "Study" project has been created by request and is used in conjunction with the "Strategy" version.
*** EXPERIMENTAL ***
*** USE AT YOUR OWN RISK ***
Description:
Indicator based around Renko Bar Chart emulator (ATR) with direction change used to signal buy/sell trades.
I have generally found that setting the strategy ATR resolution to 3-5x that of the chart you are viewing tends to yield the good results, regardless of which chart time used. Positions get taken automatically following THE Renko Bar after a crossover.
