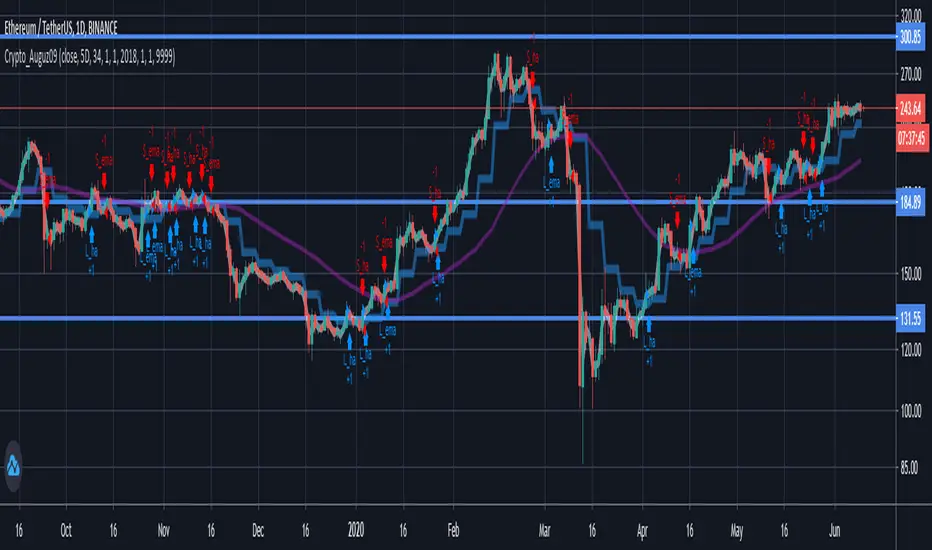
Tan_Aug09Crypto pairs: ETH/USDT
Time-frame: D1
Based on Heikin Ashi Candle and Exponential Moving Average Indicators
Crypto pick: 5D
Stock pick: 8D
Best work in strong trend.
Recommend using with trend line .
在腳本中搜尋"crypto"
CryptOli 3 MAs long/short Backtest// this is an educational Script - basicly its very simple - you can see how minimal changes impact results, thats why i posted it
// Credits to Quantnomad to publish tons of free educational script
// this Script is based on Quantnomads Ultimate MA Indicator
// HA - Option for calcultion based on HA-Candles (very famous recently)
// Source Input - Option (Candletype for calculation, close, ohlc4 ect.) --- there are huge differences --- try it by your own

Golden Ratio Multiplier: Multiplied Moving AveragesThe script for plotting DMAs from the study made by @PositiveCrypto (twitter)

Golden Ratio Multiplier: Multiplied Moving AveragesMultiplied moving averages script visualizing the study made by @PositiveCrypto (twitter).

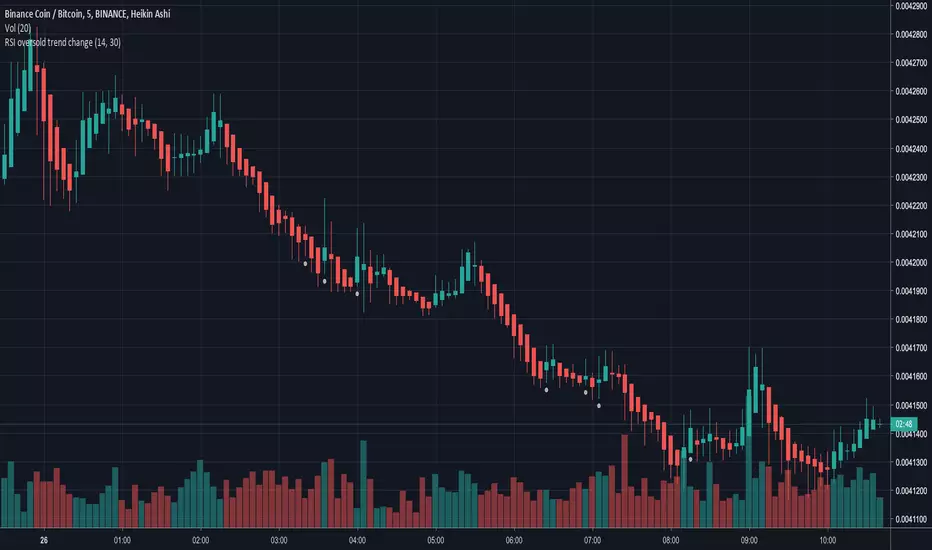
RSI oversold trend changeSimple script that will plot a circle indication on the chart when RSI returns above 30 from oversold position.
Also allows you to create a custom alert.
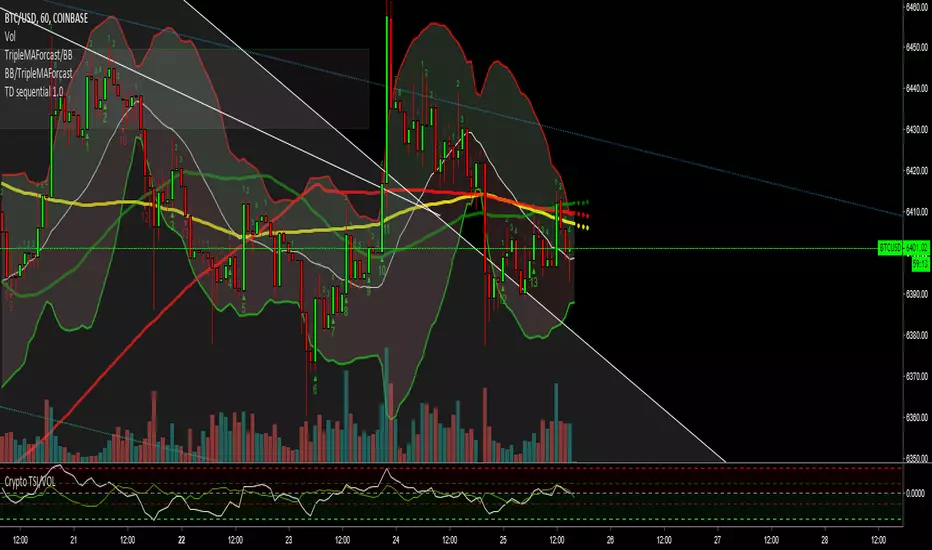
Crypto TSI/VOLSo guys i added the vol to this indicator and i have started to notice patterns in the two duing big moves check it out let me know your thoughts

wz_Kripto Index RSI[WOZDUX]Crypto RSI. On the basis of crypto-index is created, the indicator for the study of cryptocurrencies (KRIN). The wt indicator (this is a modified and improved CCI indicator) is superimposed on the crypto index. The indicator (SIN_WT) shows the speed of movement of the crypto index (blue line) and the speed of movement of the local cryptocurrency price (red line), which is loaded into the window. Thus, the local currency in relation to the crypto community is studied.


TrippleMACDCryptocurrency Scalping Strategy for 1m Timeframe
Introduction:
Welcome to our cutting-edge cryptocurrency scalping strategy tailored specifically for the 1-minute timeframe. By combining three MACD indicators with different parameters and averaging them, along with applying RSI, we've developed a highly effective strategy for maximizing profits in the cryptocurrency market. This strategy is designed for automated trading through our bot, which executes trades using hooks. All trades are calculated for long positions only, ensuring optimal performance in a fast-paced market.
Key Components:
MACD (Moving Average Convergence Divergence):
We've utilized three MACD indicators with varying parameters to capture different aspects of market momentum.
Averaging these MACD indicators helps smooth out noise and provides a more reliable signal for trading decisions.
RSI (Relative Strength Index):
RSI serves as a complementary indicator, providing insights into the strength of bullish trends.
By incorporating RSI, we enhance the accuracy of our entry and exit points, ensuring timely execution of trades.
Strategy Overview:
Long Position Entries:
Initiate long positions when all three MACD indicators signal bullish momentum and the RSI confirms bullish strength.
This combination of indicators increases the probability of successful trades, allowing us to capitalize on uptrends effectively.
Utilizing Linear Regression:
Linear regression is employed to identify consolidation phases in the market.
Recognizing consolidation periods helps us avoid trading during choppy price action, ensuring optimal performance.
Suitability for Grid Trading Bots:
Our strategy is well-suited for grid trading bots due to frequent price fluctuations and opportunities for grid activation.
The strategy's design accounts for price breakthroughs, which are advantageous for grid trading strategies.
Benefits of the Strategy:
Consistent Performance Across Cryptocurrencies:
Through rigorous testing on various cryptocurrency futures contracts, our strategy has demonstrated favorable results across different coins.
Its adaptability makes it a versatile tool for traders seeking consistent profits in the cryptocurrency market.
Integration of Advanced Techniques:
By integrating multiple indicators and employing linear regression, our strategy leverages advanced techniques to enhance trading performance.
This strategic approach ensures a comprehensive analysis of market conditions, leading to well-informed trading decisions.
Conclusion:
Our cryptocurrency scalping strategy offers a sophisticated yet user-friendly approach to trading in the fast-paced environment of the 1-minute timeframe. With its emphasis on automation, accuracy, and adaptability, our strategy empowers traders to navigate the complexities of the cryptocurrency market with confidence. Whether you're a seasoned trader or a novice investor, our strategy provides a reliable framework for achieving consistent profits and maximizing returns on your investment.

Mission Control Dashboard (AI, Crypto, Liquidity)Description: Mission Control Dashboard (AI, Liquidity) is a comprehensive macro-liquidity and cycle-analysis dashboard designed to track the "Flow of Funds" across traditional and crypto markets. Instead of looking at price action alone, this script monitors the fundamental "plumbing" of the global economy.
Key Metrics Tracked:
The Debt Wall: Monitors the US 10Y Yield and TLT price. It signals a "Critical" state if yields spike above 5% or TLT drops below $80, indicating high stress in the bond market.
Global Liquidity (MTF Stable): A proprietary calculation summing the balance sheets of the FED, ECB, BoJ, and PBoC, plus Stablecoin market cap. It calculates the Rate of Change (ROC) to see if the world is "printing" or "draining" money.
TGA Hidden Fuel: Tracks the Treasury General Account. A falling TGA is often bullish for risk assets as it injects liquidity into the banking system.
Universal Alt Season: Monitors TOTAL3 (Crypto market cap excluding BTC & ETH) for parabolic moves (>30% ROC).
AI Infra Capex: Real-time tracking of Capital Expenditures from MSFT, GOOG, AMZN, and META to gauge the health of the AI cycle.
How to use:
Green Status across the board: High probability for "Risk-On" environments (Alt season, Tech rallies).
Strategic Beta vs. Tactical Alpha: If Beta is draining but Alpha is accelerating, it suggests a "False Breakout" or a divergence in liquidity.
Uranium Trend: Used as a proxy for the energy transition and long-term industrial cycle strength.

Leswin Ribbon + Levels + Hybrid (Stocks/Crypto) v1Leswin Ribbon Signals
A trend-based momentum indicator built for day traders and scalpers. Uses an EMA ribbon, higher-timeframe trend filtering, and volatility conditions to highlight high-probability BUY and SELL zones while avoiding choppy markets.
Optimized for 5m & 15m entries, especially for SPY, QQQ, DIA, IWM, and large-cap stocks, but works on all markets including crypto and forex.
Non-repainting. Best used as a confirmation tool alongside your own levels and risk management.

Crypto Breadth - MAK% of top 100 Alts above 50 and 200 day moving averages, excluding BTC, ETH, Stables, LSTs
xrp, bnb, sol, doge, trx, ada, xlm, sui, bch, link, hbar, avax, uni, shib, ton, ltc, dot, pepe, aave, ondo, tao, wld, arb, near, icp, fil, etc, trump, op, pol, ena, render, bonk, xmr, zec, hype, mnt, sky, pump, ip

Crypto Accumulation Candle FinderThis indicator give you long entry signal to dectect MM's entry time.
it's recommended to use it in 5min. time frame.

Crypto 1H [Universal - Strict + R:R]Overview This indicator is a trend-following strategy designed specifically for the 1-hour timeframe (though it works universally). It focuses on high-probability "pullback" entries within an established trend.
What distinguishes this script from standard trend indicators is the integrated Risk:Reward (R:R) Pre-Filter. Before generating a signal, the script calculates the distance to the logical Stop Loss and the logical Take Profit (Resistance/Support). If the trade does not offer a minimum Risk-to-Reward ratio (default 1:2), the signal is suppressed.
How It Works
The strategy follows a strictly defined logical flow:
1. Trend Identification The script uses a Baseline EMA (Default: 50) to determine the trend.
Long: Price is above the 50 EMA, and the 50 EMA is sloping up.
Short: Price is below the 50 EMA, and the 50 EMA is sloping down.
2. The Pullback & Trigger Once a trend is identified, the script waits for price to pull back to the "Trigger" EMA (Default: 21).
The Wait Window: The script utilizes a "Max Wait Bars" logic. Once the price touches the Trigger EMA, it listens for an entry signal for exactly 3 bars. If price lingers too long without reacting, the setup is invalidated to avoid chopping markets.
3. The Risk:Reward Filter (Crucial) This is the final gatekeeper. Even if the trend and candle shape are perfect, the script performs a geometric check:
Stop Loss Calculation: Determined by the lowest low (for longs) or highest high (for shorts) of the last 5 bars, plus a small ATR buffer.
Target Calculation: Determined by the highest high or lowest low of the last 24 bars (local Support/Resistance).
The Math: If the distance to the Target is not at least 2.0x the distance to the Stop Loss, the trade is skipped. This prevents buying right into resistance or selling right into support.
Indicator Features & Settings
Session Filter: Defaults to London and NY sessions (UTC) to ensure volume is present.
Volatility Filter: Requires the signal candle to have a minimum body size (0.15% of price) to avoid "doji" or low-momentum entries.
Visuals:
White Line: 50 EMA (Trend)
Yellow Line: 21 EMA (Momentum Trigger)
Labels: Green (Long) and Red (Short) entry markers.
Red Crosses: These indicate exactly where the suggested Stop Loss was located at the moment of entry.
Risk Disclaimer This tool is designed for educational and analytical purposes. The "Strict R:R" filter does not guarantee profit; it simply filters out setups that mathematically do not fit the specified ratio based on historical price action. Always perform your own analysis.

Crypto Camp Day Key LevelsDaily key levels Daily key levels Daily key levels Daily key levels Daily key levels Daily key levels

Crypto 15M Volume + Supertrend + RSI StrategyThis is AI generated Signal Base on Supertrend, RSI, And Volume Base indicator to create code

Crypto EMA Ribbon + Buy/Sell SignalsEMA Ribbon Strategy Logic (Professional-Grade)
EMA Ribbon
Fast EMAs: 8, 13, 21
Mid EMAs: 34, 55
Trend EMA: 200
Trend Rules
Bull Trend: Price above 200 EMA
Bear Trend: Price below 200 EMA
Buy Signal
Price above 200 EMA
Fast EMAs stacked bullish (8 > 13 > 21 > 34 > 55)
8 EMA crosses above 21 EMA
Sell Signal
Price below 200 EMA
Fast EMAs stacked bearish (8 < 13 < 21 < 34 < 55)
8 EMA crosses below 21 EMA
This avoids chop and only trades momentum-aligned trends.

Crypto LONG PYThis trading approach is a powerful combination of technical tools aimed at taking advantage of market fluctuations with precision and reliability. By integrating Bollinger Bands (BB), the Relative Strength Index (RSI), Exponential Moving Averages (EMA), and Fibonacci retracement levels (Fib), we create a strategy that captures key market moves and helps identify optimal entry and exit points, all within the context of the New York market conditions (NY).
Bollinger Bands provide insight into market volatility, offering signals about potential extreme price movements. The RSI is used to measure momentum and assess overbought or oversold conditions, indicating when the market might be nearing a reversal. Meanwhile, EMAs add a layer of smoothing, allowing us to observe short- and medium-term trends, helping filter out false signals and providing a clearer view of the overall market direction.
Additionally, Fibonacci retracements are integrated to identify key support and resistance levels, pinpointing potential areas of price retracement and continuation. When combined, these indicators offer a holistic approach to navigating the markets, enabling traders to make data-driven, informed decisions.
This approach is ideal for traders looking for a meticulous methodology for trading during the NY session, where liquidity and volatility tend to be at their highest. Leverage the synergy between these indicators to optimize your trading strategy and maximize your market performance.

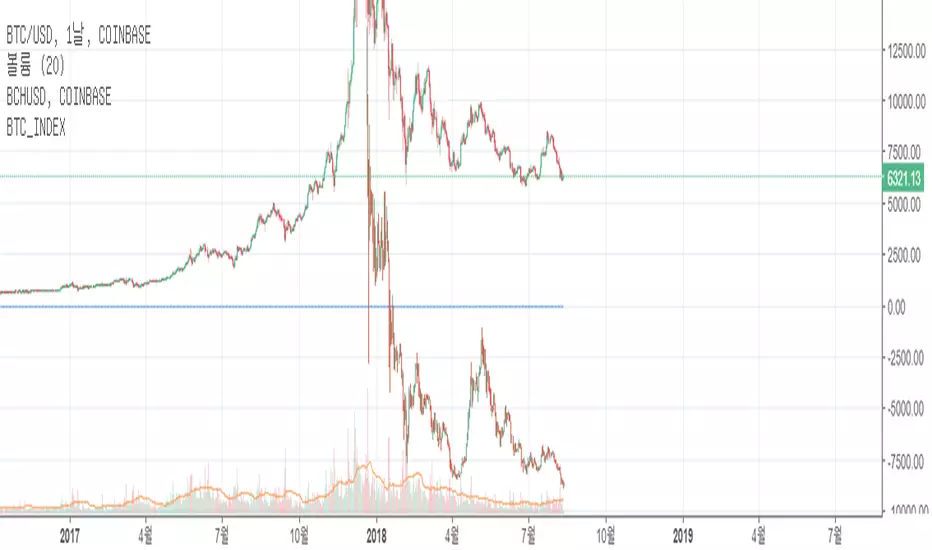
Crypto Black swan theory 加密黑天鵝事件標記Only displayed on the daily K-line.
Open source code.
Can be copied and modified.
只在日K顯示
開源程式碼
可以自己複本出去改
