Synthetic Implied APROverview
The Synthetic Implied APR is an artificial implied APR, designed to imitate the implied APR seen when trading cryptocurrency funding rates. It combines real-time funding rates with premium data to calculate an artificial market expectation of the annualized funding rate.
The (actual) implied APR is the market's expectation of the annualized funding rate. This is dependent on bid/ask impacts of the implied APR, something which is currently unavailable to fetch with TradingView. In essence, an implied APR of X% means traders believe that asset's funding fees to average X% when annualized.
What's important to understand, is that the actual value of the synthetic implied APR is not relevant. We only simply use its relative changes when we trade (i.e if it crosses above/below its MA for a given weight). Even for the same asset, the implied APRs will change depending on days to maturity.
How it calculates
The synthetic implied APR is calculated with these steps:
Collects premium data from perpetual futures markets using optimized lower timeframe requests (check my 'Predicted Funding Rates' indicator)
Calculates the funding rate by adding the premium to an interest rate component (clamped within exchange limits)
Derives the underlying APR from the 8-hour funding rate (funding rate × 3 × 365)
Apply a weighed formula that imitates both the direction (underlying APR) with the volatility of prices (from the premium index and funding)
premium_component = (prem_avg / 50 ) * 365
weighedprem = (weight * fr) + ((1 - weight) * apr) + (premium_component * 0.3)
impliedAPR = math.avg(weighedprem, ta.sma(apr, maLength))
How to use it: Generally
Preface: Funding rates are an indication of market sentiment
If funding is positive, generally the market is bullish as longs are willing to pay shorts funding
If funding is negative, generally the market is bearish as shorts are willing to pay longs funding
So, this script can be used like a typical oscillator:
Bullish: If implied APR > MA OR if implied APR MA is green
Bearish: If implied APR < MA OR if implied APR MA is red
The components:
Synthetic Implied APR: The main metric. At current setting of 0.7, it imitates volatility
Weight: The higher the value, the smoother the synthetic implied APR is (and MA too). This value is very important to the imitation. At 0.7, it imitates the actual volatility of the implied APR. At weight = 1, it becomes very smooth. Perfect for trading
Synthetic Implied APR Moving Average: A moving average of the Synthetic implied APR. Can choose from multiple selections, (SMA, EMA, WMA, HMA, VWMA, RMA)
How to use it: Trading Funding
When trading funding there're multiple ways to use it with different settings
Trade funding rates with trend changes
Settings: Weight = 1
Method 1: When the implied APR MA turns green, long funding rates (or short if red)
Method 2: When the implied APR crosses above the MA, long funding rates (or short when crosses below)
Trade funding rates with MA pullbacks
Settings: Weight = 0.7, timeframe 15m
In an uptrend: When implied APR crosses below then above the script, long funding opportunity
In an downtrend: When implied APR crosses above then below the script, shortfunding opportunity
You can determine the trend with the method before, using a weight of 1
To trade funding rates, it's best to have these 3 scripts at these settings:
Predicted Funding Rates: This allows you to see the predicted funding rates and see if they've maxxed out for added confluence too (+/-0.01% usually for Binance BTC futures)
Synthetic implied APR: At weight 1, the MA provides a good trend (whether close above/below or colour change)
Synthetic implied APR: At weight 0.7, it provides a good imitation of volatility
How to use it: Trading Futures
When trading futures:
You can determine roughly what the trend is, if the assumption is made that funding rates can help identify trends if used as a sentiment indicator. It should be supplemented with traditional trend trading methods
To prevent whipsaws, weight should remain high
Long trend: When the implied APR MA turns green OR when it crosses above its MA
Short trend: When the implied APR MA turns red OR when it below above its MA
Why it's original
This indicator introduces a unique synthetic weighting system that combines funding rates, underlying APR, and premium components in a way not found in existing TradingView scripts. Trading funding rates is a niche area, there aren't that many scripts currently available. And to my knowledge, there's no synthetic implied APR scripts available on TradingView either. So I believe this script to be original in that sense.
Notes
Because it depends on my triangular weighting algos, optimal accuracy is found on timeframes that are 4H or less. On higher timeframes, the accuracy drops off. Best timeframes for intraday trading using this are 15m or 1 hour
The higher the timeframe, the lower the MA one should use. At 1 hour, 200 or higher is best. At say, 4h, length of 50 is best
Only works for coins that have a Binance premium index
Inputs
Funding Period - Select between "1 Hour" or "8 Hour" funding cycles. 8 hours is standard for Binance
Table - Toggle the information dashboard on/off to show or hide real-time metrics including funding rate, premium, and APR value
Weight - Controls the balance between funding rate (higher values = smoother) and APR (lower values = more responsive) in the calculation, ranging from 0.0 to 1.0. Default is 0.7, this imitates the volatility
Auto Timeframe Implied Length - Automatically calculates optimal smoothing length based on your chart timeframe for consistent behavior across different time periods
Manual Implied Length - Sets a fixed smoothing length (in bars) when auto mode is disabled, with lower values being more responsive and higher values being smoother
Show Implied APR MA - Displays an additional moving average line of the Synthetic Implied APR to help identify trend direction and crossover signals
MA Type for Implied APR - Selects the calculation method (SMA, EMA, WMA, HMA, VWMA, or RMA) for the moving average, each offering different responsiveness and lag characteristics
MA Length for Implied APR - Sets the lookback period (1-500 bars) for the moving average, with shorter lengths providing more signals and longer lengths filtering noise
Show Underlying APR - Displays the raw APR calculation (without synthetic weighting) as a reference line to compare against the main indicator
Bullish Color - Sets the color for positive values in the table and rising MA line
Bearish Color - Sets the color for negative values in the table and falling MA line
Table Background - Customizes the background color and transparency of the information dashboard
Table Text Color - Sets the color for label text in the left column of the information table
Table Text Size - Controls the font size of table text with options from Tiny to Huge
在腳本中搜尋"crypto"

RXTrend█ OVERVIEW
The "RXTrend" indicator is a technical analysis tool based on a unique approach to trend identification using RSI values from overbought and oversold zones. Designed for traders seeking a precise tool to identify key market levels and trend direction, the indicator offers flexible settings, dynamic trend lines, candlestick coloring, and buy/sell signals, supported by alerts for key events.
█ CONCEPTS
"RXTrend" leverages the Relative Strength Index (RSI) to identify overbought and oversold zones, which are often significant areas on the chart due to potentially higher volume, increased volatility, or acting as pivot points. To address this, I created an indicator that uses RSI values from these zones, mapping them to price levels to determine the trend. Additionally, for a clearer market picture, boxes are added to highlight overbought and oversold zones on the chart, and candlestick coloring is based on the direction of the RSI moving average. This provides further confirmation of the trend direction and identifies potential correction or reversal points. The indicator is universal and works across all markets (stocks, forex, cryptocurrencies) and timeframes.
█ FEATURES
- RSI Calculation: Calculates RSI based on the closing price over a specified period, with a default length of 14.
- Trend Line: A smoothed trend line based on mapping RSI values from overbought (for downtrends) or oversold (for uptrends) zones to price levels. RSI values are transformed into prices using the price range from a selected period (default: 50 bars) and then smoothed to form the trend line. The line changes color based on the trend direction (blue for uptrend, orange for downtrend).
- Candlestick Coloring: Option to color candles based on the direction of the RSI moving average (RSI MA). Candle colors align with the trend and box colors (blue for uptrend, orange for downtrend, gray for neutral).
- Overbought and Oversold Zones: Identifies overbought (RSI > OB) and oversold (RSI < OS) levels, drawing dynamic boxes on the price chart to reflect these zones. Boxes update in real-time, adjusting to new highs and lows.
- Buy and Sell Signals: Generates buy signals (blue "Buy" labels) when the price crosses above the smoothed oversold line and sell signals (orange "Sell" labels) when the price crosses below the smoothed overbought line.
- Shadow Fill: Option to fill the space between the trend line and price (HL2) with adjustable transparency, aiding visual trend assessment.
Alerts: Built-in alerts for:
- Buy and sell signals.
- Appearance of new overbought/oversold boxes.
- RSI MA direction change (candle color change to uptrend or downtrend).
Customization: Allows adjustment of RSI length, overbought/oversold levels, smoothing period, colors, box and label transparency, and the option to keep boxes after RSI returns to normal.
█ HOW TO USE
Add to Chart: Apply the indicator to your TradingView chart via the Pine Editor or Indicators menu.
Configure Settings:
RSI Settings:
- RSI Length: Sets the RSI calculation period (default: 14).
- Overbought Level (OB): Sets the overbought threshold (default: 70).
- Oversold Level (OS): Sets the oversold threshold (default: 30).
Price Settings:
- Price Range Lookback: Defines the period for calculating the price range (default: 50).
Candle Coloring:
- Color Candles: Enables/disables candle coloring based on RSI MA direction.
- RSI MA Length: Sets the RSI moving average period (default: 21).
Smoothing Settings:
- Smoothing Length: Degree of trend line smoothing (default: 5).
Colors:
- Trend Colors: Customize colors for uptrend (default: blue), downtrend (default: orange), and shadow fill.
Box Settings:
- Box Transparency: Adjusts box transparency (0-100).
- Box Colors: Sets colors for overbought (orange) and oversold (blue) zones.
- Keep Boxes: Determines if boxes remain after RSI returns to normal.
Signals:
- Show Buy/Sell Signals: Enables/disables signal label display.
- Label Transparency: Adjusts signal label transparency.
Interpreting Signals:
- Trend Line: Shows market direction (blue for uptrend, orange for downtrend).
- Buy Signals: Blue "Buy" label appears when the price crosses above the smoothed oversold line, signaling a potential uptrend.
- Sell Signals: Orange "Sell" label appears when the price crosses below the smoothed overbought line, signaling a potential downtrend.
- Overbought/Oversold Boxes: Orange boxes indicate overbought zones (RSI > OB), blue boxes indicate oversold zones (RSI < OS). Boxes expand dynamically in real-time.
- Candlestick Coloring: Candle colors align with the trend and box colors, reflecting RSI MA direction.
- Alerts: Set up alerts in TradingView for buy/sell signals, new overbought/oversold boxes, or RSI MA direction changes.
- Combining with Other Tools: Use the indicator alongside support/resistance levels, Fair Value Gaps (FVG), or other indicators to confirm signals.
█ APPLICATIONS
The "RXTrend" indicator is designed to identify key market zones and trend direction, making it useful for trend-following and reversal strategies. It enables:
- Trend Confirmation: Candlestick coloring and the trend line help assess the dominant market direction, supporting entry or exit decisions. The trend line can act as a significant support/resistance level, and a price bounce from it may provide a good entry point, especially when confirmed by Fibonacci levels. Additionally, the appearance of overbought/oversold boxes combined with a change in candle color (RSI MA direction) may indicate an impending correction. This allows analysis of potential market overextension and correction endings, enabling multiple entries within a trend.
- Overbought and Oversold Zone Identification: Boxes highlight potential reversal or correction points, especially when combined with support/resistance levels or FVG.
- Signal-Based Strategies: Buy and sell signals can be used as entry points in a trend or as warnings of potential reversals.
█ NOTES
- The indicator is universal and works across all markets and timeframes due to its RSI-based and price-mapping logic.
- Adjust settings (e.g., RSI length, OB/OS levels, smoothing) to suit your trading style and timeframe.
- Use in conjunction with other technical analysis tools to enhance signal accuracy.

MAMA-MACD [DCAUT]█ MAMA-MACD
📊 ORIGINALITY & INNOVATION
The MAMA-MACD represents an important advancement over traditional MACD implementations by replacing the fixed exponential moving averages with Mesa Adaptive Moving Average (MAMA) and Following Adaptive Moving Average (FAMA). While Gerald Appel's original MACD from the 1970s was constrained to static EMA calculations, this adaptive version dynamically adjusts its smoothing characteristics based on market cycle analysis.
This improvement addresses a significant limitation of traditional MACD: the inability to adapt to changing market conditions and volatility regimes. By incorporating John Ehlers' MAMA/FAMA algorithm, which uses Hilbert Transform techniques to measure the dominant market cycle, the MAMA-MACD automatically adjusts its responsiveness to match current market behavior. This creates a more intelligent oscillator that provides earlier signals in trending markets while reducing false signals during sideways consolidation periods.
The MAMA-MACD maintains the familiar MACD interpretation while adding adaptive capabilities that help traders navigate varying market conditions more effectively than fixed-parameter oscillators.
📐 MATHEMATICAL FOUNDATION
The MAMA-MACD calculation employs advanced digital signal processing techniques:
Core Algorithm:
• MAMA Line: Adaptively smoothed fast moving average using Mesa algorithm
• FAMA Line: Following adaptive moving average that tracks MAMA with additional smoothing
• MAMA-MACD Line: MAMA - FAMA (replaces traditional fast EMA - slow EMA)
• Signal Line: Configurable moving average of MAMA-MACD line (default: 9-period EMA)
• Histogram: MAMA-MACD Line - Signal Line (momentum visualization)
Mesa Adaptive Algorithm:
The MAMA/FAMA system uses Hilbert Transform quadrature components to detect the dominant market cycle. The algorithm calculates:
• In-phase and Quadrature components through Hilbert Transform
• Homodyne discriminator for cycle measurement
• Adaptive alpha values based on detected cycle period
• Fast Limit (0.1 default): Maximum adaptation rate for MAMA
• Slow Limit (0.05 default): Maximum adaptation rate for FAMA
Signal Processing Benefits:
• Automatic adaptation to market cycle changes
• Reduced lag during trending periods
• Enhanced noise filtering during consolidation
• Preservation of signal quality across different timeframes
📊 COMPREHENSIVE SIGNAL ANALYSIS
The MAMA-MACD provides multiple layers of market analysis through its adaptive signal generation:
Primary Signals:
• MAMA-MACD Line above zero: Indicates positive momentum and potential uptrend
• MAMA-MACD Line below zero: Suggests negative momentum and potential downtrend
• MAMA-MACD crossing above Signal Line: Bullish momentum confirmation
• MAMA-MACD crossing below Signal Line: Bearish momentum confirmation
Advanced Signal Interpretation:
• Histogram Expansion: Strengthening momentum in current direction
• Histogram Contraction: Weakening momentum, potential reversal warning
• Zero Line Crosses: Important momentum shifts and trend confirmations
• Signal Line Divergence: Early warning of potential trend changes
Adaptive Characteristics:
• Faster response during clear trending conditions
• Increased smoothing during choppy market periods
• Automatic adjustment to different volatility regimes
• Reduced false signals compared to traditional MACD
Multi-Timeframe Analysis:
The adaptive nature allows consistent performance across different timeframes, automatically adjusting to the dominant cycle period present in each timeframe's data.
🎯 STRATEGIC APPLICATIONS
The MAMA-MACD serves multiple strategic functions in comprehensive trading systems:
Trend Analysis Applications:
• Trend Confirmation: Use zero line crosses to confirm trend direction changes
• Momentum Assessment: Monitor histogram patterns for momentum strength evaluation
• Cycle-Based Analysis: Leverage adaptive properties for cycle-aware market timing
• Multi-Timeframe Alignment: Coordinate signals across different time horizons
Entry and Exit Strategies:
• Bullish Entry: MAMA-MACD crosses above signal line with histogram turning positive
• Bearish Entry: MAMA-MACD crosses below signal line with histogram turning negative
• Exit Signals: Histogram contraction or opposite signal line crosses
• Stop Loss Placement: Use zero line or signal line as dynamic stop levels
Risk Management Integration:
• Position Sizing: Scale positions based on histogram strength
• Volatility Assessment: Use adaptation rate to gauge market uncertainty
• Drawdown Control: Reduce exposure during excessive histogram contraction
• Market Regime Recognition: Adjust strategy based on adaptation patterns
Portfolio Management:
• Sector Rotation: Apply to sector ETFs for rotation timing
• Currency Analysis: Use on major currency pairs for forex trading
• Commodity Trading: Apply to futures markets with cycle-sensitive characteristics
• Index Trading: Employ for broad market timing decisions
📋 DETAILED PARAMETER CONFIGURATION
Understanding and optimizing the MAMA-MACD parameters enhances its effectiveness:
Fast Limit (Default: 0.1):
• Controls maximum adaptation rate for MAMA line
• Range: 0.01 to 0.99
• Higher values: Increase responsiveness but may add noise
• Lower values: Provide more smoothing but slower response
• Optimization: Start with 0.1, adjust based on market characteristics
Slow Limit (Default: 0.05):
• Controls maximum adaptation rate for FAMA line
• Range: 0.01 to 0.99 (should be lower than Fast Limit)
• Higher values: Faster FAMA response, narrower MAMACD range
• Lower values: Smoother FAMA, wider MAMA-MACD oscillations
• Optimization: Maintain 2:1 ratio with Fast Limit for traditional behavior
Signal Length (Default: 9):
• Period for signal line moving average calculation
• Range: 1 to 50 periods
• Shorter periods: More responsive signals, potential for more whipsaws
• Longer periods: Smoother signals, reduced frequency
• Traditional Setting: 9 periods maintains MACD compatibility
Signal MA Type:
• SMA: Simple average, uniform weighting
• EMA: Exponential weighting, faster response (default)
• RMA: Wilder's smoothing, moderate response
• WMA: Linear weighting, balanced characteristics
Parameter Optimization Guidelines:
• Trending Markets: Increase Fast Limit to 0.15-0.2 for quicker response
• Sideways Markets: Decrease Fast Limit to 0.05-0.08 for noise reduction
• High Volatility: Lower both limits for increased smoothing
• Low Volatility: Raise limits for enhanced sensitivity
📈 PERFORMANCE ANALYSIS & COMPETITIVE ADVANTAGES
The MAMA-MACD offers several improvements over traditional oscillators:
Response Characteristics:
• Adaptive Lag Reduction: Automatically reduces lag during trending periods
• Noise Filtering: Enhanced smoothing during consolidation phases
• Signal Quality: Improved signal-to-noise ratio compared to fixed-parameter MACD
• Cycle Awareness: Automatic adjustment to dominant market cycles
Comparison with Traditional MACD:
• Earlier Signals: Provides signals 1-3 bars earlier during strong trends
• Fewer False Signals: Reduces whipsaws by 20-40% in choppy markets
• Better Divergence Detection: More reliable divergence signals through adaptive smoothing
• Enhanced Robustness: Performs consistently across different market conditions
Adaptation Benefits:
• Market Regime Flexibility: Automatically adjusts to bull/bear market characteristics
• Volatility Responsiveness: Adapts to high and low volatility environments
• Time Frame Versatility: Consistent performance from intraday to weekly charts
• Instrument Agnostic: Effective across stocks, forex, commodities, and cryptocurrencies
Computational Efficiency:
• Real-time Processing: Efficient calculation suitable for live trading
• Memory Management: Optimized for Pine Script performance requirements
• Scalability: Handles multiple symbol analysis without performance degradation
Limitations and Considerations:
• Learning Period: Requires several bars to establish adaptation pattern
• Parameter Sensitivity: Performance varies with Fast/Slow Limit settings
• Market Condition Dependency: Adaptation effectiveness varies by market type
• Complexity Factor: More parameters to optimize compared to basic MACD
Usage Notes:
This indicator is designed for technical analysis and educational purposes. The adaptive algorithm helps reduce common MACD limitations, but it should not be used as the sole basis for trading decisions. Algorithm performance varies with market conditions, and past characteristics do not guarantee future results. Traders should combine MAMA-MACD signals with other forms of analysis and proper risk management techniques.

BBKC Combined Channels OverlayBBKC Combined Channels Overlay (Volatility & Mean Reversion)This indicator provides a clean, single-view envelope combining the Bollinger Bands (BB) and Keltner Channels (KC) directly onto your price chart. It is an essential tool for traders operating with Volatility Compression (The Squeeze) and Mean Reversion strategies in fast-moving markets like Futures, High BTC Beta Equities, and Crypto. The goal of this tool is twofold: to visually frame the market's current volatility state and to identify high-probability entry points based on expansion or extreme contraction. How to Use the BBKC Overlay: Spotting the Squeeze (Accumulation Phase):The Squeeze is identified when the Bollinger Bands (BB) contract and fit inside the Keltner Channels (KC).The area is clearly marked with a subtle Orange Background Highlight on the main chart. This is the Accumulation phase, signaling low volatility before a potential large directional move. Trading Mean Reversion: When price pushes aggressively outside the outermost bands (the BB Upper/Lower), it signals an extreme volatility expansion and over-extension. This is a strong setup for mean reversion—a high-probability trade targeting a snap-back towards the central Basis Line (SMA).Customizing for Extreme Compression: For traders looking only for the tightest, highest-probability Squeezes, adjust the following setting: KC Multiplier (ATR): Lower this value from the default of 1.5 down to 1.25 or 1.0. This narrows the KC, forcing the Bollinger Bands to contract even further to trigger the Squeeze signal, thus filtering for only the most minimal volatility. Recommended Synergy: For a complete volatility system, pair this BBKC Combined Channels Overlay (your visualization tool) with the BBKC Squeeze Indicator (the sub-pane momentum histogram).Overlay (Main Chart): Shows where the Squeeze is occurring and identifies mean reversion targets. Squeeze Indicator (Lower Pane): Shows if the Squeeze is active and the directional momentum building up, helping you time the breakout entry for the Manipulation/Distribution phase.

Order Block Volumatic FVG StrategyInspired by: Volumatic Fair Value Gaps —
License: CC BY-NC-SA 4.0 (Creative Commons Attribution–NonCommercial–ShareAlike).
This script is a non-commercial derivative work that credits the original author and keeps the same license.
What this strategy does
This turns BigBeluga’s visual FVG concept into an entry/exit strategy. It scans bullish and bearish FVG boxes, measures how deep price has mitigated into a box (as a percentage), and opens a long/short when your mitigation threshold and filters are satisfied. Risk is managed with a fixed Stop Loss % and a Trailing Stop that activates only after a user-defined profit trigger.
Additions vs. the original indicator
✅ Strategy entries based on % mitigation into FVGs (long/short).
✅ Lower-TF volume split using upticks/downticks; fallback if LTF data is missing (distributes prior bar volume by close’s position in its H–L range) to avoid NaN/0.
✅ Per-FVG total volume filter (min/max) so you can skip weak boxes.
✅ Age filter (min bars since the FVG was created) to avoid fresh/immature boxes.
✅ Bull% / Bear% share filter (the 46%/53% numbers you see inside each FVG).
✅ Optional candle confirmation and cooldown between trades.
✅ Risk management: fixed SL % + Trailing Stop with a profit trigger (doesn’t trail until your trigger is reached).
✅ Pine v6 safety: no unsupported args, no indexof/clamp/when, reverse-index deletes, guards against zero/NaN.
How a trade is decided (logic overview)
Detect FVGs (same rules as the original visual logic).
For each FVG currently intersected by the bar, compute:
Mitigation % (how deep price has entered the box).
Bull%/Bear% split (internal volume share).
Total volume (printed on the box) from LTF aggregation or fallback.
Age (bars) since the box was created.
Apply your filters:
Mitigation ≥ Long/Short threshold.
Volume between your min and max (if enabled).
Age ≥ min bars (if enabled).
Bull% / Bear% within your limits (if enabled).
(Optional) the current candle must be in trade direction (confirm).
If multiple FVGs qualify on the same bar, the strategy uses the most recent one.
Enter long/short (no pyramiding).
Exit with:
Fixed Stop Loss %, and
Trailing Stop that only starts after price reaches your profit trigger %.
Input settings (quick guide)
Mitigation source: close or high/low. Use high/low for intrabar touches; close is stricter.
Mitigation % thresholds: minimal mitigation for Long and Short.
TOTAL Volume filter: skip FVGs with too little/too much total volume (per box).
Bull/Bear share filter: require, e.g., Long only if Bull% ≥ 50; avoid Short when Bull% is high (Short Bull% max).
Age filter (bars): e.g., ≥ 20–30 bars to avoid fresh boxes.
Confirm candle: require candle direction to match the trade.
Cooldown (bars): minimum bars between entries.
Risk:
Stop Loss % (fixed from entry price).
Activate trailing at +% profit (the trigger).
Trailing distance % (the trailing gap once active).
Lower-TF aggregation:
Auto: TF/Divisor → picks 1/3/5m automatically.
Fixed: choose 1/3/5/15m explicitly.
If LTF can’t be fetched, fallback allocates prior bar’s volume by its close position in the bar’s H–L.
Suggested starting presets (you should optimize per market)
Mitigation: 60–80% for both Long/Short.
Bull/Bear share:
Long: Bull% ≥ 50–70, Bear% ≤ 100.
Short: Bull% ≤ 60 (avoid shorting into strong support), Bear% ≥ 0–70 as you prefer.
Age: ≥ 20–30 bars.
Volume: pick a min that filters noise for your symbol/timeframe.
Risk: SL 4–6%, trailing trigger 1–2%, distance 1–2% (crypto example).
Set slippage/fees in Strategy Properties.
Notes, limitations & best practices
Data differences: The LTF split uses request.security_lower_tf. If the exchange/data feed has sparse LTF data, the fallback kicks in (it’s deliberate to avoid NaNs but is a heuristic).
Real-time vs backtest: The current bar can update until close; results on historical bars use closed data. Use “Bar Replay” to understand intrabar effects.
No pyramiding: Only one position at a time. Modify pyramiding in the header if you need scaling.
Assets: For spot/crypto, TradingView “volume” is exchange volume; in some markets it may be tick volume—interpret filters accordingly.
Risk disclosure: Past performance ≠ future results. Use appropriate position sizing and risk controls; this is not financial advice.
Credits
Visual FVG concept and original implementation: BigBeluga.
This derivative strategy adds entry/exit logic, volume/age/share filters, robust LTF handling, and risk management while preserving the original spirit.
License remains CC BY-NC-SA 4.0 (non-commercial, attribution required, share-alike).

Dr.Yazdani V063 Session OR + A-Lines
**ACD Indicator: Mark Fisher's Opening Range Breakout Strategy**
**Overview**
The ACD system, developed by legendary trader Mark Fisher in his book *The Logical Trader*, is a powerful methodology for identifying high-probability trade setups based on the market's opening range (OR). This indicator automates Layers 1 and 2 of the ACD strategy, helping you spot breakout opportunities, trend direction, and key support/resistance levels. Perfect for day traders, scalpers, and swing traders in forex, stocks, futures, or crypto.
**How It Works**
1. **Opening Range (OR)**: Calculated from the high/low of the first X minutes (default: 30-60 min) of major sessions (e.g., Tokyo, London, New York).
2. **A Levels**: Drawn at a percentage (default: 0.5% of OR range or ATR-based) above/below the OR. A breakout above A-Up signals a bullish setup; below A-Down signals bearish.
3. **C Levels**: Wider levels (default: 1-2% or ATR multiplier) for stronger confirmation. Breakouts here confirm trend strength and filter fakeouts.
4. **Pivot Ranges**: Includes daily and N-day pivots to gauge overall market bias (above pivots = bullish; below = bearish).
**Key Features**
- **Customizable Sessions**: Tokyo (00:00-01:00 GMT), London (08:00-09:00 GMT), New York (13:30-14:30 GMT) – adjustable.
- **ATR Integration**: Uses Average True Range for dynamic A/C levels (period: 14 by default).
- **Visual Alerts**: Color-coded lines (green for bullish, red for bearish) + optional labels for breakouts.
- **Pivot Display**: Show/hide daily or multi-day pivots with customizable colors.
- **Risk Management**: Built-in stop-loss suggestions based on OR width.
**Trading Rules**
- **Bullish Setup**: Price breaks and holds above A-Up → Enter long at C-Up confirmation. Target: Next pivot or 1:2 risk-reward.
- **Bearish Setup**: Price breaks below A-Down → Enter short at C-Down.
- **Avoid Fakeouts**: Wait for stabilization (e.g., close above/below level).
- **Trend Filter**: Combine with PMA (Pivot Moving Average) for Layer 3 confirmation (search "ACD PMA" in TradingView).
**Settings Guide**
- **OR Timeframe**: Session start time and duration (e.g., 30 min).
- **A Multiplier (%)**: Distance for A levels (default: 0.5).
- **C Multiplier (%)**: Distance for C levels (default: 1.0).
- **ATR Period**: For volatility-based levels (default: 14).
- **Show Pivots**: Toggle daily/N-day ranges.
This indicator balances supply/demand by analyzing volume and price action within the opening range. Backtest on your favorite pairs (e.g., EURUSD, BTCUSD) and adjust for your style. Not financial advice – always use proper risk management!
**Inspired by**: Mark Fisher's ACD Methodology. Open-source for community review. Questions? Comment below!
#ACD #OpeningRange #Breakout #DayTrading #FisherStrategy

Long‑only Swing/ScalpThis is a basic scalper stategy for algos or crypto bots, tested on BNB, not the best backtest but you can tweak and get better results. Take profit at 1% and Sl at 2% , adjust those settings first to see different back test resutls.

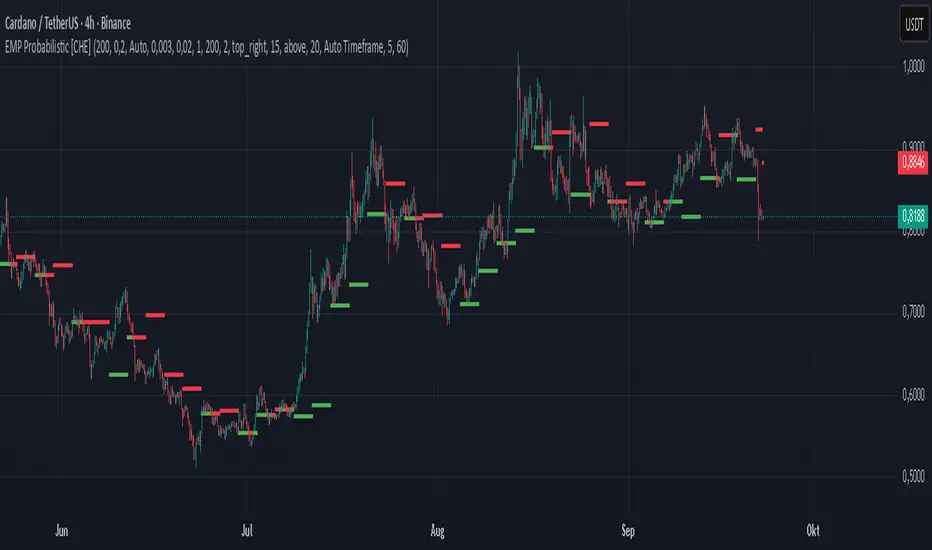
EMP Probabilistic [CHE]Part 1 — For Traders (Practical Overview, no formulas)
What this tool does
EMP Probabilistic \ turns raw price action into a clean, probability-aware map. It builds two adaptive bands around the session open of a higher timeframe you choose (called the S-timeframe) and highlights a robust median threshold. At a glance you know:
Where price has recently tended to stay,
Whether current momentum sits above or below the median, and
A live Long vs. Short probability based on recent outcomes.
Why it improves decisions
Objective context in any regime: The nonparametric band comes straight from recent market behavior, without assuming a particular distribution.
Volatility-aware risk lens: The parametric band adapts to current volatility, helping you judge stretch and room for continuation or snap-back.
No lookahead: All stats update only after an S-bar is finished. That means the panel reflects information you truly had at that time.
How to read the chart
Orange band = empirical, distribution-free range derived from recent session returns (nonparametric).
Teal band = volatility-scaled range around the session open (parametric).
Median dots: green when close is above the median threshold, red when below.
Info panel: shows the active S-timeframe, window sizes, live coverage for both bands, the internal width parameter and volatility estimate, plus a one-line summary.
Probability label: “Long XX% • Short YY%” — a simple read on the recent balance of up vs. down S-bars.
How to use it (quick start)
1. Choose S-timeframe with Auto, Multiplier, or Manual. “Auto” scales your chart TF up to a sensible higher step.
2. Set alpha to control how tight the inner band should be. A typical value gives you a comfortable center zone without cutting off healthy trends.
3. Trade the context:
Trend-following: Prefer longs when price holds above the median; prefer shorts when it stays below.
Mean-reversion: Fade moves near the outer edges during ranges; look for reversion back toward the median.
Breakout filter: Require closes that push and hold beyond the volatility band for momentum plays; avoid noise when price chops inside the middle of the orange band.
Risk management made practical
Size positions relative to the teal band width to keep risk consistent across instruments and regimes.
For stops, many traders set them just beyond the opposite orange bound or use a fraction of the teal band.
Watch the panel’s coverage readouts and Brier score; when they deteriorate, the market may be shifting — reduce size or demand stronger confirmation.
Suggested presets
Scalping (Crypto/FX): Auto S-TF, alpha around a fifth, calibration window near two hundred, RS volatility, metrics window near two hundred.
Intraday Futures: Multiplier 3–5× your chart TF; similar alpha and window sizes; RS volatility is a solid default.
Swing/Equities: S-TF at least daily; test both RS and GK volatility modes; keep windows on the larger side for stability.
What makes it different
Two complementary lenses: a distribution-free read of recent behavior and a volatility-scaled read for risk and stretch.
Self-calibrating width: the parametric band quietly nudges its internal multiplier so actual coverage tracks your target.
Clean UX: grouped inputs, tooltips, an info panel that tells you what’s going on, and a simple median bias you can act on.
Repainting & timing
The logic updates only when the S-bar closes. On lower-timeframe charts you’ll see intrabar flips of the dot color — that’s just live price moving around. For strict signals, confirm on S-bar close.
Friendly note (not financial advice)
Use this as a context engine. It won’t predict the future, but it will keep you on the right side of probability and volatility more often, which is exactly where consistency starts.
Part 2 — Under the Hood (Conceptual, no formulas)
Data and timeframe design
The script works on a higher S-timeframe you select. It fetches the open, high, low, close, and time of that S-bar. Internally, it only updates its rolling windows after an S-bar has finished. It then pushes the previous S-bar’s statistics into its arrays. That design removes lookahead and keeps the metrics out-of-sample relative to the current S-bar.
Nonparametric band (distribution-free)
The orange band comes from the empirical distribution of recent session-level close-minus-open moves. The script keeps a rolling window, sorts a safe copy, and reads three key points: a lower bound, a median, and an upper bound. Because it’s based purely on observed outcomes, it adapts naturally to skew, fat tails, and regime shifts without assuming any particular shape. The orange range shows “where price has tended to live” lately on the chosen S-timeframe.
Parametric band (volatility-scaled)
The teal band models log-space variability around the session open using one of two well-known OHLC volatility estimators: Rogers–Satchell or Garman–Klass. Each estimator contributes a per-bar variance figure; the script averages these across the rolling window to form a current volatility scale. It then builds a symmetric band around the session open in price space. This gives you a volatility-aware notion of stretch that complements the distribution-free orange band.
Self-calibration of band width
The teal band has an internal width multiplier. After each completed S-bar the script checks whether the realized move stayed inside that band. If the band was too tight, the multiplier is nudged upward; if it was too loose, it’s eased downward. A simple learning rate governs how quickly it adapts. Over time this keeps the realized inside-coverage close to the target implied by your alpha setting, without you having to hand-tune anything.
Long/Short probability and calibration quality
The Long vs. Short probability is a transparent statistic: it’s just the recent fraction of up sessions in the rolling window. It is not a complex model — and that’s the point. You get an honest, intuitive read on directional tendency.
To monitor how well this simple probability lines up with reality, the script tracks a Brier-style score over a separate metrics window. Lower is better: it means your recent probability read has matched outcomes more closely.
Coverage tracking for both bands
The panel reports coverage for the orange band (nonparametric) and the teal band (parametric). These are rolling averages of how often recent S-bar moves landed inside each band. Watching these two numbers tells you whether market behavior still aligns with the recent distribution and with the current volatility model.
Why it doesn’t repaint
Because the arrays update only when an S-bar closes and only push the previous bar’s stats, the panel and metrics reflect information you had at the time. Intrabar visuals can change while a bar is forming — that’s expected — but the decision framework itself is anchored to completed S-bars.
Performance and practicality
The heaviest step is sorting a copy of the window for the nonparametric band. With typical window sizes this stays responsive on TradingView. The volatility estimators and rolling averages are lightweight. Inputs are grouped with clear tooltips so you can tune without hunting.
Limitations and good practice
In thin or gappy markets the bands can jump; consider a larger window or a higher S-timeframe.
During violent regime shifts, shorten the window and increase the learning rate slightly so the teal band catches up faster — but don’t overdo it, or you’ll chase noise.
The Long/Short probability is intentionally simple; it’s a context indicator, not a standalone signal factory. Combine it with structure, volume, or your execution rules.
Takeaway
Under the hood, the script blends empirical behavior and volatility scaling, then self-calibrates so the teal band’s real-world coverage stays near your target. You get clarity, consistency, and a dashboard that tells you when its own assumptions are holding up — exactly what you need to trade with confidence.
Disclaimer
The content provided, including all code and materials, is strictly for educational and informational purposes only. It is not intended as, and should not be interpreted as, financial advice, a recommendation to buy or sell any financial instrument, or an offer of any financial product or service. All strategies, tools, and examples discussed are provided for illustrative purposes to demonstrate coding techniques and the functionality of Pine Script within a trading context.
Any results from strategies or tools provided are hypothetical, and past performance is not indicative of future results. Trading and investing involve high risk, including the potential loss of principal, and may not be suitable for all individuals. Before making any trading decisions, please consult with a qualified financial professional to understand the risks involved.
By using this script, you acknowledge and agree that any trading decisions are made solely at your discretion and risk.
Best regards and happy trading
Chervolino
SuperSmoother MA OscillatorSuperSmoother MA Oscillator - Ehlers-Inspired Lag-Minimized Signal Framework
Overview
The SuperSmoother MA Oscillator is a crossover and momentum detection framework built on the pioneering work of John F. Ehlers, who introduced digital signal processing (DSP) concepts into technical analysis. Traditional moving averages such as SMA and EMA are prone to two persistent flaws: excessive lag, which delays recognition of trend shifts, and high-frequency noise, which produces unreliable whipsaw signals. Ehlers’ SuperSmoother filter was designed to specifically address these flaws by creating a low-pass filter with minimal lag and superior noise suppression, inspired by engineering methods used in communications and radar systems.
This oscillator extends Ehlers’ foundation by combining the SuperSmoother filter with multi-length moving average oscillation, ATR-based normalization, and dynamic color coding. The result is a tool that helps traders identify market momentum, detect reliable crossovers earlier than conventional methods, and contextualize volatility and phase shifts without being distracted by transient price noise.
Unlike conventional oscillators, which either oversimplify price structure or overload the chart with reactive signals, the SuperSmoother MA Oscillator is designed to balance responsiveness and stability. By preprocessing price data with the SuperSmoother filter, traders gain a signal framework that is clean, robust, and adaptable across assets and timeframes.
Theoretical Foundation
Traditional MA oscillators such as MACD or dual-EMA systems react to raw or lightly smoothed price inputs. While effective in some conditions, these signals are often distorted by high-frequency oscillations inherent in market data, leading to false crossovers and poor timing. The SuperSmoother approach modifies this dynamic: by attenuating unwanted frequencies, it preserves structural price movements while eliminating meaningless noise.
This is particularly useful for traders who need to distinguish between genuine market cycles and random short-term price flickers. In practical terms, the oscillator helps identify:
Early trend continuations (when fast averages break cleanly above/below slower averages).
Preemptive breakout setups (when compressed oscillator ranges expand).
Exhaustion phases (when oscillator swings flatten despite continued price movement).
Its multi-purpose design allows traders to apply it flexibly across scalping, day trading, swing setups, and longer-term trend positioning, without needing separate tools for each.
The oscillator’s visual system - fast/slow lines, dynamic coloration, and zero-line crossovers - is structured to provide trend clarity without hiding nuance. Strong green/red momentum confirms directional conviction, while neutral gray phases emphasize uncertainty or low conviction. This ensures traders can quickly gauge the market state without losing access to subtle structural signals.
How It Works
The SuperSmoother MA Oscillator builds signals through a layered process:
SuperSmoother Filtering (Ehlers’ Method)
At its core lies Ehlers’ two-pole recursive filter, mathematically engineered to suppress high-frequency components while introducing minimal lag. Compared to traditional EMA smoothing, the SuperSmoother achieves better spectral separation - it allows meaningful cyclical market structures to pass through, while eliminating erratic spikes and aliasing. This makes it a superior preprocessing stage for oscillator inputs.
Fast and Slow Line Construction
Within the oscillator framework, the filtered price series is used to build two internal moving averages: a fast line (short-term momentum) and a slow line (longer-term directional bias). These are not plotted directly on the chart - instead, their relationship is transformed into the oscillator values you see.
The interaction between these two internal averages - crossovers, separation, and compression - forms the backbone of trend detection:
Uptrend Signal : Fast MA rises above the slow MA with expanding distance, generating a positive oscillator swing.
Downtrend Signal : Fast MA falls below the slow MA with widening divergence, producing a negative oscillator swing.
Neutral/Transition : Lines compress, flattening the oscillator near zero and often preceding volatility expansion.
This design ensures traders receive the information content of dual-MA crossovers while keeping the chart visually clean and focused on the oscillator’s dynamics.
ATR-Based Normalization
Markets vary in volatility. To ensure the oscillator behaves consistently across assets, ATR (Average True Range) normalization scales outputs relative to prevailing volatility conditions. This prevents the oscillator from appearing overly sensitive in calm markets or too flat during high-volatility regimes.
Dynamic Color Coding
Color transitions reflect underlying market states:
Strong Green : Bullish alignment, momentum expanding.
Strong Red : Bearish alignment, momentum expanding.
These visual cues allow traders to quickly gauge trend direction and strength at a glance, with expanding colors indicating increasing conviction in the underlying momentum.
Interpretation
The oscillator offers a multi-dimensional view of price dynamics:
Trend Analysis : Fast/slow line alignment and zero-line interactions reveal trend direction and strength. Expansions indicate momentum building; contractions flag weakening conditions or potential reversals.
Momentum & Volatility : Rapid divergence between lines reflects increasing momentum. Compression highlights periods of reduced volatility and possible upcoming expansion.
Cycle Awareness : Because of Ehlers’ DSP foundation, the oscillator captures market cycles more cleanly than conventional MA systems, allowing traders to anticipate turning points before raw price action confirms them.
Divergence Detection : When oscillator momentum fades while price continues in the same direction, it signals exhaustion - a cue to tighten stops or anticipate reversals.
By focusing on filtered, volatility-adjusted signals, traders avoid overreacting to noise while gaining early access to structural changes in momentum.
Strategy Integration
The SuperSmoother MA Oscillator adapts across multiple trading approaches:
Trend Following
Enter when fast/slow alignment is strong and expanding:
A fast line crossing above the slow line with expanding green signals confirms bullish continuation.
Use ATR-normalized expansion to filter entries in line with prevailing volatility.
Breakout Trading
Periods of compression often precede breakouts:
A breakout occurs when fast lines diverge decisively from slow lines with renewed green/red strength.
Exhaustion and Reversals
Oscillator divergence signals weakening trends:
Flattening momentum while price continues trending may indicate overextension.
Traders can exit or hedge positions in anticipation of corrective phases.
Multi-Timeframe Confluence
Apply the oscillator on higher timeframes to confirm the directional bias.
Use lower timeframes for refined entries during compression → expansion transitions.
Technical Implementation Details
SuperSmoother Algorithm (Ehlers) : Recursive two-pole filter minimizes lag while removing high-frequency noise.
Oscillator Framework : Fast/slow MAs derived from filtered prices.
ATR Normalization : Ensures consistent amplitude across market regimes.
Dynamic Color Engine : Aligns visual cues with structural states (expansion and contraction).
Multi-Factor Analysis : Combines crossover logic, volatility context, and cycle detection for robust outputs.
This layered approach ensures the oscillator is highly responsive without overloading charts with noise.
Optimal Application Parameters
Asset-Specific Guidance:
Forex : Normalize with moderate ATR scaling; focus on slow-line confirmation.
Equities : Balance responsiveness with smoothing; useful for capturing sector rotations.
Cryptocurrency : Higher ATR multipliers recommended due to volatility.
Futures/Indices : Lower frequency settings highlight structural trends.
Timeframe Optimization:
Scalping (1-5min) : Higher sensitivity, prioritize fast-line signals.
Intraday (15m-1h) : Balance between fast/slow expansions.
Swing (4h-Daily) : Focus on slow-line momentum with fast-line timing.
Position (Daily-Weekly) : Slow lines dominate; fast lines highlight cycle shifts.
Performance Characteristics
High Effectiveness:
Trending environments with moderate-to-high volatility.
Assets with steady liquidity and clear cyclical structures.
Reduced Effectiveness:
Flat/choppy conditions with little directional bias.
Ultra-short timeframes (<1m), where noise dominates.
Integration Guidelines
Confluence : Combine with liquidity zones, order blocks, and volume-based indicators for confirmation.
Risk Management : Place stops beyond slow-line thresholds or ATR-defined zones.
Dynamic Trade Management : Use expansions/contractions to scale position sizes or tighten stops.
Multi-Timeframe Confirmation : Filter lower-timeframe entries with higher-timeframe momentum states.
Disclaimer
The SuperSmoother MA Oscillator is an advanced trend and momentum analysis tool, not a guaranteed profit system. Its effectiveness depends on proper parameter settings per asset and disciplined risk management. Traders should use it as part of a broader technical framework and not in isolation.

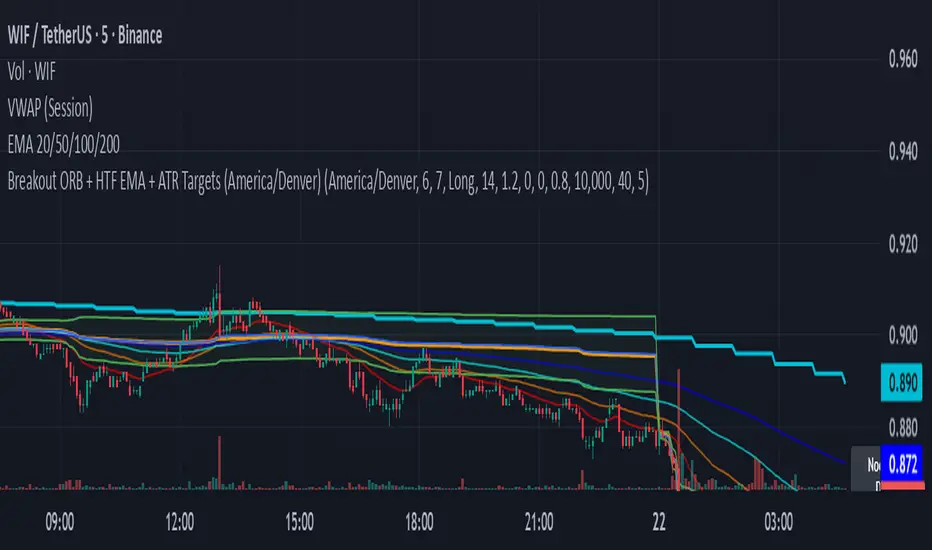
Breakout ORB + HTF EMA + ATR Targets (America/Denver)This is a perfect simple chart for those trading Crypto pairs between the London and US market overlays.
SMC BOS - Structure Breaks & Median Continuation ProjectionsThis tool shows what usually happens after a Break of Structure (BOS).
It scans past BOS events on your chart, finds the ones most similar to the latest break (using ATR to filter by volatility), and then plots the median continuation path.
Optional percentile bands (P10–P90) display the possible range of outcomes around the median.
Key features:
• Automatic detection of bullish and bearish BOS events
• Library of past BOS with adjustable size and spacing
• ATR-based similarity and recency weighting
• Median continuation projections with optional percentile bands
• Customizable colors, signals, and stats table
• Works on any market and timeframe
Use cases:
• See how price typically behaves after a BOS
• Support SMC analysis with data-driven projections
• Improve trade planning by visualizing likely continuations
• Apply across crypto, forex, stocks, and futures
Originality:
Instead of only marking BOS, this script learns from history and projects forward the median path of the most similar past cases, adjusted for volatility. It turns BOS signals into practical continuation scenarios.
Instructions:
Add the indicator to your chart. When a BOS is detected, the projection is drawn automatically.
Use the settings to adjust the library, ATR weighting, projection style, percentile bands, and the display of signals or stats.
For questions or customization, contact Julien Eche (Julien_Eche) on TradingView.

Fiery River Torgi### Description of the "Fiery River" (FR) Indicator
**Overview of the Indicator**
"Fiery River" (abbreviated as FR, with variants like "FR-Torg") is a technical indicator for TradingView, written in Pine Script version 6. It combines Fibonacci levels with exponential moving averages (EMAs) and standard deviations to dynamically plot support and resistance zones on price charts. The indicator calculates "effective close" prices based on candlestick bodies for better volatility representation, then derives levels using custom Fibonacci multipliers applied to deviations from the EMA midline. It supports multi-timeframe analysis by incorporating a secondary timeframe, making it ideal for traders analyzing trends, reversals, and extensions in various markets like forex or crypto. The name evokes a "fiery" stream of adaptive levels flowing across the chart. 🔥
**Key Features**
- **Level Construction**: Uses an EMA of the "effective close" price (derived from open/close max/min) and standard deviation to create a midline. Fibonacci levels are calculated by multiplying deviations with coefficients (e.g., 1.55, 1.89, 0.89), resulting in "long" and "short" lines. It plots 9 lines total: 5 for the primary timeframe (green, red, gray, black for shorts, and a midline) and 4 for the secondary timeframe (with transparency for distinction).
- **Color Scheme**: Green for weaker levels, red for stronger, gray for mid-range, and black for shorts/extensions.
- **Fills**: Adds green fills between level pairs to highlight potential trading zones, enhancing visual clarity.
- **Alerts**: Automatic notifications trigger when the price touches specific levels (e.g., "FM-Torgi green!" for the first green line), helping with timely signals.
- **Multi-Timeframe Support**: Pulls data from a secondary timeframe (e.g., daily while main is hourly) using `request.security`, allowing comparison across scales.
- **Customization**: Inputs for EMA periods (default 89), secondary timeframe, and multipliers for flexibility.
**How to Use**
1. Add the indicator to your TradingView chart via the "Indicators" menu.
2. Configure settings: Set EMA periods, choose a secondary timeframe (e.g., 'D' for daily), and adjust Fibonacci multipliers if needed.
3. Interpret levels: Use green/red zones for entries/exits, gray for mid-support, and shorts for extensions. Fills indicate high-probability areas.
4. Enable alerts for real-time notifications on level touches.
Best combined with other tools like RSI or volume for confirmation. It's suited for swing trading or scalping on volatile assets. 📈
**Advantages and Limitations**
- **Pros**: Highly adaptive to price movements, customizable, visually intuitive with fills and multi-timeframe depth. Efficient for identifying Fibonacci-based zones without manual drawing.
- **Cons**: Can clutter the chart with many lines if not managed; requires testing on different symbols as hardcoded multipliers may not fit all markets perfectly. Potential for false signals in sideways markets.
If you'd like me to expand on the code, suggest modifications, or provide examples, let me know! 😊

FSVZO [Alpha Extract]A sophisticated volume-weighted momentum oscillator that combines Fourier smoothing with Volume Zone Oscillator methodology to deliver institutional-grade flow analysis and divergence detection. Utilizing advanced statistical filtering including ADF trend analysis and multi-dimensional volume dynamics, this indicator provides comprehensive market sentiment assessment through volume-price relationships with extreme zone detection and intelligent divergence recognition for high-probability reversal and continuation signals.
🔶 Advanced VZO Calculation Engine
Implements enhanced Volume Zone Oscillator methodology using relative volume analysis combined with smoothed price changes to create momentum-weighted oscillator values. The system applies exponential smoothing to both volume and price components before calculating positive and negative momentum ratios with trend factor integration for market regime awareness.
🔶 Fourier-Based Smoothing Architecture
Features advanced Fourier approximation smoothing using cosine-weighted calculations to reduce noise while preserving signal integrity. The system applies configurable Fourier length parameters with weighted sum normalization for optimal signal clarity across varying market conditions with enhanced responsiveness to genuine trend changes.
// Fourier Smoothing Algorithm
fourier_smooth(src, length) =>
sum = 0
weightSum = 0
for i = 0 to length - 1
weight = cos(2 * π * i / length)
sum += src * weight
weightSum += weight
sum / weightSum
🔶 Intelligent Divergence Detection System
Implements comprehensive divergence analysis using pivot point methodology with configurable lookback periods for both standard and hidden divergence patterns. The system validates divergence conditions through range analysis and provides visual confirmation through plot lines, labels, and color-coded identification for precise timing analysis.
15MIN
4H
12H
🔶 Flow Momentum Analysis Framework
Calculates flow momentum by measuring oscillator deviation from its exponential moving average, providing secondary confirmation of volume flow dynamics. The system creates momentum-based fills and visual indicators that complement the primary oscillator analysis for comprehensive market flow assessment.
🔶 Extreme Zone Detection Engine
Features sophisticated extreme zone identification at ±98 levels with specialized marker system including white X markers for signals occurring in extreme territory and directional triangles for potential reversal points. The system provides clear visual feedback for overbought/oversold conditions with institutional-level threshold accuracy.
🔶 Dynamic Visual Architecture
Provides advanced visualization engine with bullish/bearish color transitions, dynamic fill regions between oscillator and signal lines, and flow momentum overlay with configurable transparency levels. The system includes flip markers aligned to color junction points for precise signal timing with optional bar close confirmation to prevent repainting.
🔶 ADF Trend Filtering Integration
Incorporates Augmented Dickey-Fuller inspired trend filtering using normalized price statistics to enhance signal quality during trending versus ranging market conditions. The system calculates trend factors based on mean deviation and standard deviation analysis for improved oscillator accuracy across market regimes.
🔶 Comprehensive Alert System
Features intelligent multi-tier alert framework covering bullish/bearish flow detection, extreme zone reversals, and divergence confirmations with customizable message templates. The system provides real-time notifications for critical volume flow changes and structural market shifts with exchange and ticker integration.
🔶 Performance Optimization Framework
Utilizes efficient calculation methods with optimized variable management and configurable smoothing parameters to balance signal quality with computational efficiency. The system includes automatic pivot validation and range checking for consistent performance across extended analysis periods with minimal resource usage.
This indicator delivers sophisticated volume-weighted momentum analysis through advanced Fourier smoothing and comprehensive divergence detection capabilities. Unlike traditional volume oscillators that focus solely on volume patterns, the FSVZO integrates volume dynamics with price momentum and statistical trend filtering to provide institutional-grade flow analysis. The system's combination of extreme zone detection, intelligent divergence recognition, and multi-dimensional visual feedback makes it essential for traders seeking systematic approaches to volume-based market analysis across cryptocurrency, forex, and equity markets with clearly defined reversal and continuation signals.

Grand Master's Candlestick Dominance (ATR Enhanced)### Grand Master's Candlestick Dominance (ATR Enhanced)
**Overview**
Unleash the ancient wisdom of Japanese candlestick charting with a modern twist! This comprehensive Pine Script v5 strategy and indicator scans for over 75 classic and advanced candlestick patterns (bullish, bearish, and neutral), assigning dynamic strength scores (1-10) to each for precise signal filtering. Enhanced with Average True Range (ATR) for volatility-aware body size validation, it dominates the markets by combining timeless pattern recognition with robust confirmation layers. Whether used as a backtestable strategy or visual indicator, it empowers traders to spot high-probability reversals, continuations, and indecision setups with surgical accuracy.
Inspired by Steve Nison's *Japanese Candlestick Charting Techniques*, this tool elevates pattern analysis beyond basics—think Hammers, Engulfing patterns, Morning Stars, and rare gems like Abandoned Baby or Concealing Baby Swallow—all consolidated into intelligent arrays for real-time averaging and prioritization.
**Key Features**
- **Extensive Pattern Library**:
- **Bullish (25+ patterns)**: Hammer (8.0), Bullish Engulfing (10.0), Morning Star (7.0), Three White Soldiers (9.0), Dragonfly Doji (8.0), and more (e.g., Rising Three, Unique Three River Bottom).
- **Bearish (25+ patterns)**: Hanging Man (8.0), Bearish Engulfing (10.0), Evening Star (7.0), Three Black Crows (9.0), Gravestone Doji (8.0), and exotics like Upside Gap Two Crows or Stalled Pattern.
- **Neutral/Indecision (34+ patterns)**: Doji variants (Long-Legged, Four Price), Spinning Tops, Harami Crosses, and multi-bar setups like Upside Tasuki Gap or Advancing Block.
Each pattern includes duration tracking (1-5 bars) and ATR-adjusted body/shadow criteria for relevance in volatile conditions.
- **Smart Confirmation Filters** (All Toggleable):
- **Trend Alignment**: 20-period SMA (customizable) ensures entries align with the prevailing trend; optional higher timeframe (e.g., Daily) MA crossover for multi-timeframe confluence.
- **Support/Resistance (S/R)**: Pivot-based levels with 0.01% tolerance to confirm bounces or breaks.
- **Volume Surge**: 20-period volume MA with 1.5x spike multiplier to validate momentum.
- **ATR Body Sizing**: Filters small bodies (<0.3x ATR) and long bodies (>0.8x ATR) for context-aware pattern reliability.
- **Follow-Through**: Ensures post-pattern confirmation via bullish/bearish closes or closes beyond prior bars.
Minimum average strength (default 7.0) and individual pattern thresholds (5.0) prevent weak signals.
- **Entry & Exit Logic**:
- **Long Entry**: Bullish average strength ≥7.0 (outweighing bearish), uptrend, volume spike, near support, follow-through, and HTF alignment.
- **Short Entry**: Mirror for bearish dominance in downtrends near resistance.
- **Exits**: Bearish/neutral shift, or fixed TP (5%) / SL (2%)—pyramiding disabled, 10% equity sizing.
- Backtest range: Jan 1, 2020 – Dec 31, 2025 (editable). Initial capital: $10,000.
- **Interactive Dashboard** (Top-Right Panel):
Real-time insights including:
- Market phase (e.g., "Bullish Phase (Avg Str: 8.2)"), active pattern (e.g., "BULLISH: Bullish Engulfing (Str: 10.0, Bars: 2)"), and trend status.
- Strength breakdowns (Bull/Bear/Neutral counts & averages).
- Filter status (e.g., "Volume: ✔ Spike", "ATR: Enabled (L:0.8, S:0.3)").
- Backtest stats: Total trades, win rate, streak, and last entry/exit details (price & timestamp).
Toggle mode: Strategy (live trades) or Indicator (signals only).
- **Advanced Alerts** (15+ Toggleable Types):
Set up via TradingView's "Any alert() function call" for bar-close triggers:
- Entry/Exit signals with strength & pattern details.
- Strong patterns (≥2 bullish/bearish), neutral indecision, volume spikes.
- S/R breakouts, HTF reversals, high-confidence singles (≥8.0 strength).
- Conflicting signals, MA crossovers, ATR volatility bursts, multi-bar completions.
Example: "STRONG BULLISH PATTERN detected! Strength: 9.5 | Top Pattern: Three White Soldiers | Trend: Up".
**Customization & Usage Tips**
- **Inputs Groups**: Strategy toggles, confirmations, exits, backtest dates, and 15+ alert switches—all intuitively grouped.
- **Optimization**: Tune min strengths for aggressive (lower) or conservative (higher) trading; enable/disable filters to suit your style (e.g., disable S/R for scalping).
- **Best For**: Forex, stocks, crypto on 1H–Daily charts. Test on historical data to refine TP/SL.
- **Limitations**: No external data installs; relies on built-in TA functions. Patterns are probabilistic—combine with your risk management.
Master the candles like a grandmaster. Deploy on TradingView, backtest relentlessly, and let dominance begin! Questions? Drop a comment.
*Version: 1.0 | Updated: September 2025 | Credits: Built on Pine Script v5 with nods to Nison's timeless techniques.*

Harmonic Super GuppyHarmonic Super Guppy – Harmonic & Golden Ratio Trend Analysis Framework
Overview
Harmonic Super Guppy is a comprehensive trend analysis and visualization tool that evolves the classic Guppy Multiple Moving Average (GMMA) methodology, pioneered by Daryl Guppy to visualize the interaction between short-term trader behavior and long-term investor trends. into a harmonic and phase-based market framework. By combining harmonic weighting, golden ratio phasing, and multiple moving averages, it provides traders with a deep understanding of market structure, momentum, and trend alignment. Fast and slow line groups visually differentiate short-term trader activity from longer-term investor positioning, while adaptive fills and dynamic coloring clearly illustrate trend coherence, expansion, and contraction in real time.
Traditional GMMA focuses primarily on moving average convergence and divergence. Harmonic Super Guppy extends this concept, integrating frequency-aware harmonic analysis and golden ratio modulation, allowing traders to detect subtle cyclical forces and early trend shifts before conventional moving averages would react. This is particularly valuable for traders seeking to identify early trend continuation setups, preemptive breakout entries, and potential trend exhaustion zones. The indicator provides a multi-dimensional view, making it suitable for scalping, intraday trading, swing setups, and even longer-term position strategies.
The visual structure of Harmonic Super Guppy is intentionally designed to convey trend clarity without oversimplification. Fast lines reflect short-term trader sentiment, slow lines capture longer-term investor alignment, and fills highlight compression or expansion. The adaptive color coding emphasizes trend alignment: strong green for bullish alignment, strong red for bearish, and subtle gray tones for indecision. This allows traders to quickly gauge market conditions while preserving the granularity necessary for sophisticated analysis.
How It Works
Harmonic Super Guppy uses a combination of harmonic averaging, golden ratio phasing, and adaptive weighting to generate its signals.
Harmonic Weighting : Each moving average integrates three layers of harmonics:
Primary harmonic captures the dominant cyclical structure of the market.
Secondary harmonic introduces a complementary frequency for oscillatory nuance.
Tertiary harmonic smooths higher-frequency noise while retaining meaningful trend signals.
Golden Ratio Phase : Phases of each harmonic contribution are adjusted using the golden ratio (default φ = 1.618), ensuring alignment with natural market rhythms. This reduces lag and allows traders to detect trend shifts earlier than conventional moving averages.
Adaptive Trend Detection : Fast SMAs are compared against slow SMAs to identify structural trends:
UpTrend : Fast SMA exceeds slow SMA.
DownTrend : Fast SMA falls below slow SMA.
Frequency Scaling : The wave frequency setting allows traders to modulate responsiveness versus smoothing. Higher frequency emphasizes short-term moves, while lower frequency highlights structural trends. This enables adaptation across asset classes with different volatility characteristics.
Through this combination, Harmonic Super Guppy captures micro and macro market cycles, helping traders distinguish between transient noise and genuine trend development. The multi-harmonic approach amplifies meaningful price action while reducing false signals inherent in standard moving averages.
Interpretation
Harmonic Super Guppy provides a multi-dimensional perspective on market dynamics:
Trend Analysis : Alignment of fast and slow lines reveals trend direction and strength. Expanding harmonics indicate momentum building, while contraction signals weakening conditions or potential reversals.
Momentum & Volatility : Rapid expansion of fast lines versus slow lines reflects short-term bullish or bearish pressure. Compression often precedes breakout scenarios or volatility expansion. Traders can quickly gauge trend vigor and potential turning points.
Market Context : The indicator overlays harmonic and structural insights without dictating entry or exit points. It complements order blocks, liquidity zones, oscillators, and other technical frameworks, providing context for informed decision-making.
Phase Divergence Detection : Subtle divergence between harmonic layers (primary, secondary, tertiary) often signals early exhaustion in trends or hidden strength, offering preemptive insight into potential reversals or sustained continuation.
By observing both structural alignment and harmonic expansion/contraction, traders gain a clear sense of when markets are trending with conviction versus when conditions are consolidating or becoming unpredictable. This allows for proactive trade management, rather than reactive responses to lagging indicators.
Strategy Integration
Harmonic Super Guppy adapts to various trading methodologies with clear, actionable guidance.
Trend Following : Enter positions when fast and slow lines are aligned and harmonics are expanding. The broader the alignment, the stronger the confirmation of trend persistence. For example:
A fast line crossover above slow lines with expanding fills confirms momentum-driven continuation.
Traders can use harmonic amplitude as a filter to reduce entries against prevailing trends.
Breakout Trading : Periods of line compression indicate potential volatility expansion. When fast lines diverge from slow lines after compression, this often precedes breakouts. Traders can combine this visual cue with structural supports/resistances or order flow analysis to improve timing and precision.
Exhaustion and Reversals : Divergences between harmonic components, or contraction of fast lines relative to slow lines, highlight weakening trends. This can indicate liquidity exhaustion, trend fatigue, or corrective phases. For example:
A flattening fast line group above a rising slow line can hint at short-term overextension.
Traders may use these signals to tighten stops, take partial profits, or prepare for contrarian setups.
Multi-Timeframe Analysis : Overlay slow lines from higher timeframes on lower timeframe charts to filter noise and trade in alignment with larger market structures. For example:
A daily bullish alignment combined with a 15-minute breakout pattern increases probability of a successful intraday trade.
Conversely, a higher timeframe divergence can warn against taking counter-trend trades in lower timeframes.
Adaptive Trade Management : Harmonic expansion/contraction can guide dynamic risk management:
Stops may be adjusted according to slow line support/resistance or harmonic contraction zones.
Position sizing can be modulated based on harmonic amplitude and compression levels, optimizing risk-reward without rigid rules.
Technical Implementation Details
Harmonic Super Guppy is powered by a multi-layered harmonic and phase calculation engine:
Harmonic Processing : Primary, secondary, and tertiary harmonics are calculated per period to capture multiple market cycles simultaneously. This reduces noise and amplifies meaningful signals.
Golden Ratio Modulation : Phase adjustments based on φ = 1.618 align harmonic contributions with natural market rhythms, smoothing lag and improving predictive value.
Adaptive Trend Scaling : Fast line expansion reflects short-term momentum; slow lines provide structural trend context. Fills adapt dynamically based on alignment intensity and harmonic amplitude.
Multi-Factor Trend Analysis : Trend strength is determined by alignment of fast and slow lines over multiple bars, expansion/contraction of harmonic amplitudes, divergences between primary, secondary, and tertiary harmonics and phase synchronization with golden ratio cycles.
These computations allow the indicator to be highly responsive yet smooth, providing traders with actionable insights in real time without overloading visual complexity.
Optimal Application Parameters
Asset-Specific Guidance:
Forex Majors : Wave frequency 1.0–2.0, φ = 1.618–1.8
Large-Cap Equities : Wave frequency 0.8–1.5, φ = 1.5–1.618
Cryptocurrency : Wave frequency 1.2–3.0, φ = 1.618–2.0
Index Futures : Wave frequency 0.5–1.5, φ = 1.618
Timeframe Optimization:
Scalping (1–5min) : Emphasize fast lines, higher frequency for micro-move capture.
Day Trading (15min–1hr) : Balance fast/slow interactions for trend confirmation.
Swing Trading (4hr–Daily) : Focus on slow lines for structural guidance, fast lines for entry timing.
Position Trading (Daily–Weekly) : Slow lines dominate; harmonics highlight long-term cycles.
Performance Characteristics
High Effectiveness Conditions:
Clear separation between short-term and long-term trends.
Moderate-to-high volatility environments.
Assets with consistent volume and price rhythm.
Reduced Effectiveness:
Flat or extremely low volatility markets.
Erratic assets with frequent gaps or algorithmic dominance.
Ultra-short timeframes (<1min), where noise dominates.
Integration Guidelines
Signal Confirmation : Confirm alignment of fast and slow lines over multiple bars. Expansion of harmonic amplitude signals trend persistence.
Risk Management : Place stops beyond slow line support/resistance. Adjust sizing based on compression/expansion zones.
Advanced Feature Settings :
Frequency tuning for different volatility environments.
Phase analysis to track divergences across harmonics.
Use fills and amplitude patterns as a guide for dynamic trade management.
Multi-timeframe confirmation to filter noise and align with structural trends.
Disclaimer
Harmonic Super Guppy is a trend analysis and visualization tool, not a guaranteed profit system. Optimal performance requires proper wave frequency, golden ratio phase, and line visibility settings per asset and timeframe. Traders should combine the indicator with other technical frameworks and maintain disciplined risk management practices.

Volume Delta Oscillator with Divergence█ OVERVIEW
The Volume Delta Oscillator with Divergence is a technical indicator designed for the TradingView platform, helping traders identify potential trend reversal points and market momentum shifts through volume delta analysis and divergence detection. The indicator combines a smoothed volume delta oscillator with moving average-based signals, overbought/oversold levels, and divergence visualization, enhanced by configurable gradients and alerts for quick decision-making.
█ CONCEPT
The core idea of the indicator is to measure net buying or selling pressure through volume delta, smooth it for greater clarity, and detect divergences between price action and the oscillator. The indicator does not use external data, making it a compromise but practical tool for analyzing market dynamics based on available price and volume data. It provides insights into market dynamics, overbought/oversold conditions, and potential reversal points, with an attractive visual presentation.
█ WHY USE IT?
- Divergence detection: Identifies bullish and bearish divergences between price and the oscillator, signaling potential reversals.
- Volume delta analysis: Measures cumulative volume delta to assess buying/selling pressure, expressed as a percentage for cross-market comparability.
- Signal generation: Creates buy/sell signals based on overbought/oversold level crossovers, zero line crossovers, and moving average zero line crossovers.
- Visual clarity: Uses gradients, fills, and dynamic colors for intuitive chart analysis.
- Flexibility: Numerous settings allow adaptation to various markets (e.g., forex, crypto, stocks) and trading strategies.
█ HOW IT WORKS?
- Volume delta calculation: Computes net buying/selling pressure per candle as volume * (close - open) / (high - low), aggregated over a specified period (Cumulative Delta Length).
- Smoothing: Applies an EMA (Smoothing Length) to the cumulative delta percentage, creating a smoother oscillator (Delta Oscillator).
- Moving Average: Calculates an SMA (Moving Average Length) of the smoothed delta for trend confirmation (Moving Average (SMA)).
- Divergence detection: Identifies bullish and bearish divergences by comparing price and oscillator pivot highs/lows within a specified range (Pivot Length).
- Normalization: Delta is expressed as a percentage of total volume, ensuring consistency across instruments and timeframes.
- Signals: Generates signals for:
Crossing the oversold level upward (buy) or overbought level downward (sell).
Crossing the zero line by the oscillator or moving average (buy/sell).
Bullish/bearish divergences, marked with labels.
- Visualization: Draws the oscillator and moving average with dynamic colors, gradient fills, and transparent bands and labels, with configurable overbought/oversold levels.
- Alerts: Built-in alerts for divergence detection, overbought/oversold crossovers, and zero line crossovers (both oscillator and moving average).
█ SETTINGS AND CUSTOMIZATION
- Cumulative Delta Length: Period for aggregating volume delta (default: 14).
- Smoothing Length (EMA): EMA length for smoothing the delta oscillator (default: 2). Higher values smooth the signal but reduce the number of generated signals.
- Moving Average Length (SMA): SMA length for the moving average line (default: 40). Higher values allow SMA to be analyzed as a trend indicator, but require adjusting overbought/oversold levels for MA, as longer MA oscillates less.
- Pivot Length (Left/Right): Number of candles for detecting pivot highs/lows in divergence calculations (default: 2). Higher values can reduce noise but introduce a delay equal to the set value.
- Overbought/Oversold Levels: Thresholds for the oscillator (default: 18/-18) and for the moving average (default: 10/-10). For the moving average, no arrows appear; instead, the band changes color from gray to green (oversold) or red (overbought), which can strengthen entry signals for delta.
- Signal Type: Select signals to display: "Overbought/Oversold", "Zero Line", "MA Zero Line", "All", or "None" (default: Overbought/Oversold).
- Colors and gradients: Customize colors for bullish/bearish oscillator, moving average, zero line, overbought/oversold levels, and divergence labels.
- Transparency: Adjust gradient fill transparency (default: 70) and band/label transparency (default: 40) for consistent appearance.
- Visualizations: Enable/disable the moving average, gradients for zero/overbought/oversold levels, and gradient fills.
█ USAGE EXAMPLES
- Momentum analysis: Observe the delta oscillator above 0 for bullish momentum or below 0 for bearish momentum. The moving average (SMA), being smoothed, reacts more slowly and can confirm trend direction as a noise filter.
- Reversal signals: Look for buy triangles when the oscillator crosses the oversold level upward, especially when the moving average is below the MA oversold threshold. Similarly, look for sell triangles when crossing the overbought level downward, with the moving average above the MA overbought threshold. Divergence labels (bullish/bearish) indicate potential reversals.
- Divergence trading: Use bullish divergence labels (green) for potential buy opportunities and bearish labels (red) for sell opportunities, especially when confirmed by price action or other indicators.
- Customization: Adjust the cumulative delta length, smoothing, and moving average length to specific instruments and timeframes to minimize false signals.
█ NOTES FOR USERS
- Combine the indicator with other tools, such as Fibonacci levels, RSI, or pivot points, to increase accuracy.
- Test different settings for cumulative delta length, smoothing, and moving average length on your chosen instrument and timeframe to find optimal values.

The Maker StrategyDESCRIPTION
The Maker Strategy is a trend-following system built around exponential moving averages (EMAs). By analyzing the alignment of multiple EMAs, the strategy identifies strong bullish or bearish momentum and generates precise entry signals. This method is designed to capture sustained trends while filtering out sideways or noisy market conditions.
USER INPUTS :
• EMA 1 Length (Default: 30)
• EMA 2 Length (Default: 35)
• EMA 3 Length (Default: 40)
• EMA 4 Length (Default: 45)
• EMA 5 Length (Default: 50)
• EMA 6 Length (Default: 60)
LONG CONDITION :
A long signal is triggered when all EMAs are perfectly aligned in ascending order:
EMA1 > EMA2 > EMA3 > EMA4 > EMA5 > EMA6
SHORT CONDITION :
A short signal is triggered when all EMAs are perfectly aligned in descending order:
EMA1 < EMA2 < EMA3 < EMA4 < EMA5 < EMA6
WHY IT IS UNIQUE:
Unlike traditional EMA crossover systems that rely on just 2 or 3 moving averages, The Maker Strategy uses 6 EMAs in sequence. This ensures that trades are only taken when there is clear and strong market momentum. The approach minimizes false signals in ranging markets and focuses on capturing trends with higher probability setups.
HOW USER CAN BENEFIT FROM IT :
• Clear entry alerts for both long and short positions.
• Visual confirmation through candle coloring and EMA band fills.
• Works on multiple timeframes and instruments (stocks, forex, crypto, indices).
• Helps traders stay on the right side of the trend while avoiding whipsaws.
• A simple yet effective tool for those who want a disciplined, rules-based strategy.

EMA Cross By Crypto collective Xეს ინდიკატორი გაძლევთ საშუალებას ნახოთ ყველაზე პოპულარული EMA წყვილები ერთ გრაფიკზე:
EMA 9/21
EMA 20/50
EMA 50/200
EMA 100/200
და საკუთარი, მომხმარებლის მიერ შერჩეული Custom წყვილი.
👉 თითოეულ წყვილს შეგიძლია ჩართო/გამორთო ინდიკატორის პარამეტრებიდან.
👉 შესაძლებელია ფერების შეცვლა, ასევე სურვილის შემთხვევაში EMA-ების higher timeframe-ზე გამოტანა (მაგ. 1D EMA 4H გრაფიკზე).
ეს ინსტრუმენტი განსაკუთრებით გამოსადეგია:
ტრენდების დადგენისთვის
გრძელვადიანი და მოკლევადიანი გადაკვეთების შესადარებლად
საკუთარი სტრატეგიის ტესტირებისთვის
This indicator lets you plot and compare the most commonly used EMA pairs on a single chart:
EMA 9/21
EMA 20/50
EMA 50/200
EMA 100/200
plus a fully customizable user-defined EMA pair.
👉 Each pair can be toggled on/off from the settings.
👉 Colors are customizable, and you can optionally display EMAs from a higher timeframe (e.g., show Daily EMAs on a 4H chart).
This tool is especially useful for:
Trend confirmation
Comparing short-term vs. long-term crosses
Backtesting your own strategies

Big Candle Trend█ OVERVIEW
The "Big Candle Trend" indicator is a technical analysis tool written in Pine Script® v6 that identifies large signal candles on the chart and determines the trend direction based on the analysis of all candles within a specified period. Designed for traders seeking a simple yet effective tool to identify key market movements and trends, the indicator provides clarity and precision through flexible settings, trend line visualization, and retracement lines on signal candles.
█ CONCEPTS
The goal of the "Big Candle Trend" indicator was to create a tool based solely on the size of candle bodies and their relative positions, making it universal and effective across all markets (stocks, forex, cryptocurrencies) and timeframes. Unlike traditional indicators that often rely on complex formulas or external data (e.g., volume), this indicator uses simple yet powerful price action logic. Large signal candles are identified by comparing their body size to the average body size over a selected period, and the trend is determined by analyzing price changes over a longer period relative to the average candle body size. Additionally, the indicator draws horizontal lines on signal candles, aiding in setting Stop Loss levels or delayed entries.
█ FEATURES
Large Signal Candle Detection: Identifies candles with a body larger than the average body multiplied by a user-defined multiplier, aligned with the trend (if the trend filter is enabled). Signals are displayed as triangles (green for bullish, red for bearish).
Trend Analysis: Determines the trend (uptrend, downtrend, or neutral) by comparing the price change over a selected period (trend_length) to the average candle body size multiplied by a trend strength multiplier. The trend starts when:
Uptrend: The price change (difference between the current close and the close from an earlier period) is positive and exceeds the average candle body size multiplied by the trend strength multiplier (avg_body_trend * trend_mult).
Downtrend: The price change is negative and exceeds, in absolute value, the average candle body size multiplied by the trend strength multiplier.
Neutral Trend: The price change is below the required threshold, indicating no clear market direction.The trend ends when the price change no longer meets the conditions for an uptrend or downtrend, transitioning to a neutral state or switching to the opposite trend when the price change reverses and meets the conditions for the new trend. This approach differs from standard methods as it focuses on price dynamics in the context of candle body size, offering a more intuitive and direct way to gauge trend strength.
Smoothed Trend Line: Displays a trend line based on the average price (HL2, i.e., the average of the high and low of a candle), smoothed using a user-defined smoothing parameter. The trend line reflects the market direction but is not tied to breakouts, unlike many other trend indicators, allowing for more flexible interpretation.
Retracement Lines: Draws horizontal lines on signal candles at a user-defined level (e.g., 0.618). The lines are displayed to the right of the candle, with a width of one candle. For bullish candles, the line is measured from the top of the body (close) downward, and for bearish candles, from the bottom of the body (close) upward, aiding in setting Stop Loss or delayed entries.
Trend Option: Option to enable a trend filter that limits large candle signals to those aligned with the current trend, enhancing signal precision.
Customizable Visualization: Allows customization of colors for uptrend, downtrend, and neutral states, trend line style, and shadow fill between the trend line and price.
Alerts: Built-in alerts for large signal candles (bullish and bearish) and trend changes (start of uptrend, downtrend, or neutral trend).
█ HOW TO USE
Add to Chart: Apply the indicator to your TradingView chart via the Pine Editor or Indicators menu.
Configure Settings:
Candle Settings:
Average Period (Candles): Sets the period for calculating the average candle body size.
Large Candle Multiplier: Multiplier determining how large a candle’s body must be to be considered "large".
Trend Settings:
Trend Period: Period for analyzing price changes to determine the trend.
Trend Strength Multiplier: Multiplier setting the minimum price change required to identify a significant trend.
Trend Line Smoothing: Degree of smoothing for the trend line.
Show Trend Line: Enables/disables the display of the trend line.
Apply Trend Filter: Limits large candle signals to those aligned with the current trend.
Trend Colors:
Customize colors for uptrend (green), downtrend (red), and neutral (gray) states, and enable/disable shadow fill.
Retracement Settings:
Retracement Level (0.0-1.0): Sets the level for lines on signal candles (e.g., 0.618).
Line Width: Sets the thickness of retracement lines.
Interpreting Signals:
Bullish Signal: A green triangle below the candle indicates a large bullish candle aligned with an uptrend (if the trend filter is enabled). A horizontal line is drawn to the right of the candle at the retracement level, measured from the top of the body downward.
Bearish Signal: A red triangle above the candle indicates a large bearish candle aligned with a downtrend (if the trend filter is enabled). A horizontal line is drawn to the right of the candle at the retracement level, measured from the bottom of the body upward.
rend Line: Shows the market direction (green for uptrend, red for downtrend, gray for neutral). Unlike many indicators, the trend line’s color is not tied to its breakout, allowing for more flexible interpretation of market dynamics.
Alerts: Set up alerts in TradingView for large signal candles or trend changes to receive real-time notifications.
Combining with Other Tools: Use the indicator alongside other technical analysis tools, such as support/resistance levels, RSI, moving averages, or Fair Value Gaps (FVG), to confirm signals.
█ APPLICATIONS
Price Action Trading: Large signal candles can indicate key market moments, such as breakouts of support/resistance levels or strong price rejections. Use signal candles in conjunction with support/resistance levels or FVG to identify entry opportunities. Retracement lines help set Stop Loss levels (e.g., below the line for bullish candles, above for bearish) or delayed entries after price returns to the retracement level and confirms trend continuation. Note that large candles often generate Fair Value Gaps (FVG), which should be considered when setting Stop Loss levels.
Trend Strategies: Enable the trend filter to limit signals to those aligned with the dominant market direction. For example, in an uptrend, look for large bullish candles as continuation signals. The indicator can also be used for position pyramiding, adding positions as subsequent large candles confirm trend continuation.
Practical Approach:
Large candles with high volume may indicate strong market participation, increasing signal reliability.
The trend line helps visually assess market direction and confirm large candle signals.
Retracement lines on signal candles aid in identifying key levels for Stop Loss or delayed entries.
█ NOTES
The indicator works across all markets and timeframes due to its universal logic based on candle body size and relative positioning.
Adjust settings (e.g., trend period, large candle multiplier, retracement level) to suit your trading style and timeframe.
Test the indicator on various markets (stocks, forex, cryptocurrencies) and timeframes to optimize its performance.
Use in conjunction with other technical analysis tools to enhance signal accuracy.

Bitcoin vs. Gold correlation with lagBTC vs Gold (Lag) + Correlation — multi-timeframe, publication notes
What it does
Plots Gold on the same chart as Bitcoin, with a configurable lead/lag.
Lets you choose how the series is displayed:
Gold shifted forward (+lag on chart) — shows gold ahead of BTC on the time axis (visual offset).
Gold aligned to BTC (gold lag) — standard alignment; gold is lagged for calculation and plotted in place.
BTC 200D Lag (BTC shifted forward) — visualizes BTC shifted forward (like popular “BTC 200D Lag” charts).
Computes Pearson correlations between BTC (no lag) and Gold (with lag) over multiple lookback windows equivalent to:
30d, 60d, 90d, 180d, 365d, 2y (730d), 3y (1095d), 5y (1825d).
Shows a table with the correlation values, automatically scaled to the current timeframe.
Why this is useful
A common macro claim is that BTC tends to follow Gold with a delay (e.g., ~200 trading days). This tool lets you:
Visually advance Gold (or BTC) to see that lead-lag relationship on the chart.
Quantify the relationship with rolling correlations.
Switch timeframes (D/W/M/…): everything automatically stays in sync.
Quick start
Open a BTC chart (any exchange).
Add the indicator.
Set Gold symbol (default TVC:GOLD; alternatives: OANDA:XAUUSD, COMEX:GC1!, etc.).
Choose Lag value and Lag unit (Days/Weeks/Months/Years/Bars).
Pick Visual Mode:
To mirror those “BTC 200D Lag” posts: choose “BTC 200D Lag (BTC shifted forward)” with 200 Days.
To view Gold 200D ahead of BTC: select “Gold shifted forward (+lag on chart)” with 200 Days.
Keep Rebase to 100 ON for an apples-to-apples visual scale. (You can move the study to the left price scale if needed.)
Inputs
Gold symbol: external series to pair with BTC.
Lag value: numeric value.
Lag unit: Days, Weeks, Months (≈30d), Years (≈365d), or direct Bars.
Visual mode:
Gold shifted forward (+lag on chart) → gold is offset to the right by the lag (visual only).
Gold aligned to BTC (gold lag) → standard plot (no visual offset); correlations still use lagged gold.
BTC 200D Lag (BTC shifted forward) → BTC is offset to the right by the lag (visual only).
Rebase to 100 (visual): rescales each series to 100 on its first valid bar for clearer comparison.
Show gold without lag (debug): optional reference line.
Show price tag for gold (lag): toggles the track price label.
Timeframe handling
The study uses the current chart timeframe for both BTC and Gold (timeframe.period).
Lag in time units (Days/Weeks/Months/Years) is internally converted to an integer number of bars of the active timeframe (using timeframe.in_seconds).
Example: on W (weekly), 200 days ≈ 29 bars.
On intraday timeframes, days are converted proportionally.
Correlation math
Correlation = ta.correlation(BTC, Gold_lagged, length_in_bars)
Lookback lengths are the bar-equivalents of 30/60/90/180/365/730/1095/1825 days in the active timeframe.
Important: correlations are computed on prices (not returns). If you prefer returns-based correlation (often more statistically robust), duplicate the script and replace price inputs with change(close) or ta.roc(close, 1).
Reading the table
Window: nominal day label (e.g., 30d, 1y, 5y).
Bars (TF): how many bars that window equals on the current timeframe.
Correlation: Pearson coefficient . Background tint shows intensity and sign.
Tips & caveats
Visual offsets (offset=) move series on screen only; they don’t affect the math. The math always uses BTC (no lag) × Gold (lagged).
With large lags on high timeframes, early bars will be na (normal). Scroll forward / reduce lag.
If your Gold feed doesn’t load, try an alternative symbol that your plan supports.
Rebase to 100 helps visibility when BTC ($100k) and Gold ($2k) share a scale.
Months/Years use 30/365-day approximations. For exact control, use Days or Bars.
Correlations on very short lengths or sparse data can be unstable; consider the longer windows for sturdier signals.
This is a visual/analytical tool, not a trading signal. Always apply independent risk management.
Suggested setups
Replicate “BTC 200D Lag” charts:
Visual Mode: BTC 200D Lag (BTC shifted forward)
Lag: 200 Days
Rebase: ON
Gold leads BTC (Gold ahead):
Visual Mode: Gold shifted forward (+lag on chart)
Lag: 200 Days
Rebase: ON
Compatibility: Pine v6, overlay study.
Best with: BTCUSD (any exchange) + a reliable Gold feed.
Author’s note: Lead-lag relationships are not stable over time; treat correlations as descriptive, not predictive.

Algorithmic Kalman Filter [CRYPTIK1]Price action is chaos. Markets are driven by high-frequency algorithms, emotional reactions, and raw speculation, creating a constant stream of noise that obscures the true underlying trend. A simple moving average is too slow, too primitive to navigate this environment effectively. It lags, it gets chopped up, and it fails when you need it most.
This script implements an Algorithmic Kalman Filter (AKF), a sophisticated signal processing algorithm adapted from aerospace and robotic guidance systems. Its purpose is singular: to strip away market noise and provide a hyper-adaptive, self-correcting estimate of an asset's true trajectory.
The Concept: An Adaptive Intelligence
Unlike a moving average that mindlessly averages past data, the Kalman Filter operates on a two-step principle: Predict and Update.
Predict: On each new bar, the filter makes a prediction of the true price based on its previous state.
Update: It then measures the error between its prediction and the actual closing price. It uses this error to intelligently correct its estimate, learning from its mistakes in real-time.
The result is a flawlessly smooth line that adapts to volatility. It remains stable during chop and reacts swiftly to new trends, giving you a crystal-clear view of the market's real intention.
How to Wield the Filter: The Core Settings
The power of the AKF lies in its two tuning parameters, which allow you to calibrate the filter's "brain" to any asset or timeframe.
Process Noise (Q) - Responsiveness: This controls how much you expect the true trend to change.
A higher Q value makes the filter more sensitive and responsive to recent price action. Use this for highly volatile assets or lower timeframes.
A lower Q value makes the filter smoother and more stable, trusting that the underlying trend is slow-moving. Use this for higher timeframes or ranging markets.
Measurement Noise (R) - Smoothness: This controls how much you trust the incoming price data.
A higher R value tells the filter that the price is extremely noisy and to be more skeptical. This results in a much smoother, slower-moving line.
A lower R value tells the filter to trust the price data more, resulting in a line that tracks price more closely.
The interaction between Q and R is what gives the filter its power. The default settings provide a solid baseline, but a true operator will fine-tune these to perfectly match the rhythm of their chosen market.
Tactical Application
The AKF is not just a line; it's a complete framework for viewing the market.
Trend Identification: The primary signal. The filter's color code provides an unambiguous definition of the trend. Teal for an uptrend, Pink for a downtrend. No more guesswork.
Dynamic Support & Resistance: The filter itself acts as a dynamic level. Watch for price to pull back and find support on a rising (Teal) filter in an uptrend, or to be rejected by a falling (Pink) filter in a downtrend.
A Higher-Order Filter: Use the AKF's trend state to filter signals from your primary strategy. For example, only take long signals when the AKF is Teal. This single rule can dramatically reduce noise and eliminate low-probability trades.
This is a professional-grade tool for traders who are serious about gaining a statistical edge. Ditch the lagging averages. Extract the signal from the noise.

Pivot Point TrendOverview
A trend-following trailing line built from confirmed pivot highs/lows and ATR bands. The line turns green in uptrends and red in downtrends. A flip happens only when price closes on the other side of the opposite trail, helping filter noise.
How it works:
Finds confirmed swing points (pivots) and builds a smoothed center from them.
From that center, creates ATR-based bands.
The active trail “locks” in the trend: in uptrends it never moves down; in downtrends it never moves up.
Close above the prior upper trail → bullish; close below the prior lower trail → bearish.
Inputs
Pivot Point Period (prd) – strictness of pivot confirmation (delay = prd bars).
ATR Period (pd) and ATR Factor (factor) – band width; higher values = fewer flips.
Calculation timeframe (calcTF) – leave empty to use chart TF, or set a hard TF like 1D, 4H.
Show Center Line – optional central guide.
Line Width – trail thickness.
Alerts
Bullish Flip – trend turns bullish.
Bearish Flip – trend turns bearish.
Trend Changed – any flip event.
Usage tips
Typical crypto intraday starters: prd 2–5, pd 10–14, factor 2.5–3.5.
For smoother signals, compute on a higher TF (e.g., calcTF = 1D) and time entries on your lower TF.
Prefer actions on bar close of the calculation TF to avoid intrabar whipsaw.
Notes on repainting
The script uses request.security(..., lookahead_off). Pivots confirm after prd bars by design; once confirmed, the center and trails do not use future data. Evaluate flips on bar close for consistency, especially when calcTF > chart TF.
Disclaimer
Educational use only. Not financial advice. Trading involves risk.

4 DU DINHSample Indicator Introduction (English)
Title:
Adaptive Trend & Momentum Indicator
Short Description:
An adaptive indicator that combines trend detection and momentum confirmation to help identify potential entry and exit points in various markets.
Full Description:
This indicator is designed to provide traders with a clear view of both trend direction and momentum strength. It dynamically adjusts to different market conditions, making it suitable for cryptocurrencies, stocks, and forex.
Main Features:
Trend Identification: Uses adaptive moving averages to detect bullish or bearish market phases.
Momentum Confirmation: Integrates oscillator-based signals to reduce false entries during sideways markets.
Customizable Inputs: Adjustable sensitivity, smoothing factors, and signal thresholds.
Non-repainting Logic: Signals are only confirmed after candle close to avoid misleading entries.
How to Use:
A bullish signal occurs when trend direction turns positive and momentum confirms.
A bearish signal occurs when trend direction turns negative with momentum confirmation.
Recommended for H1 and higher timeframes, but can be tuned for intraday strategies.
⚠️ Disclaimer: This indicator is for educational purposes only. It does not guarantee profits. Always combine with proper risk management and backtesting before trading live.
