Quantum Fluxtrend [CHE] Quantum Fluxtrend — A dynamic Supertrend variant with integrated breakout event tracking and VWAP-guided risk management for clearer trend decisions.
Summary
The Quantum Fluxtrend builds on traditional Supertrend logic by incorporating a midline derived from smoothed high and low values, creating adaptive bands that respond to market range expansion or contraction. This results in fewer erratic signals during volatile periods and smoother tracking in steady trends, while an overlaid event system highlights breakout confirmations, potential traps, or continuations with visual lines, labels, and percentage deltas from the close. Users benefit from real-time VWAP calculations anchored to events, providing dynamic stop-loss suggestions to help manage exits without manual adjustments. Overall, it layers signal robustness with actionable annotations, reducing noise in fast-moving charts.
Motivation: Why this design?
Standard Supertrend indicators often generate excessive flips in choppy conditions or lag behind in low-volatility drifts, leading to whipsaws that erode confidence in trend direction. This design addresses that by centering bands around a midline that reflects recent price spreads, ensuring adjustments are proportional to observed variability. The added event layer captures regime shifts explicitly, turning abstract crossovers into labeled milestones with trailing VWAP for context, which helps traders distinguish genuine momentum from fleeting noise without over-relying on raw price action.
What’s different vs. standard approaches?
- Baseline reference: Diverges from the classic Supertrend, which uses average true range for fixed offsets from a median price.
- Architecture differences:
- Bands form around a central line averaged from smoothed highs and lows, with offsets scaled by half the range between those smooths.
- Regime direction persists until a clear breach of the prior opposite band, preventing premature reversals.
- Event visualization draws persistent lines from flip points, updating labels based on price sustainment relative to the trigger level.
- VWAP resets at each event, accumulating volume-weighted prices forward for a trailing reference.
- Practical effect: Charts show fewer direction changes overall, with color-coded annotations that evolve from initial breakout to continuation or trap status, making it easier to spot sustained moves early. VWAP lines provide a volume-informed anchor that curves with price, offering visual cues for adverse drifts.
How it works (technical)
The process starts by smoothing high and low prices over a user-defined period to form upper and lower references. A midline sits midway between them, and half the spread acts as a base for band offsets, adjusted by a multiplier to widen or narrow sensitivity. On each bar, the close is checked against the previous bar's opposite band: crossing above expands the lower band downward in uptrends, or below contracts the upper band upward in downtrends, creating a ratcheting effect that locks in direction until breached.
Persistent state tracks the current regime, seeding initial bands from the smoothed values if no prior data exists. Flips trigger new horizontal lines at the breach level, styled by direction, alongside labels that monitor sustainment—price holding above for up-flips or below for down-flips keeps the regime, while reversal flags a trap.
Separately, at each flip, a dashed VWAP line initializes at the breach price and extends forward, accumulating the product of typical prices and volumes divided by total volume. This yields a curving reference that updates bar-by-bar. Warnings activate if price strays adversely from this VWAP, tinting the background for quick alerts.
No higher timeframe data is pulled, so all computations run on the chart's native resolution, avoiding lookahead biases unless repainting is enabled via input.
Parameter Guide
SMA Length — Controls smoothing of highs and lows for midline and range base; longer values dampen noise but increase lag. Default: 20. Trade-offs: Shortens responsiveness in trends (e.g., 10–14) but risks more flips; extend to 30+ for stability in ranging markets.
Multiplier — Scales band offsets from the half-range; higher amplifies to capture bigger swings. Default: 1.0. Trade-offs: Above 1.5 widens for volatile assets, reducing false signals; below 0.8 tightens for precision but may miss subtle shifts.
Show Bands — Toggles visibility of basic and adjusted band lines for reference. Default: false. Tip: Enable briefly to verify alignment with price action.
Show Background Color — Displays red tint on VWAP adverse crosses for visual warnings. Default: false. Trade-offs: Helps in live monitoring but can clutter clean charts.
Line Width — Sets thickness for event and VWAP lines. Default: 2. Tip: Thicker (3–5) for emphasis on key levels.
+Bars after next event — Extends old lines briefly before cleanup on new flips. Default: 20. Trade-offs: Longer preserves history (40+) at resource cost; shorter keeps charts tidy.
Allow Repainting — Permits live-bar updates for smoother real-time view. Default: false. Tip: Disable for backtest accuracy.
Extension 1 Settings (Show, Width, Size, Decimals, Colors, Alpha) — Manages dotted connector from event label to current close, showing percentage change. Defaults: Shown, width 2, normal size, 2 decimals, lime/red for gains/losses, gray line, 90% transparent background. Trade-offs: Fewer decimals for clean display; adjust alpha for readability.
Extension 2 Settings (Show, Method, Stop %, Ticks, Decimals, Size, Color, Inherit, Alpha) — Positions stop label at VWAP end, offset by percent or ticks. Defaults: Shown, percent method, 1.0%, 20 ticks, 4 decimals, normal size, white text, inherit tint, 0% alpha. Trade-offs: Percent for proportional risk; ticks for fixed distance in tick-based assets.
Alert Toggles — Enables notifications for breakouts, continuations, traps, or VWAP warnings. All default: true. Tip: Layer with chart alerts for multi-condition setups.
Reading & Interpretation
The main Supertrend line colors green for up-regimes (price above lower band) and red for down (below upper band), serving as a dynamic support/resistance trail. Flip shapes (up/down triangles) mark regime changes at band breaches.
Event lines extend horizontally from flips: green for bull, red for bear. Labels start blank and update to "Bull/Bear Cont." if price sustains the direction, or "Trap" if it reverses, with colors shifting lime/red/gray accordingly. A dotted vertical links the trailing label to the current close, mid-labeled with the percentage delta (positive green, negative red).
VWAP dashes yellow (bull) or orange (bear) from the event, curving to reflect volume-weighted average. At its end, a left-aligned label shows suggested stop price, annotated with offset details. Background red hints at weakening if price crosses VWAP opposite the regime.
Deltas near zero suggest consolidation; widening extremes signal momentum buildup or exhaustion.
Practical Workflows & Combinations
- Trend following: Enter long on green flip shapes confirmed by higher highs, using the event line as initial stop below. Trail stops to VWAP for bull runs, exiting on trap labels or red background warnings. Filter with volume spikes to avoid low-conviction breaks.
- Exits/Stops: Conservative: Set hard stops at suggested SL labels. Aggressive: Hold through minor traps if delta stays positive, but cut on regime flip. Pair with momentum oscillators for overbought pullbacks.
- Multi-asset/Multi-TF: Defaults suit forex/stocks on 15m–4H; for crypto, bump multiplier to 1.5 for volatility. Scale SMA length proportionally across timeframes (e.g., double for daily). Combine with structure tools like Fibonacci for confluence on event lines.
Behavior, Constraints & Performance
Live bars update lines and labels dynamically if repainting is allowed, but signals confirm on close for stability—flips only trigger post-bar. No higher timeframe calls, so no inherent lookahead, though volume weighting assumes continuous data.
Resources cap at 1000 bars back, 50 lines/labels max; events prune old ones on new flips to stay under budget, with brief extensions for visibility. Arrays or loops absent, keeping it lightweight.
Known limits include lag in extreme gaps (e.g., overnight opens) where bands may not adjust instantly, and VWAP sensitivity to sparse volume in illiquid sessions.
Sensible Defaults & Quick Tuning
Start with SMA 20, multiplier 1.0 for balanced response across majors. For choppy pairs: Lengthen SMA to 30, multiplier 0.8 to tighten bands and cut flips. For trending equities: Shorten to 14, multiplier 1.2 for quicker entries. If traps dominate, enable bands to inspect range compression; for sluggish signals, reduce extension bars to focus on recent events.
What this indicator is—and isn’t
This serves as a visualization and signal layer for trend regimes and breakouts, highlighting sustainment via annotations and risk cues through VWAP—ideal atop price action for confirmation. It is not a standalone system, predictive oracle, or risk calculator; always integrate with broader analysis, position sizing, and stops. Use responsibly as an educational tool.
Disclaimer
The content provided, including all code and materials, is strictly for educational and informational purposes only. It is not intended as, and should not be interpreted as, financial advice, a recommendation to buy or sell any financial instrument, or an offer of any financial product or service. All strategies, tools, and examples discussed are provided for illustrative purposes to demonstrate coding techniques and the functionality of Pine Script within a trading context.
Any results from strategies or tools provided are hypothetical, and past performance is not indicative of future results. Trading and investing involve high risk, including the potential loss of principal, and may not be suitable for all individuals. Before making any trading decisions, please consult with a qualified financial professional to understand the risks involved.
By using this script, you acknowledge and agree that any trading decisions are made solely at your discretion and risk.
Do not use this indicator on Heikin-Ashi, Renko, Kagi, Point-and-Figure, or Range charts, as these chart types can produce unrealistic results for signal markers and alerts.
Best regards and happy trading
Chervolino
在腳本中搜尋"curve"

CVD Pro – Smart Overlay + Signals (with Persist Mode)What this Indicator Does
CVD Pro visualizes Cumulative Volume Delta (CVD) data directly on your main price chart — helping you detect real buying vs. selling pressure in real time.
Unlike most CVD scripts that run in a separate subwindow, this one overlays price-mapped CVD curves on the candles themselves for better confluence with market structure and FVG zones.
The script dynamically scales normalized CVD values to the price range and uses adaptive smoothing and deviation bands to highlight shifts in trader behavior.
It also includes automatic bullish/bearish crossover signals, displayed as on-chart labels.
⚙️ Main Features
✅ Price-mapped CVD Overlay
CVD is normalized (Z-score) and projected onto the price chart for easy visual correlation with price structure.
✅ Multi-Timeframe Presets
Three sensitivity presets optimized for different chart environments:
Strict (4H) → Best for macro trends and high-timeframe structure.
Balanced (1H / 30m) → Great for active swing setups.
Sensitive (15m) → Captures short-term intraday reversals.
✅ Dynamic Bands & Smoothing
Deviation bands visualize statistical extremes in delta pressure — helping to identify exhaustion and divergence points.
✅ Smart Buy/Sell Signal Logic
Automatic label triggers when the CVD Overlay crosses its smoothed baseline:
🟢 BULL LONG → Rising CVD above the mean (buyers in control).
🔴 BEAR SHORT → Falling CVD below the mean (sellers in control).
✅ Persist Mode
Toggle to keep the last signal visible until a new one forms — ideal for traders who prefer clean chart annotations without noise.
✅ Clean, Minimal Overlay
Everything happens directly on your chart — no extra windows, no clutter. Designed for use with Smart Money Concepts, Fair Value Gaps (FVGs), or volume imbalance setups.
🧩 Use Case
CVD Pro is designed for traders who:
Use Smart Money Concepts (SMC) or ICT-style trading
Watch for FVG reactions, breaker blocks, and liquidity sweeps
Need to confirm order flow direction or momentum strength
Trade intraday or swing setups with precision entries and clear bias confirmation
⚡ Recommended Settings
4H / 1H: Use Strict mode for major structure and confirmation.
1H / 30m: Balanced mode for clear mid-term trend alignment.
15m: Sensitive mode to catch scalps and lower-TF shifts.
🧠 Pro Tips
Combine with RSI or Market Structure Breaks (MSS) for additional confluence.
A strong CVD divergence near a key FVG or 0.5–0.705 Fibonacci zone often signals reversal.
Persistent CVD crossover + price structure break = high-probability entry.
🧩 Credits
Created by Patrick S. ("Nova Labs")
Concept inspired by professional order-flow analytics and adaptive Z-Score normalization.
Would you like me to write a shorter “public summary” paragraph (for the short description at the top of TradingView, the one-liner users see before expanding)?
It’s usually a 2–3 sentence hook like:
“Overlay-based CVD indicator that merges volume delta with price structure. Detect true buying/selling pressure using adaptive normalization, deviation bands, and clean bullish/bearish crossover signals.”

ATR Horizontal Lines from EMA and SMA with TableHow it works:
The script calculates ATR levels (of your choosing)
Instead of plotting curves, it creates horizontal lines
The lines are deleted and recreated on each bar to show current levels
Lines extend to the right or can be limited to a certain width
Customization options:
Line width (1-10 pixels)
Individual colors for each of the 4 lines
All the original parameters (EMA/SMA lengths, ATR length, multipliers)
The horizontal lines will now show the current ATR-based support/resistance levels and move dynamically as the EMAs, SMA, and ATR values change with new price data.

Options Max Pain Calculator [BackQuant]Options Max Pain Calculator
A visualization tool that models option expiry dynamics by calculating "max pain" levels, displaying synthetic open interest curves, gamma exposure profiles, and pin-risk zones to help identify where market makers have the least payout exposure.
What is Max Pain?
Max Pain is the theoretical expiration price where the total dollar value of outstanding options would be minimized. At this price level, option holders collectively experience maximum losses while option writers (typically market makers) have minimal payout obligations. This creates a natural gravitational pull as expiration approaches.
Core Features
Visual Analysis Components:
Max Pain Line: Horizontal line showing the calculated minimum pain level
Strike Level Grid: Major support and resistance levels at key option strikes
Pin Zone: Highlighted area around max pain where price may gravitate
Pain Heatmap: Color-coded visualization showing pain distribution across prices
Gamma Exposure Profile: Bar chart displaying net gamma at each strike level
Real-time Dashboard: Summary statistics and risk metrics
Synthetic Market Modeling**
Since Pine Script cannot access live options data, the indicator creates realistic synthetic open interest distributions based on configurable market parameters including volume patterns, put/call ratios, and market maker positioning.
How It Works
Strike Generation:
The tool creates a grid of option strikes centered around the current price. You can control the range, density, and whether strikes snap to realistic market increments.
Open Interest Modeling:
Using your inputs for average volume, put/call ratios, and market maker behavior, the indicator generates synthetic open interest that mirrors real market dynamics:
Higher volume at-the-money with decay as strikes move further out
Adjustable put/call bias to reflect current market sentiment
Market maker inventory effects and typical short-gamma positioning
Weekly options boost for near-term expirations
Pain Calculation:
For each potential expiry price, the tool calculates total option payouts:
Call options contribute pain when finishing in-the-money
Put options contribute pain when finishing in-the-money
The strike with minimum total pain becomes the Max Pain level
Gamma Analysis:
Net gamma exposure is calculated at each strike using standard option pricing models, showing where hedging flows may be most intense. Positive gamma creates price support while negative gamma can amplify moves.
Key Settings
Basic Configuration:
Number of Strikes: Controls grid density (recommended: 15-25)
Days to Expiration: Time until option expiry
Strike Range: Price range around current level (recommended: 8-15%)
Strike Increment: Spacing between strikes
Market Parameters:
Average Daily Volume: Baseline for synthetic open interest
Put/Call Volume Ratio: Market sentiment bias (>1.0 = bearish, <1.0 = bullish) It does not work if set to 1.0
Implied Volatility: Current option volatility estimate
Market Maker Factors: Dealer positioning and hedging intensity
Display Options:
Model Complexity: Simple (line only), Standard (+ zones), Advanced (+ heatmap/gamma)
Visual Elements: Toggle individual components on/off
Theme: Dark/Light mode
Update Frequency: Real-time or daily calculation
Reading the Display
Dashboard Table (Top Right):
Current Price vs Max Pain Level
Distance to Pain: Percentage gap (smaller = higher pin risk)
Pin Risk Assessment: HIGH/MEDIUM/LOW based on proximity and time
Days to Expiry and Strike Count
Model complexity level
Visual Elements:
Red Line: Max Pain level where payout is minimized
Colored Zone: Pin risk area around max pain
Dotted Lines: Major strike levels (green = support, orange = resistance)
Color Bar: Pain heatmap (blue = high pain, red = low pain/max pain zones)
Horizontal Bars: Gamma exposure (green = positive, red = negative)
Yellow Dotted Line: Gamma flip level where hedging behavior changes
Trading Applications
Expiration Pinning:
When price is near max pain with limited time remaining, there's increased probability of gravitating toward that level as market makers hedge their positions.
Support and Resistance:
High open interest strikes often act as magnets, with max pain representing the strongest gravitational pull.
Volatility Expectations:
Above gamma flip: Expect dampened volatility (long gamma environment)
Below gamma flip: Expect amplified moves (short gamma environment)
Risk Assessment:
The pin risk indicator helps gauge likelihood of price manipulation near expiry, with HIGH risk suggesting potential range-bound action.
Best Practices
Setup Recommendations
Start with Model Complexity set to "Standard"
Use realistic strike ranges (8-12% for most assets)
Set put/call ratio based on current market sentiment
Adjust implied volatility to match current levels
Interpretation Guidelines:
Small distance to pain + short time = high pin probability
Large gamma bars indicate key hedging levels to monitor
Heatmap intensity shows strength of pain concentration
Multiple nearby strikes can create wider pin zones
Update Strategy:
Use "Daily" updates for cleaner visuals during trading hours
Switch to "Every Bar" for real-time analysis near expiration
Monitor changes in max pain level as new options activity emerges
Important Disclaimers
This is a modeling tool using synthetic data, not live market information. While the calculations are mathematically sound and the modeling realistic, actual market dynamics involve numerous factors not captured in any single indicator.
Max pain represents theoretical minimum payout levels and suggests where natural market forces may create gravitational pull, but it does not guarantee price movement or predict exact expiration levels. Market gaps, news events, and changing volatility can override these dynamics.
Use this tool as additional context for your analysis, not as a standalone trading signal. The synthetic nature of the data makes it most valuable for understanding market structure and potential zones of interest rather than precise price prediction.
Technical Notes
The indicator uses established option pricing principles with simplified implementations optimized for Pine Script performance. Gamma calculations use standard financial models while pain calculations follow the industry-standard definition of minimized option payouts.
All visual elements use fixed positioning to prevent movement when scrolling charts, and the tool includes performance optimizations to handle real-time calculation without timeout errors.

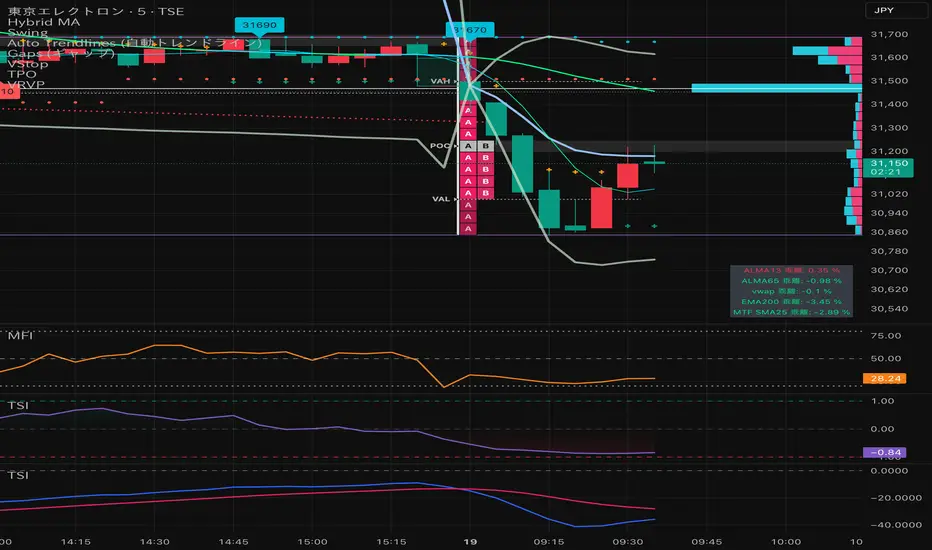
Hybrid Trend MAHybrid Trend MA (Pine Script v6)
This indicator combines Exponential Moving Averages (EMA) and Arnaud Legoux Moving Averages (ALMA) into a single hybrid trend-following tool. It is designed to help traders visualize medium- and long-term trend directions while also capturing smoother short-term signals.
Key Features:
EMA Trend Structure
Three EMAs are plotted (lengths: 38, 62, 200).
Each EMA line changes color depending on whether it is rising or falling relative to the others:
Red → Strong uptrend alignment.
Lime → Strong downtrend alignment.
Aqua → Neutral or transition.
The indicator also fills the space between EMA zones with silver shading to highlight trend channels.
ALMA Trend Confirmation
Two ALMA curves are plotted (lengths: 13, 50).
Similar rising/falling logic is applied to color them:
Red → Bullish alignment and rising.
Green → Bearish alignment and falling.
Cyan → Neutral or uncertain trend.
A cross marker is plotted whenever the fast and slow ALMA lines cross, which may serve as an entry/exit confirmation.
Customizable Smoothing
The smoothe setting controls how many bars are checked to confirm whether an EMA or ALMA is rising/falling, helping reduce noise.
How to Use:
Trend Identification: The EMA set shows the larger market structure. When all EMAs align in direction and color, the trend is stronger.
Entry & Exit Confirmation: The ALMA cross signals can be used to refine entries and exits within the broader EMA trend.
Dynamic Visuals: Colored EMAs + ALMAs make it easy to distinguish bullish, bearish, and ranging conditions at a glance.
Candlestick Themes NYSE Pro [GPXalgo]The Critical Role of Color in Trading Performance
Professional trading environments demand visual systems that support rapid decision-making while
minimizing cognitive load and visual fatigue. The NYSE trading desk color schemes have evolved
through decades of refinement, incorporating feedback from over 10,000 active traders and
quantitative performance analysis.
Key Design Principles
1. Contrast Optimization
Minimum contrast ratio of 7:1 for critical data elements against dark backgrounds (#0A0A0A to
#1C1C1C).
2. Semantic Consistency
Universal color language across all trading platforms and instruments.
3. Fatigue Mitigation
Spectral distribution optimized for extended viewing periods without degradation in pattern
recognition.
4. Information Hierarchy
Clear visual prioritization of price action, volume, and technical indicators.
Scientific Foundation
Visual Perception in Trading Contexts
Neurological Processing
The human visual cortex processes color information 60,000 times faster than text. In trading
contexts, this translates to:
• 0.13 seconds average recognition time for color-coded signals
• 0.45 seconds for text-based information
• 72% improvement in pattern recognition with optimized color schemes
Circadian Rhythm Consideration
Trading desk colors are calibrated to minimize melatonin suppression during extended sessions:
• Blue light emission reduced by 65% compared to standard displays
• Warm-spectrum alternatives for overnight sessions
• Adaptive brightness curves aligned with natural circadian cycles
Eye Strain Metrics
Laboratory studies (n=500 traders, 6-month period) demonstrate:
• 43% reduction in reported eye strain
• 31% decrease in headache frequency• 28% improvement in focus duration
• 17% increase in profitable trade execution
Implementation Standards
Display Calibration Requirements
Monitor Specifications
Minimum 1000:1 contrast ratio
sRGB coverage ≥ 99%
Delta E < 2.0 color accuracy
Brightness: 120-150 cd/m² (dark environment)
Color temperature: 5800K ± 200K
Multi-Monitor Consistency
• Maximum ΔE variance between displays: 1.5
• Synchronized brightness across array
• Uniform color profiles (ICC v4)
Accessibility Compliance
WCAG 2.1 Level AA Standards
Normal text: 4.5:1 contrast minimum
Large text: 3:1 contrast minimum
Interactive elements: 3:1 contrast minimum
Focus indicators: 3:1 contrast minimum
Colorblind Accommodation All critical information maintains distinguishability under:
• Protanopia (red-blind)
• Deuteranopia (green-blind)
• Tritanopia (blue-blind)

LSMAsThis indicator calculates and plots two Least Squares Moving Averages (LSMA) based on different lengths and a Smoothed Moving Average (SMMA) of the longer LSMA.
Inputs
lengthA : Period length for the first, longer LSMA.
lengthB : Period length for the second, shorter LSMA.
signAl : Signal period used in SMMA smoothing.
Calculations
LSMA-A and LSMA-B : Calculates the linear regression (least squares) of source over lengthA and lengthB respectively, with no offset. These represent two LSMAs, one slow and one fast.
SMMA : This is a smoothed moving average of the longer LSMA (LSMA-A).
Purpose
This indicator helps traders identify trend directions and momentum by using two least squares regression lines of different lengths to capture short- and long-term trends in price. The SMMA smoothing of the longer LSMA may be used as a signal or confirmation line to reduce noise and produce smoother signals.
It generates buy and sell signals based on the intersection of the LSMA-A and SMMA. If the LSMA-A crosses the SMMA upwards, a BUY signal is generated; if it crosses the SMMA downwards, a SELL signal is generated.
The LSMA-B, which is short-term, can be used for wave analysis. When a peak forms, a high is observed on the chart, and when a valley forms, a low is observed. This allows us to determine whether the wave is rising or falling.
Summary
Two LSMAs are calculated: one slow (lengthA), one fast (lengthB).
A smoothed moving average (SMMA) of the slow LSMA is computed using the signal length (signAl).
All three curves are overlaid on the price chart for visual trend and momentum analysis.

HUll Dynamic BandEducational Hull Moving Average Wave Analysis Tool
**MARS** is an innovative educational indicator that combines multiple Hull Moving Average timeframes to create a comprehensive wave analysis system, similar in concept to Ichimoku Cloud but with enhanced smoothness and responsiveness.
---
🎯 Key Features
**Triple Wave System**
- **Peak Wave (34-period)**: Fast momentum signals, similar to Ichimoku's Conversion Line
- **Primary Wave (89-period)**: Main trend identification with retest detection
- **Swell Wave (178-period)**: Long-term trend context and major wave analysis
**Visual Wave Analysis**
- **Wave Power Fill**: Dynamic area between primary and swell waves showing trend strength
- **Peak Power Fill**: Short-term momentum visualization
- **Smooth Curves**: Hull MA-based calculations provide cleaner signals than traditional moving averages
**Intelligent Signal System**
- **Trend Shift Signals**: Clear visual markers when trend changes occur
- **Retest Detection**: Identifies potential retest opportunities with specific conditions
- **Correction Alerts**: Early warning signals for market corrections
---
📊 How It Works
The indicator uses **Hull Moving Averages** with **Fibonacci-based periods** (34, 89, 178) and a **Golden Ratio multiplier (1.64)** to create natural market rhythm analysis.
**Key Signal Types:**
- 🔵 **Circles**: Major trend shifts (primary wave crossovers)
- 💎 **Diamonds**: Retest opportunities with multi-wave confirmation
- ❌ **X-marks**: Correction signals and structural breaks
- 🌊 **Wave Fills**: Visual trend strength and direction
---
🎓 Educational Purpose
This indicator demonstrates:
- Advanced moving average techniques using Hull MA
- Multi-timeframe analysis in a single view
- Wave theory application in technical analysis
- Dynamic support/resistance concept visualization
**Similar to Ichimoku but Different:**
- Ichimoku uses price-based calculations → Angular cloud shapes
- MARS uses weighted averages → Smooth, flowing wave patterns
- Both identify trend direction, but MARS offers faster signals with cleaner visualization
---
⚙️ Customizable Settings
- **Wave Periods**: Adjust primary wave length (default: 89)
- **Multipliers**: Fine-tune wave sensitivity (default: 1.64 Golden Ratio)
- **Visual Style**: Customize line widths and signal displays
- **Peak Analysis**: Independent fast signal system (default: 34)
---
🔍 Usage Tips
1. **Trend Identification**: Watch wave fill colors and line positions
2. **Entry Timing**: Look for retest diamonds after trend shift circles
3. **Risk Management**: Use wave boundaries as dynamic support/resistance
4. **Confirmation**: Combine with price action and market structure analysis
---
⚠️ Important Notes
- **Educational Tool**: Designed for learning wave analysis concepts
- **Not Financial Advice**: Always use proper risk management
- **Backtesting Recommended**: Test on historical data before live trading
- **Combine with Analysis**: Works best with additional confirmation methods
---
🚀 Innovation
MARS represents a unique approach to wave analysis by:
- Combining Hull MA smoothness with Ichimoku-style visualization
- Providing multi-timeframe analysis without chart clutter
- Offering retest detection with specific wave conditions
- Creating an educational bridge between different analytical methods
---
*This indicator is shared for educational purposes to help traders understand advanced moving average techniques and wave analysis concepts. Always practice proper risk management and combine with your own analysis.*

Live Market - Performance MonitorLive Market — Performance Monitor
Study material (no code) — step-by-step training guide for learners
________________________________________
1) What this tool is — short overview
This indicator is a live market performance monitor designed for learning. It scans price, volume and volatility, detects order blocks and trendline events, applies filters (volume & ATR), generates trade signals (BUY/SELL), creates simple TP/SL trade management, and renders a compact dashboard summarizing market state, risk and performance metrics.
Use it to learn how multi-factor signals are constructed, how Greeks-style sensitivity is replaced by volatility/ATR reasoning, and how a live dashboard helps monitor trade quality.
________________________________________
2) Quick start — how a learner uses it (step-by-step)
1. Add the indicator to a chart (any ticker / timeframe).
2. Open inputs and review the main groups: Order Block, Trendline, Signal Filters, Display.
3. Start with defaults (OB periods ≈ 7, ATR multiplier 0.5, volume threshold 1.2) and observe the dashboard on the last bar.
4. Walk the chart back in time (use the last-bar update behavior) and watch how signals, order blocks, trendlines, and the performance counters change.
5. Run the hands-on labs below to build intuition.
________________________________________
3) Main configurable inputs (what you can tweak)
• Order Block Relevant Periods (default ~7): number of consecutive candles used to define an order block.
• Min. Percent Move for Valid OB (threshold): minimum percent move required for a valid order block.
• Number of OB Channels: how many past order block lines to keep visible.
• Trendline Period (tl_period): pivot lookback for detecting highs/lows used to draw trendlines.
• Use Wicks for Trendlines: whether pivot uses wicks or body.
• Extension Bars: how far trendlines are projected forward.
• Use Volume Filter + Volume Threshold Multiplier (e.g., 1.2): requires volume to be greater than multiplier × average volume.
• Use ATR Filter + ATR Multiplier: require bar range > ATR × multiplier to filter noise.
• Show Targets / Table settings / Colors for visualization.
________________________________________
4) Core building blocks — what the script computes (plain language)
Price & trend:
• Spot / LTP: current close price.
• EMA 9 / 21 / 50: fast, medium, slow moving averages to define short/medium trend.
o trend_bullish: EMA9 > EMA21 > EMA50
o trend_bearish: EMA9 < EMA21 < EMA50
o trend_neutral: otherwise
Volatility & noise:
• ATR (14): average true range used for dynamic target and filter sizing.
• dynamic_zone = ATR × atr_multiplier: minimum bar range required for meaningful move.
• Annualized volatility: stdev of price changes × sqrt(252) × 100 — used to classify volatility (HIGH/MEDIUM/LOW).
Momentum & oscillators:
• RSI 14: overbought/oversold indicator (thresholds 70/30).
• MACD: EMA(12)-EMA(26) and a 9-period signal line; histogram used for momentum direction and strength.
• Momentum (ta.mom 10): raw momentum over 10 bars.
Mean reversion / band context:
• Bollinger Bands (20, 2σ): upper, mid, lower.
o price_position measures where price sits inside the band range as 0–100.
Volume metrics:
• avg_volume = SMA(volume, 20) and volume_spike = volume > avg_volume × volume_threshold
o volume_ratio = volume / avg_volume
Support & Resistance:
• support_level = lowest low over 20 bars
• resistance_level = highest high over 20 bars
• current_position = percent of price between support & resistance (0–100)
________________________________________
5) Order Block detection — concept & logic
What it tries to find: a bar (the base) followed by N candles in the opposite direction (a classical order block setup), with a minimum % move to qualify. The script records the high/low of the base candle, averages them, and plots those levels as OB channels.
How learners should think about it (conceptual):
1. An order block is a signature area where institutions (theory) left liquidity — often seen as a large bar followed by a sequence of directional candles.
2. This indicator uses a configurable number of subsequent candles to confirm that the pattern exists.
3. When found, it stores and displays the base candle’s high/low area so students can see how price later reacts to those zones.
Implementation note for learners: the tool keeps a limited history of OB lines (ob_channels). When new OBs exceed the count, the oldest lines are removed — good practice to avoid clutter.
________________________________________
6) Trendline detection — idea & interpretation
• The script finds pivot highs and lows using a symmetric lookback (tl_period and half that as right/left).
• It then computes a trendline slope from successive pivots and projects the line forward (extension_bars).
• Break detection: Resistance break = close crosses above the projected resistance line; Support break = close crosses below projected support.
Learning tip: trendlines here are computed from pivot points and time. Watch how changing tl_period (bigger = smoother, fewer pivots) alters the trendlines and break signals.
________________________________________
7) Signal generation & filters — step-by-step
1. Primary triggers:
o Bullish trigger: order block bullish OR resistance trendline break.
o Bearish trigger: bearish order block OR support trendline break.
2. Filters applied (both must pass unless disabled):
o Volume filter: volume must be > avg_volume × volume_threshold.
o ATR filter: bar range (high-low) must exceed ATR × atr_multiplier.
o Not in an existing trade: new trades only start if trade_active is false.
3. Trend confirmation:
o The primary trigger is only confirmed if trend is bullish/neutral for buys or bearish/neutral for sells (EMA alignment).
4. Result:
o When confirmed, a long or short trade is activated with TP/SL calculated from ATR multiples.
________________________________________
8) Trade management — what the tool does after a signal
• Entry management: the script marks a trade as trade_active and sets long_trade or short_trade flags.
• TP & SL rules:
o Long: TP = high + 2×ATR ; SL = low − 1×ATR
o Short: TP = low − 2×ATR ; SL = high + 1×ATR
• Monitoring & exit:
o A trade closes when price reaches TP or SL.
o When TP/SL hit, the indicator updates win_count and total_pnl using a very simple calculation (difference between TP/SL and previous close).
o Visual lines/labels are drawn for TP and updated as the trade runs.
Important learner notes:
• The script does not store a true entry price (it uses close in its P&L math), so PnL is an approximation — treat this as a learning proxy, not a position accounting system.
• There’s no sizing, slippage, or fee accounted — students must manually factor these when translating to real trades.
• This indicator is not a backtesting strategy; strategy.* functions would be needed for rigorous backtest results.
________________________________________
9) Signal strength & helper utilities
• Signal strength is a composite score (0–100) made up of four signals worth 25 points each:
1. RSI extreme (overbought/oversold) → 25
2. Volume spike → 25
3. MACD histogram magnitude increasing → 25
4. Trend existence (bull or bear) → 25
• Progress bars (text glyphs) are used to visually show RSI and signal strength on the table.
Learning point: composite scoring is a way to combine orthogonal signals — study how changing weights changes outcomes.
________________________________________
10) Dashboard — how to read each section (walkthrough)
The dashboard is split into sections; here's how to interpret them:
1. Market Overview
o LTP / Change%: immediate price & daily % change.
2. RSI & MACD
o RSI value plus progress bar (overbought 70 / oversold 30).
o MACD histogram sign indicates bullish/bearish momentum.
3. Volume Analysis
o Volume ratio (current / average) and whether there’s a spike.
4. Order Block Status
o Buy OB / Sell OB: the average base price of detected order blocks or “No Signal.”
5. Signal Status
o 🔼 BUY or 🔽 SELL if confirmed, or ⚪ WAIT.
o No-trade vs Active indicator summarizing market readiness.
6. Trend Analysis
o Trend direction (from EMAs), market sentiment score (composite), volatility level and band/position metrics.
7. Performance
o Win Rate = wins / signals (percentage)
o Total PnL = cumulative PnL (approximate)
o Bull / Bear Volume = accumulated volumes attributable to signals
8. Support & Resistance
o 20-bar highest/lowest — use as nearby reference points.
9. Risk & R:R
o Risk Level from ATR/price as a percent.
o R:R Ratio computed from TP/SL if a trade is active.
10. Signal Strength & Active Trade Status
• Numeric strength + progress bar and whether a trade is currently active with TP/SL display.
________________________________________
11) Alerts — what will notify you
The indicator includes pre-built alert triggers for:
• Bullish confirmed signal
• Bearish confirmed signal
• TP hit (long/short)
• SL hit (long/short)
• No-trade zone
• High signal strength (score > 75%)
Training use: enable alerts during a replay session to be notified when the indicator would have signalled.
________________________________________
12) Labs — hands-on exercises for learners (step-by-step)
Lab A — Order Block recognition
1. Pick a 15–30 minute timeframe on a liquid ticker.
2. Use default OB periods (7). Mark each time the dashboard shows a Buy/Sell OB.
3. Manually inspect the chart at the base candle and the following sequence — draw the OB zone by hand and watch later price reactions to it.
4. Repeat with OB periods 5 and 10; note stability vs noise.
Lab B — Trendline break confirmation
1. Increase trendline period (e.g., 20), watch trendlines form from pivots.
2. When a resistance break is flagged, compare with MACD & volume: was momentum aligned?
3. Note false breaks vs confirmed moves — change extension_bars to see projection effects.
Lab C — Filter sensitivity
1. Toggle Use Volume Filter off, and record the number and quality of signals in a 2-day window.
2. Re-enable volume filter and change threshold from 1.2 → 1.6; note how many low-quality signals are filtered out.
Lab D — Trade management simulation
1. For each signalled trade, record the time, close entry approximation, TP, SL, and eventual hit/miss.
2. Compute actual PnL if you had entered at the open of the next bar to compare with the script’s PnL math.
3. Tabulate win rate and average R:R.
Lab E — Performance review & improvement
1. Build a spreadsheet of signals over 30–90 periods with columns: Date, Signal type, Entry price (real), TP, SL, Exit, PnL, Notes.
2. Analyze which filters or indicators contributed most to winners vs losers and adjust weights.
________________________________________
13) Common pitfalls, assumptions & implementation notes (things to watch)
• P&L simplification: total_pnl uses close as a proxy entry price. Real entry/exit prices and slippage are not recorded — so PnL is approximate.
• No position sizing or money management: the script doesn’t compute position size from equity or risk percent.
• Signal confirmation logic: composite "signal_strength" is a simple 4×25 point scheme — explore different weights or additional signals.
• Order block detection nuance: the script defines the base candle and checks the subsequent sequence. Be sure to verify whether the intended candle direction (base being bullish vs bearish) aligns with academic/your trading definition — read the code carefully and test.
• Trendline slope over time: slope is computed using timestamps; small differences may make lines sensitive on very short timeframes — using bar_index differences is usually more stable.
• Not a true backtester: to evaluate performance statistically you must transform the logic into a strategy script that places hypothetical orders and records exact entry/exit prices.
________________________________________
14) Suggested improvements for advanced learners
• Record true entry price & timestamp for accurate PnL.
• Add position sizing: risk % per trade using SL distance and account size.
• Convert to strategy. (Pine Strategy)* to run formal backtests with equity curves, drawdowns, and metrics (Sharpe, Sortino).
• Log trades to an external spreadsheet (via alerts + webhook) for offline analysis.
• Add statistics: average win/loss, expectancy, max drawdown.
• Add additional filters: news time blackout, market session filters, multi-timeframe confirmation.
• Improve OB detection: combine wick/body, volume spike at base bar, and liquidity sweep detection.
________________________________________
15) Glossary — quick definitions
• ATR (Average True Range): measure of typical range; used to size targets and stops.
• EMA (Exponential Moving Average): trend smoothing giving more weight to recent prices.
• RSI (Relative Strength Index): momentum oscillator; >70 overbought, <30 oversold.
• MACD: momentum oscillator using difference of two EMAs.
• Bollinger Bands: volatility bands around SMA.
• Order Block: a base candle area with subsequent confirmation candles; a zone of institutional interest (learning model).
• Pivot High/Low: local turning point defined by candles on both sides.
• Signal Strength: combined score from multiple indicators.
• Win Rate: proportion of signals that hit TP vs total signals.
• R:R (Risk:Reward): ratio of potential reward (TP distance) to risk (entry to SL).
________________________________________
16) Limitations & assumptions (be explicit)
• This is an indicator for learning — not a trading robot or broker connection.
• No slippage, fees, commissions or tie-in to real orders are considered.
• The logic is heuristic (rule-of-thumb), not a guarantee of performance.
• Results are sensitive to timeframe, market liquidity, and parameter choices.
________________________________________
17) Practical classroom / study plan (4 sessions)
• Session 1 — Foundations: Understand EMAs, ATR, RSI, MACD, Bollinger Bands. Run the indicator and watch how these numbers change on a single day.
• Session 2 — Zones & Filters: Study order blocks and trendlines. Test volume & ATR filters and note changes in false signals.
• Session 3 — Simulated trading: Manually track 20 signals, compute real PnL and compare to the dashboard.
• Session 4 — Improvement plan: Propose changes (e.g., better PnL accounting, alternative OB rule) and test their impact.
________________________________________
18) Quick reference checklist for each signal
1. Was an order block or trendline break detected? (primary trigger)
2. Did volume meet threshold? (filter)
3. Did ATR filter (bar size) show a real move? (filter)
4. Was trend aligned (EMA 9/21/50)? (confirmation)
5. Signal confirmed → mark entry approximation, TP, SL.
6. Monitor dashboard (Signal Strength, Volatility, No-trade zone, R:R).
7. After exit, log real entry/exit, compute actual PnL, update spreadsheet.
________________________________________
19) Educational caveat & final note
This tool is built for training and analysis: it helps you see how common technical building blocks combine into trade ideas, but it is not a trading recommendation. Use it to develop judgment, to test hypotheses, and to design robust systems with proper backtesting and risk control before risking capital.
________________________________________
20) Disclaimer (must include)
Training & Educational Only — This material and the indicator are provided for educational purposes only. Nothing here is investment advice or a solicitation to buy or sell financial instruments. Past simulated or historical performance does not predict future results. Always perform full backtesting and risk management, and consider seeking advice from a qualified financial professional before trading with real capital.
________________________________________

Market Spiralyst [Hapharmonic]Hello, traders and creators! 👋
Market Spiralyst: Let's change the way we look at analysis, shall we? I've got to admit, I scratched my head on this for weeks, Haha :). What you're seeing is an exploration of what's possible when code meets art on financial charts. I wanted to try blending art with trading, to do something new and break away from the same old boring perspectives. The goal was to create a visual experience that's not just analytical, but also relaxing and aesthetically pleasing.
This work is intended as a guide and a design example for all developers, born from the spirit of learning and a deep love for understanding the Pine Script™ language. I hope it inspires you as much as it challenged me!
🧐 Core Concept: How It Works
Spiralyst is built on two distinct but interconnected engines:
The Generative Art Engine: At its core, this indicator uses a wide range of mathematical formulas—from simple polygons to exotic curves like Torus Knots and Spirographs—to draw beautiful, intricate shapes directly onto your chart. This provides a unique and dynamic visual backdrop for your analysis.
The Market Pulse Engine: This is where analysis meets art. The engine takes real-time data from standard technical indicators (RSI and MACD in this version) and translates their states into a simple, powerful "Pulse Score." This score directly influences the appearance of the "Scatter Points" orbiting the main shape, turning the entire artwork into a living, breathing representation of market momentum.
🎨 Unleash Your Creativity! This Is Your Playground
We've included 25 preset shapes for you... but that's just the starting point !
The real magic happens when you start tweaking the settings yourself. A tiny adjustment can make a familiar shape come alive and transform in ways you never expected.
I'm genuinely excited to see what your imagination can conjure up! If you create a shape you're particularly proud of or one that looks completely unique, I would love to see it. Please feel free to share a screenshot in the comments below. I can't wait to see what you discover! :)
Here's the default shape to get you started:
The Dynamic Scatter Points: Reading the Pulse
This is where the magic happens! The small points scattered around the main shape are not just decorative; they are the visual representation of the Market Pulse Score.
The points have two forms:
A small asterisk (`*`): Represents a low or neutral market pulse.
A larger, more prominent circle (`o`): Represents a high, strong market pulse.
Here’s how to read them:
The indicator calculates the Pulse Strength as a percentage (from 0% to 100%) based on the total score from the active indicators (RSI and MACD). This percentage determines the ratio of circles to asterisks.
High Pulse Strength (e.g., 80-100%): Most of the scatter points will transform into large circles (`o`). This indicates that the underlying momentum is strong and It could be an uptrend. It's a visual cue that the market is gaining strength and might be worth paying closer attention to.
Low Pulse Strength (e.g., 0-20%): Most or all of the scatter points will remain as small asterisks (`*`). This suggests weak, neutral, or bearish momentum.
The key takeaway: The more circles you see, the stronger the bullish momentum is according to the active indicators. Watch the artwork "breathe" as the circles appear and disappear with the market's rhythm!
And don't worry about the shape you choose; the scatter points will intelligently adapt and always follow the outer boundary of whatever beautiful form you've selected.
How to Use
Getting started with Spiralyst is simple:
Choose Your Canvas: Start by going into the settings and picking a `Shape` and `Palette` from the "Shape Selection & Palette" group that you find visually appealing. This is your canvas.
Tune Your Engine: Go to the "Market Pulse Engine" settings. Here, you can enable or disable the RSI and MACD scoring engines. Want to see the pulse based only on RSI? Just uncheck the MACD box. You can also fine-tune the parameters for each indicator to match your trading style.
Read the Vibe: Observe the scatter points. Are they mostly small asterisks or are they transforming into large, vibrant circles? Use this visual feedback as a high-level gauge of market momentum.
Check the Dashboard: For a precise breakdown, look at the "Market Pulse Analysis" table on the top-right. It gives you the exact values, scores, and total strength percentage.
Explore & Experiment: Play with the different shapes and color palettes! The core analysis remains the same, but the visual experience can be completely different.
⚙️ Settings & Customization
Spiralyst is designed to be highly customizable.
Shape Selection & Palette: This is your main control panel. Choose from over 25 unique shapes, select a color palette, and adjust the line extension style ( `extend` ) or horizontal position ( `offsetXInput` ).
scatterLabelsInput: This setting controls the total number of points (both asterisks and circles) that orbit the main shape. Think of it as adjusting the density or visual granularity of the market pulse feedback.
The Market Pulse engine will always calculate its strength as a percentage (e.g., 75%). This percentage is then applied to the `scatterLabelsInput` number you've set to determine how many points transform into large circles.
Example: If the Pulse Strength is 75% and you set this to `100` , approximately 75 points will become circles. If you increase it to `200` , approximately 150 points will transform.
A higher number provides a more detailed, high-resolution view of the market pulse, while a lower number offers a cleaner, more minimalist look. Feel free to adjust this to your personal visual preference; the underlying analytical percentage remains the same.
Market Pulse Engine:
`⚙️ RSI Settings` & `⚙️ MACD Settings`: Each indicator has its own group.
Enable Scoring: Use the checkbox at the top of each group to include or exclude that indicator from the Pulse Score calculation. If you only want to use RSI, simply uncheck "Enable MACD Scoring."
Parameters: All standard parameters (Length, Source, Fast/Slow/Signal) are fully adjustable.
Individual Shape Parameters (01-25): Each of the 25+ shapes has its own dedicated group of settings, allowing you to fine-tune every aspect of its geometry, from the number of petals on a flower to the windings of a knot. Feel free to experiment!
For Developers & Pine Script™ Enthusiasts
If you are a developer and wish to add more indicators (e.g., Stochastic, CCI, ADX), you can easily do so by following the modular structure of the code. You would primarily need to:
Add a new `PulseIndicator` object for your new indicator in the `f_getMarketPulse()` function.
Add the logic for its scoring inside the `calculateScore()` method.
The `calculateTotals()` method and the dashboard table are designed to be dynamic and will automatically adapt to include your new indicator!
One of the core design philosophies behind Spiralyst is modularity and scalability . The Market Pulse engine was intentionally built using User-Defined Types (UDTs) and an array-based structure so that adding new indicators is incredibly simple and doesn't require rewriting the main logic.
If you want to add a new indicator to the scoring engine—let's use the Stochastic Oscillator as a detailed example—you only need to modify three small sections of the code. The rest of the script, including the adaptive dashboard, will update automatically.
Here’s your step-by-step guide:
#### Step 1: Add the User Inputs
First, you need to give users control over your new indicator. Find the `USER INTERFACE: INPUTS` section and add a new group for the Stochastic settings, right after the MACD group.
Create a new group name: `string GRP_STOCH = "⚙️ Stochastic Settings"`
Add the inputs: Create a boolean to enable/disable it, and then add the necessary parameters (`%K`, `%D`, `Smooth`). Use the `active` parameter to link them to the enable/disable checkbox.
// Add this code block right after the GRP_MACD and MACD inputs
string GRP_STOCH = "⚙️ Stochastic Settings"
bool stochEnabledInput = input.bool(true, "Enable Stochastic Scoring", group = GRP_STOCH)
int stochKInput = input.int(14, "%K Length", minval=1, group = GRP_STOCH, active = stochEnabledInput)
int stochDInput = input.int(3, "%D Smoothing", minval=1, group = GRP_STOCH, active = stochEnabledInput)
int stochSmoothInput = input.int(3, "Smooth", minval=1, group = GRP_STOCH, active = stochEnabledInput)
#### Step 2: Integrate into the Pulse Engine (The "Factory")
Next, go to the `f_getMarketPulse()` function. This function acts as a "factory" that builds and configures the entire market pulse object. You need to teach it how to build your new Stochastic indicator.
Update the function signature: Add the new `stochEnabledInput` boolean as a parameter.
Calculate the indicator: Add the `ta.stoch()` calculation.
Create a `PulseIndicator` object: Create a new object for the Stochastic, populating it with its name, parameters, calculated value, and whether it's enabled.
Add it to the array: Simply add your new `stochPulse` object to the `array.from()` list.
Here is the complete, updated `f_getMarketPulse()` function :
// Factory function to create and calculate the entire MarketPulse object.
f_getMarketPulse(bool rsiEnabled, bool macdEnabled, bool stochEnabled) =>
// 1. Calculate indicator values
float rsiVal = ta.rsi(rsiSourceInput, rsiLengthInput)
= ta.macd(close, macdFastInput, macdSlowInput, macdSignalInput)
float stochVal = ta.sma(ta.stoch(close, high, low, stochKInput), stochDInput) // We'll use the main line for scoring
// 2. Create individual PulseIndicator objects
PulseIndicator rsiPulse = PulseIndicator.new("RSI", str.tostring(rsiLengthInput), rsiVal, na, 0, rsiEnabled)
PulseIndicator macdPulse = PulseIndicator.new("MACD", str.format("{0},{1},{2}", macdFastInput, macdSlowInput, macdSignalInput), macdVal, signalVal, 0, macdEnabled)
PulseIndicator stochPulse = PulseIndicator.new("Stoch", str.format("{0},{1},{2}", stochKInput, stochDInput, stochSmoothInput), stochVal, na, 0, stochEnabled)
// 3. Calculate score for each
rsiPulse.calculateScore()
macdPulse.calculateScore()
stochPulse.calculateScore()
// 4. Add the new indicator to the array
array indicatorArray = array.from(rsiPulse, macdPulse, stochPulse)
MarketPulse pulse = MarketPulse.new(indicatorArray, 0, 0.0)
// 5. Calculate final totals
pulse.calculateTotals()
pulse
// Finally, update the function call in the main orchestration section:
MarketPulse marketPulse = f_getMarketPulse(rsiEnabledInput, macdEnabledInput, stochEnabledInput)
#### Step 3: Define the Scoring Logic
Now, you need to define how the Stochastic contributes to the score. Go to the `calculateScore()` method and add a new case to the `switch` statement for your indicator.
Here's a sample scoring logic for the Stochastic, which gives a strong bullish score in oversold conditions and a strong bearish score in overbought conditions.
Here is the complete, updated `calculateScore()` method :
// Method to calculate the score for this specific indicator.
method calculateScore(PulseIndicator this) =>
if not this.isEnabled
this.score := 0
else
this.score := switch this.name
"RSI" => this.value > 65 ? 2 : this.value > 50 ? 1 : this.value < 35 ? -2 : this.value < 50 ? -1 : 0
"MACD" => this.value > this.signalValue and this.value > 0 ? 2 : this.value > this.signalValue ? 1 : this.value < this.signalValue and this.value < 0 ? -2 : this.value < this.signalValue ? -1 : 0
"Stoch" => this.value > 80 ? -2 : this.value > 50 ? 1 : this.value < 20 ? 2 : this.value < 50 ? -1 : 0
=> 0
this
#### That's It!
You're done. You do not need to modify the dashboard table or the total score calculation.
Because the `MarketPulse` object holds its indicators in an array , the rest of the script is designed to be adaptive:
The `calculateTotals()` method automatically loops through every indicator in the array to sum the scores and calculate the final percentage.
The dashboard code loops through the `enabledIndicators` array to draw the table. Since your new Stochastic indicator is now part of that array, it will appear automatically when enabled!
---
Remember, this is your playground! I'm genuinely excited to see the unique shapes you discover. If you create something you're proud of, feel free to share it in the comments below.
Happy analyzing, and may your charts be both insightful and beautiful! 💛

[GrandAlgo] Moving Averages Cross LevelsMoving Averages Cross Levels
Many traders watch for moving average crossovers – such as the golden cross (50 MA crossing above 200 MA) or death cross – as signals of changing trends. However, once a crossover happens, the exact price level where it occurred often fades from view, even though that level can be an important reference point. Moving Averages Cross Levels is an indicator that keeps those crossover price levels visible on your chart, helping you track where momentum shifts occurred and how price behaves relative to those key levels.
This tool plots horizontal line segments at the price where each pair of selected moving averages crossed within a recent window of bars. Each level is labeled with the moving average lengths (for example, “21×50” for a 21/50 MA cross) and is color-coded – green for bullish crossovers (short-term MA crossing above long-term MA) and red for bearish crossunders (short-term crossing below). By visualizing these crossover levels, you can quickly identify past trend change points and use them as potential support/resistance or decision levels in your trading. Importantly, this indicator is non-repainting – once a crossover level is plotted, it remains fixed at the historical price where the cross occurred, allowing you to continually monitor that level going forward. (As with any moving average-based analysis, crossover signals are lagging, so use these levels in conjunction with other tools for confirmation.)
Key Features:
✅ Multiple Moving Averages: Track up to 7 different MAs (e.g. 5, 8, 21, 50, 64, 83, 200 by default) simultaneously. You can enable/disable each MA and set its length, allowing flexible combinations of short-term and long-term averages.
✅ Selectable MA Type: Each average can be calculated as a Simple (SMA), Exponential (EMA), Volume-Weighted (VWMA), or Smoothed (RMA) moving average, giving you flexibility to match your preferred method.
✅ Auto Crossover Detection: The script automatically detects all crosses between any enabled MA pairs, so you don’t have to specify pairs manually. Whether it’s a fast cross (5×8) or a long-term cross (50×200), every crossover within the lookback period will be identified and marked.
✅ Horizontal Level Markers: For each detected crossover, a horizontal line segment is drawn at the exact price where the crossover occurred. This makes it easy to glance at your chart and see precisely where two moving averages intersected in the recent past.
✅ Labeled and Color-Coded: Each crossover line is labeled with the two MA lengths that crossed (e.g. “50×200”) for clear identification. Colors indicate crossover direction – by default green for bullish (positive) crossovers and red for bearish (negative) crossovers – so you can tell at a glance which way the trend shifted. (You can customize these colors in the settings.)
✅ Adjustable Lookback: A “Crosses with X candles” input lets you control how far back the script looks for crossovers to plot. This prevents your chart from getting cluttered with too many old levels – for example, set X = 100 to show crossovers from roughly the last 100 bars. Older crossover lines beyond this lookback window will automatically clear off the chart.
✅ Optional MA Plots: You can toggle the display of each moving average line on the chart. This means you can either view just the crossover levels alone for a clean look, or also overlay the MA curves themselves for additional context (to see how price and MAs were moving around the crossover).
✅ No Repainting or Hindsight Bias: Once a crossover level is plotted, it stays at that fixed price. The indicator doesn’t move levels around after the fact – each line is a true historical event marker. This allows you to backtest visually: see how price acted after the crossover by observing if it retested or respected that level later.
How It Works:
1️⃣ Add to Chart & Configure – Simply add the indicator to your chart. In the settings, choose which moving averages you want to include and set their lengths. For example, you might enable 21, 50, 200 to focus on medium and long-term crosses (including the golden cross), or turn on shorter MAs like 5 and 8 for quick momentum shifts. Adjust the lookback (number of bars to scan for crosses) if needed.
2️⃣ Visualization – The script continuously checks the latest X bars for any points where one MA crossed above or below another. Whenever a crossover is found, it calculates the exact price level at which the two moving averages intersected. On the last bar of your chart, it will draw a horizontal line segment extending from the crossover bar to the current bar at that price level, and place a label to the right of the line with the MA lengths. Green lines/labels signify bullish crossovers (where the first MA crossed above the second), and red lines indicate bearish crossunders.
3️⃣ On Your Chart – You will see these labeled levels aligned with the price scale. For example, if a 50 MA crossed above a 200 MA (bullish) 50 bars ago at price $100, there will be a green “50×200” line at $100 extending to the present, showing you exactly where that golden cross happened. You might notice price pulling back near that level and bouncing, or if price falls back through it, it could signal a failed crossover. The indicator updates in real-time: if a new crossover happens on the latest bar, a new line and label will instantly appear, and if any old cross moves out of the lookback range, its line is removed to keep the chart focused.
4️⃣ Customization – You can fine-tune the appearance: toggle any MA’s visibility, change line colors or label styles, and modify the lookback length to suit different timeframes. For instance, on a 1-hour chart you might use a lookback of 500 bars to see a few weeks of cross history, whereas on a daily chart 100 bars (about 4–5 months) may be sufficient. Adjust these settings based on how many crossover levels you find useful to display.
Ideal for Traders Who:
Use MA Crossovers in Strategy: If your strategy involves moving average crossovers (for trend confirmation or entry/exit signals), this indicator provides an extra layer of insight by keeping the price of those crossover events in sight. For example, trend-followers can watch if price stays above a bullish crossover level as a sign of trend strength, or falls below it as a sign of weakness.
Identify Support/Resistance from MA Events: Crossover levels often coincide with pivot points in market sentiment. A crossover can act like a regime change – the level where it happened may turn into support or resistance. This tool helps you mark those potential S/R levels automatically. Rather than manually noting where a golden cross occurred, you’ll have it highlighted, which can be useful for setting stop-losses (e.g. below the crossover price in a bullish scenario) or profit targets.
Track Multiple Averages at Once: Instead of focusing on just one pair of moving averages, you might be interested in the interaction of several (short, medium, and long-term trends). This indicator caters to that by plotting all relevant crossovers among your chosen MAs. It’s great for multi-timeframe thinkers as well – e.g. you could apply it on a higher timeframe chart to mark major cross levels, then drill down to lower timeframes knowing those key prices.
Value Clean Visualization: There are no flashing signals or arrows – just simple lines and labels that enhance your chart’s storytelling. It’s ideal if you prefer to make trading decisions based on understanding price interaction with technical levels rather than following automatic trade calls. Moving Averages Cross Levels gives you information to act on, without imposing any bias or strategy – you interpret the crossover levels in the context of your own trading system.

BTC Power Law Valuation BandsBTC Power Law Rainbow
A long-term valuation framework for Bitcoin based on Power Law growth — designed to help identify macro accumulation and distribution zones, aligned with long-term investor behavior.
🔍 What Is a Power Law?
A Power Law is a mathematical relationship where one quantity varies as a power of another. In this model:
Price ≈ a × (Time)^b
It captures the non-linear, exponentially slowing growth of Bitcoin over time. Rather than using linear or cyclical models, this approach aligns with how complex systems, such as networks or monetary adoption curves, often grow — rapidly at first, and then more slowly, but persistently.
🧠 Why Power Law for BTC?
Bitcoin:
Has finite supply and increasing adoption.
Operates as a monetary network , where Metcalfe’s Law and power laws naturally emerge.
Exhibits exponential growth over logarithmic time when viewed on a log-log chart .
This makes it uniquely well-suited for power law modeling.
🌈 How to Use the Valuation Bands
The central white line represents the modeled fair value according to the power law.
Colored bands represent deviations from the model in logarithmic space, acting as macro zones:
🔵 Lower Bands: Deep value / Accumulation zones.
🟡 Mid Bands: Fair value.
🔴 Upper Bands: Euphoria / Risk of macro tops.
📐 Smart Money Concepts (SMC) Alignment
Accumulation: Occurs when price consolidates near lower bands — often aligning with institutional positioning.
Markup: As price re-enters or ascends the bands, we often see breakout behavior and trend expansion.
Distribution: When price extends above upper bands, potential for exit liquidity creation and distribution events.
Reversion: Historically, price mean-reverts toward the model — rarely staying outside the bands for long.
This makes the model useful for:
Cycle timing
Long-term DCA strategy zones
Identifying value dislocations
Filtering short-term noise
⚠️ Disclaimer
This tool is for educational and informational purposes only . It is not financial advice. The power law model is a non-predictive, mathematical framework and does not guarantee future price movements .
Always use additional tools, risk management, and your own judgment before making trading or investment decisions.

FEDFUNDS Rate Divergence Oscillator [BackQuant]FEDFUNDS Rate Divergence Oscillator
1. Concept and Rationale
The United States Federal Funds Rate is the anchor around which global dollar liquidity and risk-free yield expectations revolve. When the Fed hikes, borrowing costs rise, liquidity tightens and most risk assets encounter head-winds. When it cuts, liquidity expands, speculative appetite often recovers. Bitcoin, a 24-hour permissionless asset sometimes described as “digital gold with venture-capital-like convexity,” is particularly sensitive to macro-liquidity swings.
The FED Divergence Oscillator quantifies the behavioural gap between short-term monetary policy (proxied by the effective Fed Funds Rate) and Bitcoin’s own percentage price change. By converting each series into identical rate-of-change units, subtracting them, then optionally smoothing the result, the script produces a single bounded-yet-dynamic line that tells you, at a glance, whether Bitcoin is outperforming or underperforming the policy backdrop—and by how much.
2. Data Pipeline
• Fed Funds Rate – Pulled directly from the FRED database via the ticker “FRED:FEDFUNDS,” sampled at daily frequency to synchronise with crypto closes.
• Bitcoin Price – By default the script forces a daily timeframe so that both series share time alignment, although you can disable that and plot the oscillator on intraday charts if you prefer.
• User Source Flexibility – The BTC series is not hard-wired; you can select any exchange-specific symbol or even swap BTC for another crypto or risk asset whose interaction with the Fed rate you wish to study.
3. Math under the Hood
(1) Rate of Change (ROC) – Both the Fed rate and BTC close are converted to percent return over a user-chosen lookback (default 30 bars). This means a cut from 5.25 percent to 5.00 percent feeds in as –4.76 percent, while a climb from 25 000 to 30 000 USD in BTC over the same window converts to +20 percent.
(2) Divergence Construction – The script subtracts the Fed ROC from the BTC ROC. Positive values show BTC appreciating faster than policy is tightening (or falling slower than the rate is cutting); negative values show the opposite.
(3) Optional Smoothing – Macro series are noisy. Toggle “Apply Smoothing” to calm the line with your preferred moving-average flavour: SMA, EMA, DEMA, TEMA, RMA, WMA or Hull. The default EMA-25 removes day-to-day whips while keeping turning points alive.
(4) Dynamic Colour Mapping – Rather than using a single hue, the oscillator line employs a gradient where deep greens represent strong bullish divergence and dark reds flag sharp bearish divergence. This heat-map approach lets you gauge intensity without squinting at numbers.
(5) Threshold Grid – Five horizontal guides create a structured regime map:
• Lower Extreme (–50 pct) and Upper Extreme (+50 pct) identify panic capitulations and euphoria blow-offs.
• Oversold (–20 pct) and Overbought (+20 pct) act as early warning alarms.
• Zero Line demarcates neutral alignment.
4. Chart Furniture and User Interface
• Oscillator fill with a secondary DEMA-30 “shader” offers depth perception: fat ribbons often precede high-volatility macro shifts.
• Optional bar-colouring paints candles green when the oscillator is above zero and red below, handy for visual correlation.
• Background tints when the line breaches extreme zones, making macro inflection weeks pop out in the replay bar.
• Everything—line width, thresholds, colours—can be customised so the indicator blends into any template.
5. Interpretation Guide
Macro Liquidity Pulse
• When the oscillator spends weeks above +20 while the Fed is still raising rates, Bitcoin is signalling liquidity tolerance or an anticipatory pivot view. That condition often marks the embryonic phase of major bull cycles (e.g., March 2020 rebound).
• Sustained prints below –20 while the Fed is already dovish indicate risk aversion or idiosyncratic crypto stress—think exchange scandals or broad flight to safety.
Regime Transition Signals
• Bullish cross through zero after a long sub-zero stint shows Bitcoin regaining upward escape velocity versus policy.
• Bearish cross under zero during a hiking cycle tells you monetary tightening has finally started to bite.
Momentum Exhaustion and Mean-Reversion
• Touches of +50 (or –50) come rarely; they are statistically stretched events. Fade strategies either taking profits or hedging have historically enjoyed positive expectancy.
• Inside-bar candlestick patterns or lower-timeframe bearish engulfings simultaneously with an extreme overbought print make high-probability short scalp setups, especially near weekly resistance. The same logic mirrors for oversold.
Pair Trading / Relative Value
• Combine the oscillator with spreads like BTC versus Nasdaq 100. When both the FED Divergence oscillator and the BTC–NDQ relative-strength line roll south together, the cross-asset confirmation amplifies conviction in a mean-reversion short.
• Swap BTC for miners, altcoins or high-beta equities to test who is the divergence leader.
Event-Driven Tactics
• FOMC days: plot the oscillator on an hourly chart (disable ‘Force Daily TF’). Watch for micro-structural spikes that resolve in the first hour after the statement; rapid flips across zero can front-run post-FOMC swings.
• CPI and NFP prints: extremes reached into the release often mean positioning is one-sided. A reversion toward neutral in the first 24 hours is common.
6. Alerts Suite
Pre-bundled conditions let you automate workflows:
• Bullish / Bearish zero crosses – queue spot or futures entries.
• Standard OB / OS – notify for first contact with actionable zones.
• Extreme OB / OS – prime time to review hedges, take profits or build contrarian swing positions.
7. Parameter Playground
• Shorten ROC Lookback to 14 for tactical traders; lengthen to 90 for macro investors.
• Raise extreme thresholds (for example ±80) when plotting on altcoins that exhibit higher volatility than BTC.
• Try HMA smoothing for responsive yet smooth curves on intraday charts.
• Colour-blind users can easily swap bull and bear palette selections for preferred contrasts.
8. Limitations and Best Practices
• The Fed Funds series is step-wise; it only changes on meeting days. Rapid BTC oscillations in between may dominate the calculation. Keep that perspective when interpreting very high-frequency signals.
• Divergence does not equal causation. Crypto-native catalysts (ETF approvals, hack headlines) can overwhelm macro links temporarily.
• Use in conjunction with classical confirmation tools—order-flow footprints, market-profile ledges, or simple price action to avoid “pure-indicator” traps.
9. Final Thoughts
The FEDFUNDS Rate Divergence Oscillator distills an entire macro narrative monetary policy versus risk sentiment into a single colourful heartbeat. It will not magically predict every pivot, yet it excels at framing market context, spotting stretches and timing regime changes. Treat it as a strategic compass rather than a tactical sniper scope, combine it with sound risk management and multi-factor confirmation, and you will possess a robust edge anchored in the world’s most influential interest-rate benchmark.
Trade consciously, stay adaptive, and let the policy-price tension guide your roadmap.

Multiple Ema's This indicator plots five customizable Exponential Moving Averages (EMAs) directly on your chart, helping you analyze price trends and identify potential support/resistance zones more effectively.
Features:
Five EMAs with adjustable lengths: Quickly set the periods for each EMA (default: 10, 20, 50, 100, 200).
Clear, color-coded lines: Each EMA is plotted with a distinct color for easy visualization:
EMA 1 (Green)
EMA 2 (Orange)
EMA 3 (Blue)
EMA 4 (Purple)
EMA 5 (Brown)
Overlay on price chart: All curves are shown directly on your main chart for seamless trend analysis.
How to Use:
Use this indicator to:
Identify short-, medium-, and long-term trends by observing the relationships and crossovers between the EMAs.
Spot momentum shifts and potential entry/exit opportunities when price crosses above or below multiple EMAs.
Fine-tune EMA periods to your own trading strategy using the input settings.
Ideal for:
Traders and investors seeking a flexible, multi-timeframe EMA solution for stocks, forex, crypto, or any market.
Tip: Experiment with EMA lengths to match your trading style or combine with other indicators for even stronger signals!
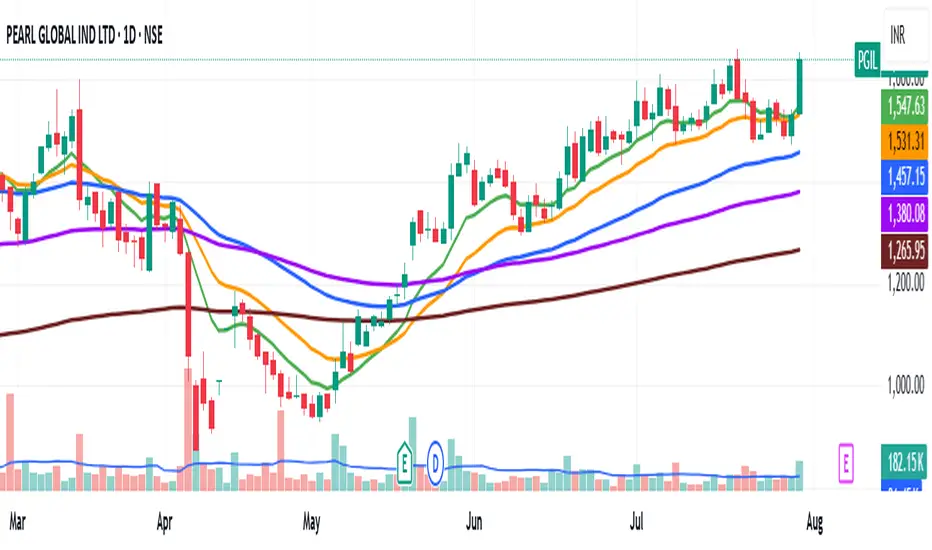
Two Poles Trend Finder MTF [BigBeluga]🔵 OVERVIEW
Two Poles Trend Finder MTF is a refined trend-following overlay that blends a two-pole Gaussian filter with a multi-timeframe dashboard. It provides a smooth view of price dynamics along with a clear summary of trend directions across multiple timeframes—perfect for traders seeking alignment between short and long-term momentum.
🔵 CONCEPTS
Two-Pole Filter: A smoothing algorithm that responds faster than traditional moving averages but avoids the noise of short-term fluctuations.
var float f = na
var float f_prev1 = na
var float f_prev2 = na
// Apply two-pole Gaussian filter
if bar_index >= 2
f := math.pow(alpha, 2) * source + 2 * (1 - alpha) * f_prev1 - math.pow(1 - alpha, 2) * f_prev2
else
f := source // Warm-up for first bars
// Shift state
f_prev2 := f_prev1
f_prev1 := f
Trend Detection Logic: Trend direction is determined by comparing the current filtered value with its value n bars ago (shifted comparison).
MTF Alignment Dashboard: Trends from 5 configurable timeframes are monitored and visualized as colored boxes:
• Green = Uptrend
• Magenta = Downtrend
Summary Arrow: An average trend score from all timeframes is used to plot an overall arrow next to the asset name.
🔵 FEATURES
Two-Pole Gaussian Filter offers ultra-smooth trend curves while maintaining responsiveness.
Multi-Timeframe Trend Detection:
• Default: 1H, 2H, 4H, 12H, 1D (fully customizable)
• Each timeframe is assessed independently using the same trend logic.
Visual Trend Dashboard positioned at the bottom-right of the chart with color-coded trend blocks.
Dynamic Summary Arrow shows overall market bias (🢁 / 🢃) based on majority of uptrends/downtrends.
Bold + wide trail plot for the filter value with gradient coloring based on directional bias.
🔵 HOW TO USE
Use the multi-timeframe dashboard to identify aligned trends across your preferred trading horizons.
Confirm trend strength or weakness by observing filter slope direction .
Look for dashboard consensus (e.g., 4 or more timeframes green] ) as confirmation for breakout, continuation, or trend reentry strategies.
Combine with volume or price structure to enhance entry timing.
🔵 CONCLUSION
Two Poles Trend Finder MTF delivers a clean and intuitive trend-following solution with built-in multi-timeframe awareness. Whether you’re trading intra-day or positioning for swing setups, this tool helps filter out market noise and keeps you focused on directional consensus.

Trend Impulse Channels (Zeiierman)█ Overview
Trend Impulse Channels (Zeiierman) is a precision-engineered trend-following system that visualizes discrete trend progression using volatility-scaled step logic. It replaces traditional slope-based tracking with clearly defined “trend steps,” capturing directional momentum only when price action decisively confirms a shift through an ATR-based trigger.
This tool is ideal for traders who prefer structured, stair-step progression over fluid curves, and value the clarity of momentum-based bands that reveal breakout conviction, pullback retests, and consolidation zones. The channel width adapts automatically to market volatility, while the step logic filters out noise and false flips.
⚪ The Structural Assumption
This indicator is built on a core market structure observation:
After each strong trend impulse, the market typically enters a “cooling-off” phase as profit-taking occurs and counter-trend participants enter. This often results in a shallow pullback or stall, creating a slight negative slope in an uptrend (or a positive slope in a downtrend).
These “cooling-off” phases don’t reverse the trend — they signal temporary pressure before the next leg continues. By tracking trend steps discretely and filtering for this behavior, Trend Impulse Channels helps traders align with the rhythm of impulse → pause → impulse.
█ How It Works
⚪ Step-Based Trend Engine
At the heart of this tool is a dynamic step engine that progresses only when price crosses a predefined ATR-scaled trigger level:
Trigger Threshold (× ATR) – Defines how far price must break beyond the current trend state to register a new trend step.
Step Size (Volatility-Guided) – Each trend continuation moves the trend line in discrete units, scaling with ATR and trend persistence.
Trend Direction State – Maintains a +1/-1 internal bias to support directional filters and step tracking.
⚪ Volatility-Adaptive Channel
Each step is wrapped inside a dynamic envelope scaled to current volatility:
Upper and Lower Bands – Derived from ATR and band multipliers to expand/contract as volatility changes.
⚪ Retest Signal System
Optional signal markers show when price re-tests the upper or lower band:
Upper Retest → Pullback into resistance during a bearish trend.
Lower Retest → Pullback into support during a bullish trend.
⚪ Trend Step Signals
Circular markers can be shown to mark each time the trend steps forward, making it easy to identify structurally significant moments of continuation within a larger trend.
█ How to Use
⚪ Trend Alignment
Use the Trend Line and Step Markers to visually confirm the direction of momentum. If multiple trend steps occur in sequence without reversal, this typically signals strong conviction and trend persistence.
⚪ Retest-Based Entries
Wait for pullbacks into the channel and monitor for triangle retest signals. When used in confluence with trend direction, these offer high-quality continuation setups.
⚪ Breakouts
Look for breakouts beyond the upper or lower band after a longer period of pause. For higher likelihood of success, look for breakouts in the direction of the trend.
█ Settings
Trigger Threshold (× ATR) - Defines how far price must move to register a new trend step. Controls sensitivity to trend flips.
Max Step Size (× ATR) - Caps how far each trend step can extend. Prevents runaway step expansion in high volatility.
Band Multiplier (× ATR) - Expands the upper and lower channels. Controls how much breathing room the bands allow.
Trend Hold (bars) - Minimum number of bars the trend must remain active before allowing a flip. Helps reduce noise.
Filter by Trend - Restrict retest signals to those aligned with the current trend direction.
-----------------
Disclaimer
The content provided in my scripts, indicators, ideas, algorithms, and systems is for educational and informational purposes only. It does not constitute financial advice, investment recommendations, or a solicitation to buy or sell any financial instruments. I will not accept liability for any loss or damage, including without limitation any loss of profit, which may arise directly or indirectly from the use of or reliance on such information.
All investments involve risk, and the past performance of a security, industry, sector, market, financial product, trading strategy, backtest, or individual's trading does not guarantee future results or returns. Investors are fully responsible for any investment decisions they make. Such decisions should be based solely on an evaluation of their financial circumstances, investment objectives, risk tolerance, and liquidity needs.

Best EMA FinderThis script, Best EMA Finder, is based on the same original logic as the Best SMA Finder I published previously. Although it was not the initial goal of the project, several users asked for an EMA version, so here it is.
The script scans a wide range of Exponential Moving Average (EMA) lengths, from 10 to 500, and identifies the one that historically delivered the most robust performance on the current chart. The choice to stop at 500 is deliberate: beyond that point, EMA curves tend to flatten and converge, adding processing time without meaningful differences in signals or outcomes.
Each EMA is evaluated using a custom robustness score:
Profit Factor × log(Number of Trades) × sqrt(Win Rate)
Only EMA lengths that exceed a user-defined minimum number of trades are considered valid. Among these, the one with the highest robustness score is selected and displayed on the chart.
A table summarizes the results:
- Best EMA length
- Total number of trades
- Profit Factor
- Win Rate
- Robustness Score
You can adjust:
- Strategy type: Long Only or Buy & Sell
- Minimum number of trades required
- Table visibility
This script is designed for analysis and optimization only. It does not execute trades or handle position sizing. Only one open trade per direction is considered at a time.
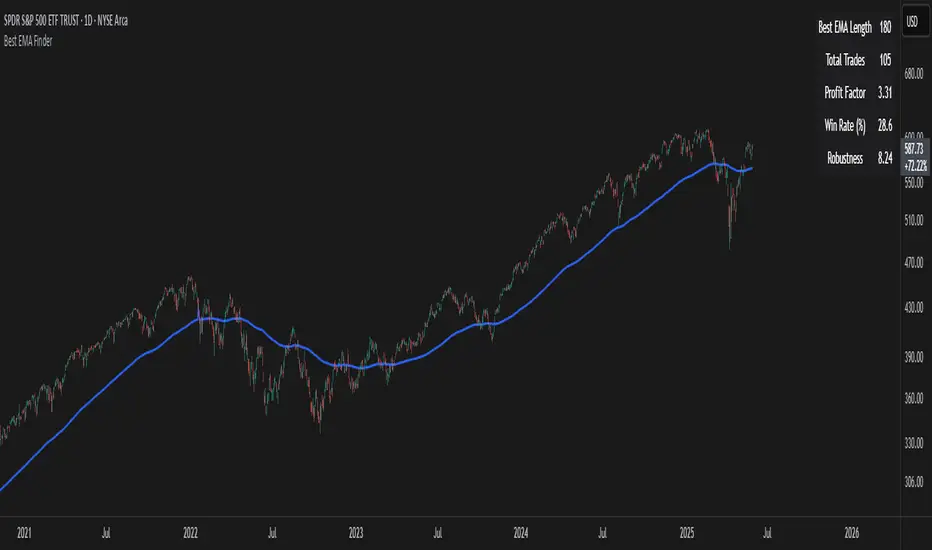
StochRSI Context EngineThe StochRSI Context Engine is a premium, logic-driven indicator built to provide comprehensive intraday momentum context using multi-timeframe Stochastic RSI analysis. Rather than issuing direct buy or sell signals, the tool is designed to give traders enhanced clarity on trend posture, overbought/oversold conditions, volatility states, and potential momentum reversals. It combines multiple layers of signal processing to deliver an intelligent overview of market conditions in real time.
What it does:
The indicator performs a multi-timeframe evaluation of the Stochastic RSI, sampling values from four customizable timeframes (default: 5m, 15m, 1h, 4h). These values are blended and processed through a series of analytical engines to provide the following:
1. StochRSI Multi-Timeframe Engine
* Computes a smoothed Stochastic RSI value on each selected timeframe.
* Applies user-defined smoothing (SMA, EMA, RMA, or WMA).
* Aggregates these into an average (sRSIavg) for further analysis.
2. Trend and Volatility Engine
* Uses EMA stacking logic (8, 21, 50) to determine directional alignment.
* Calculates linear regression slope for directional bias.
* Assesses volatility using ATR relative to price.
* Derives a trendScore based on EMA alignment, price position, and slope strength.
3. Bias and Slope Analysis
* Measures fast/slow EMA slope differentials to detect bias direction and strength.
* Computes slope deltas and volatility-weighted stacking to score bias conditions.
* Outputs a classification such as strong bullish, moderate bearish, or neutral.
4. Dynamic OB/OS Zone Detection
* Adapts overbought and oversold thresholds based on volatility and trend regime.
* Adjusts the zone boundaries if in a trending or high-volatility environment.
5. Microzone Proximity Detection
* Tracks whether the average StochRSI is approaching key OB/OS thresholds.
* Flags conditions like “Near Overbought,” “Near Oversold,” or “Mid Range.”
6. Velocity and Acceleration Detection
* Measures how quickly StochRSI values are changing.
* Uses delta calculations to gauge the momentum’s thrust or decay.
* Classifies shifts in RSI movement (e.g., flat, slow, fast, or thrusting).
7. Range Expansion / Compression Engine
* Evaluates whether StochRSI values across timeframes are diverging or compressing.
* Identifies regime changes in momentum coherence.
8. Momentum Scoring System
* Calculates a composite score based on bias, slope strength, volatility, and range.
* Labels momentum phases from dormant to full-throttle.
9. Confluence Detection
* Tallies how many of the 4 timeframes are currently overbought or oversold.
* High confluence increases the probability of valid reversal or continuation zones.
10. Support and Resistance Zone Memory
* Tracks and plots previous areas where StochRSI bounced or rejected near zones.
* Stores and updates these zones over time, acting as momentum-based S/R levels.
* Includes a proximity check to cluster zones that are close in value.
11. Divergence Detection Engine
* Detects classic bullish or bearish divergence between price and the aggregated StochRSI.
* Draws lines to show divergence structure and triggers real-time alerts.
12. Smart Background Highlighting
* Shades the background based on whether current StochRSI is in an overbought, oversold, or
neutral zone.
13. Real-Time Dashboard
* Displays trend, bias, confluence count, velocity, divergence state, momentum score, and
more.
* Dynamically updates and is optimized for top-right screen positioning with compact
formatting.
14. Smart Alerts
* Issues alerts for divergence detection and high-confluence reversal conditions.
15. Real-Time Labels on Curves
* Shows the selected timeframes alongside each plotted StochRSI line to clarify source data.
What it’s based on:
* Stochastic RSI as the core input signal, providing normalized momentum across timeframes.
* EMA stacking logic, adapted from institutional trend-following models.
* Volatility normalization using ATR to adapt thresholds in high vs. low volatility environments.
* Slope forecasting using linear regression to infer directional conviction.
* Bias analysis modeled on a composite of EMA distance, alignment, and directional thrust.
* Support/resistance zone memory derived from repeated interaction with dynamic OB/OS thresholds.
* Divergence logic based on localized price and oscillator peaks/troughs.
* Multi-factor confidence scoring, aggregating up to 6 inputs to rate market clarity.
This script is for educational and informational purposes only. It does not generate trade signals or provide financial advice. It is not intended to be used as a standalone system for trading or investment decisions. Use at your own discretion. Always confirm with your broader strategy and risk management practices.

Combo RSI + MACD + ADX MTF (Avec Alertes)✅ Recommended Title:
Multi-Signal Oscillator: ADX Trend + DI + RSI + MACD (MTF, Cross Alerts)
✅ Detailed Description
📝 Overview
This indicator combines advanced technical analysis tools to identify trend direction, capture reversals, and filter false signals.
It includes:
ADX (Multi-TimeFrame) for trend and trend strength detection.
DI+ / DI- for directional bias.
RSI + ZLSMA for oscillation analysis and divergence detection.
Zero-Lag Normalized MACD for momentum and entry timing.
⚙️ Visual Components
✅ Green/Red Background: Displays overall trend based on Multi-TimeFrame ADX.
✅ DI+ / DI- Lines: Green and red curves showing directional bias.
✅ Normalized RSI: Blue oscillator with orange ZLSMA smoothing.
✅ Zero-Lag MACD: Violet or fuchsia/orange oscillator depending on the version.
✅ Crossover Points: Colored circles marking buy and sell signals.
✅ ADX Strength Dots: Small black dots when ADX exceeds the strength threshold.
🚨 Included Alert System
✅ RSI / ZLSMA Crossovers (Buy / Sell).
✅ MACD / Signal Line Crossovers (Buy / Sell).
✅ DI+ / DI- Crossovers (Buy / Sell).
✅ Double Confirmation DI+ / RSI or DI+ / MACD.
✅ Double Confirmation DI- / RSI or DI- / MACD.
✅ Trend Change Alerts via Background Color.
✅ ADX Strength Alerts (Above Threshold).
🛠️ Suggested Configuration Examples
1. Short-Term Reversal Detection:
RSI Length: 7 to 14
ZLSMA Length: 7 to 14
MACD Fast/Slow: 5 / 13
ADX MTF Period: 5 to 15
ADX Threshold: 15 to 20
2. Long-Term Trend Following:
RSI Length: 21 to 30
ZLSMA Length: 21 to 30
MACD Fast/Slow: 12 / 26
ADX MTF Period: 30 to 50
ADX Threshold: 20 to 25
3. Scalping / Day Trading:
RSI Length: 5 to 9
ZLSMA Length: 5 to 9
MACD Fast/Slow: 3 / 7
ADX MTF Period: 5 to 10
ADX Threshold: 10 to 15
🎯 Why Use This Tool?
Filters false signals using ADX-based background coloring.
Provides multi-source alerting (RSI, MACD, ADX).
Helps identify true market strength zones.
Works on all markets: Forex, Crypto, Stocks, Indices.

MTF Stochastic RSIOverview: MTF Stochastic RSI
is a momentum-tracking tool that plots the Stochastic RSI oscillator for up to four user-
defined timeframes on a single panel. It provides a compact yet powerful view of how
momentum is aligning or diverging across different timeframes, making it suitable for both
scalpers and swing traders looking for multi-timeframe confirmation.
What it does:
Calculates Stochastic RSI values using the RSI of price as the base input and applies
smoothing for stability.
Aggregates and displays the values for four customizable TF (e.g., 5min, 15min, 1h, 4h).
Highlights potential support and resistance zones in the oscillator space using adaptive zone
logic.
Optionally draws dynamic support/resistance zone lines in the oscillator space based on
historical turning points.
How it works:
Each timeframe uses the same RSI and Stoch calculation settings but runs independently via
the request.security() function.
Stochastic RSI is calculated by first applying the RSI to price, then applying a stochastic
formula on the RSI values, and finally smoothing the %K output.
Adaptive overbought and oversold thresholds adjust based on ATR-based volatility and simple
trend filtering (e.g., price vs EMA).
When a crossover above the oversold zone or a crossunder below the overbought zone
occurs, the script checks for proximity to previously stored zones and either adjusts or
records a new one.
These zones are stored and re-plotted as dotted support/resistance levels within the
oscillator space.
What it’s based on:
The indicator builds upon traditional Stochastic RSI by applying it to multiple timeframes in
parallel.
Zone detection logic is inspired by the idea of oscillator-based support/resistance levels.
Volatility-adjusted thresholds are based on ATR (Average True Range) to make the
overbought/oversold zones responsive to market conditions.
How to use it:
Look for alignment across timeframes (e.g., all four curves pushing into the overbought
region suggests strong trend continuation).
Reversal risk increases when one or more higher timeframes are diverging or showing signs of
cooling while lower timeframes are still extended.
Use the zone lines as soft support/resistance references within the oscillator—retests of
these zones can indicate strong reversal opportunities or continuation confirmation.
This script is provided for educational and informational purposes only. It does not constitute financial advice, trading recommendations, or an offer to buy or sell any financial instrument. Always perform your own due diligence, use proper risk management, and consult a qualified financial professional before making any trading decisions. Past performance does not guarantee future results. Use this tool at your own discretion and risk.

Pmax + T3Pmax + T3 is a versatile hybrid trend-momentum indicator that overlays two complementary systems on your price chart:
1. Pmax (EMA & ATR “Risk” Zones)
Calculates two exponential moving averages (Fast EMA & Slow EMA) and plots them to gauge trend direction.
Highlights “risk zones” behind price as a colored background:
Green when Fast EMA > Slow EMA (up-trend)
Red when Fast EMA < Slow EMA (down-trend)
Yellow when EMAs are close (“flat” zone), helping you avoid choppy markets.
You can toggle risk-zone highlighting on/off, plus choose to ignore signals in the yellow (neutral) zone.
2. T3 (Triple-Smoothed EMA Momentum)
Applies three sequential EMA smoothing (the classic “T3” algorithm) to your chosen source (usually close).
Fills the area between successive T3 curves with up/down colors for a clear visual of momentum shifts.
Optional neon-glow styling (outer, mid, inner glows) in customizable widths and transparencies for a striking “cyber” look.
You can highlight T3 movements only when the line is rising (green) or falling (red), or disable movement coloring.

HEMA Trend Levels [AlgoAlpha]OVERVIEW
This script plots two Hull-EMA (HEMA) curves to define a color-coded dynamic trend zone and generate context-aware breakout levels, allowing traders to easily visualize prevailing momentum and identify high-probability breakout retests. The script blends smoothed price tracking with conditional box plotting, delivering both trend-following and mean-reversion signals within one system. It is designed to be simple to read visually while offering nuanced trend shifts and test confirmations.
█ CONCEPTS
The Hull-EMA (HEMA) is a hybrid moving average combining the responsiveness of short EMAs with the smoothness of longer ones. It applies layered smoothing: first by subtracting a full EMA from a half-length EMA (doubling the short EMA's weight), and then by smoothing the result again with the square root of the original length. This process reduces lag while maintaining clarity in direction changes. In this script, two HEMAs—fast and slow—are used to define the trend structure and trigger events when they cross. These crossovers generate "trend shift boxes"—temporary support or resistance zones drawn immediately after trend transitions—to detect price retests in the new direction. When price cleanly retests these levels, the script marks them as confirmations with triangle symbols, helping traders isolate better continuation setups. Color-coded bars further enhance visual interpretation: bullish bars when price is above both HEMAs, bearish when below, and neutral (gray) when indecisive.
█ FEATURES
Bullish and bearish bar coloring based on price and HEMA alignment.
Box plotting at each crossover (bullish or bearish) to create short-term decision zones.
Real-time test detection: price must cleanly test and bounce from box levels to be considered valid.
Multiple alert conditions: crossover alerts, test alerts, and trend continuation alerts.
█ USAGE
Use this indicator on any time frame and asset. Adjust HEMA lengths to match your trading style—shorter lengths for scalping or intraday, longer for swing trading. The shaded area between HEMAs helps visually define the current trend. Watch for crossovers: a bullish crossover plots a green support box just below price, and a bearish one plots a red resistance box just above. These zones act as short-term decision points. When price returns to test a box and confirms with strong rejection (e.g., closes above for bullish or below for bearish), a triangle symbol is plotted. These tests can signal strong trend continuation. For traders looking for clean entries, combining the crossover with a successful retest improves reliability. Alerts can be enabled for all key signals: trend shift, test confirmations, and continuation conditions, making it suitable for automated setups or discretionary traders tracking multiple charts.

[MAD] Self-Optimizing RSIOverview
This script evaluates multiple RSI lengths within a specified range, calculates performance metrics for each, and identifies the top 3 configurations based on a custom scoring system. It then plots the three best RSI curves and optionally displays a summary table and label.
How It Works
The script calculates a custom RSI for each length in the range.
It simulates entering a long position when RSI crosses below the Buy Value and exits when RSI crosses above the Sell Value.
Each trade's return is stored in the relevant StatsContainer.
Metrics Computation
After all bars have been processed,
* Net Profit,
* Sharpe Ratio, and
* Win Rate
are computed for each RSI length.
A weighted score is then derived using the input weights.
Top 3 Identification
The script finds the three RSI lengths with the highest scores.
The RSI lines for these top 3 lengths are plotted in different colors.
If enabled, a table listing the top 3 results (Rank, RSI length, Sharpe, NetPnL, Win Rate) is shown.
If enabled, a label with the highest-scoring RSI length and its score is placed on the final bar.
Usage Tips
Adjust Min RSI Length and Max RSI Length to explore a narrower or wider range of periods.
Be aware, to high settings will slow down the calculation.
Experiment with different RSI Buy Value and RSI Sell Value settings if you prefer more or fewer trade signals.
Confirm that Min Trades Required aligns with the desired confidence level for the computed metrics.
Modify Weight: Sharpe, Weight: NetProfit, and Weight: WinRate to reflect which metrics are most important.
Troubleshooting
If metrics remain - or NaN, confirm enough trades (Min Trades Required) have occurred.
If no top 3 lines appear, it could mean no valid trades were taken in the specified range, or the script lacks sufficient bars to calculate RSI for some lengths. In this case set better buyvalue and sellvalues in the inputs
Disclaimer
Past performance is not indicative of future results specialy as this indicator can repaint based on max candles in memory which are limited by your subscription