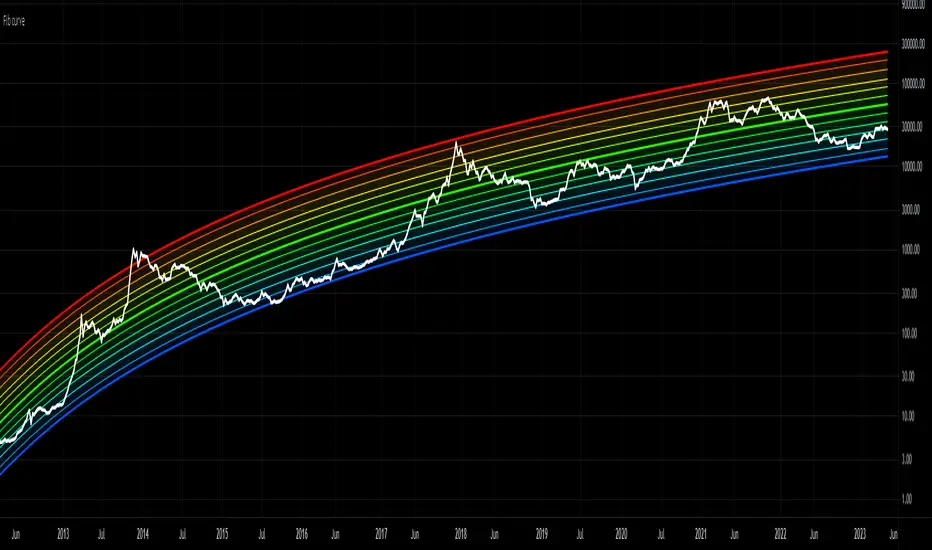
Bitcoin Logarithmic Growth Curve 2024The Bitcoin logarithmic growth curve is a concept used to analyze Bitcoin's price movements over time. The idea is based on the observation that Bitcoin's price tends to grow exponentially, particularly during bull markets. It attempts to give a long-term perspective on the Bitcoin price movements.
The curve includes an upper and lower band. These bands often represent zones where Bitcoin's price is overextended (upper band) or undervalued (lower band) relative to its historical growth trajectory. When the price touches or exceeds the upper band, it may indicate a speculative bubble, while prices near the lower band may suggest a buying opportunity.
Unlike most Bitcoin growth curve indicators, this one includes a logarithmic growth curve optimized using the latest 2024 price data, making it, in our view, superior to previous models. Additionally, it features statistical confidence intervals derived from linear regression, compatible across all timeframes, and extrapolates the data far into the future. Finally, this model allows users the flexibility to manually adjust the function parameters to suit their preferences.
The Bitcoin logarithmic growth curve has the following function:
y = 10^(a * log10(x) - b)
In the context of this formula, the y value represents the Bitcoin price, while the x value corresponds to the time, specifically indicated by the weekly bar number on the chart.
How is it made (You can skip this section if you’re not a fan of math):
To optimize the fit of this function and determine the optimal values of a and b, the previous weekly cycle peak values were analyzed. The corresponding x and y values were recorded as follows:
113, 18.55
240, 1004.42
451, 19128.27
655, 65502.47
The same process was applied to the bear market low values:
103, 2.48
267, 211.03
471, 3192.87
676, 16255.15
Next, these values were converted to their linear form by applying the base-10 logarithm. This transformation allows the function to be expressed in a linear state: y = a * x − b. This step is essential for enabling linear regression on these values.
For the cycle peak (x,y) values:
2.053, 1.268
2.380, 3.002
2.654, 4.282
2.816, 4.816
And for the bear market low (x,y) values:
2.013, 0.394
2.427, 2.324
2.673, 3.504
2.830, 4.211
Next, linear regression was performed on both these datasets. (Numerous tools are available online for linear regression calculations, making manual computations unnecessary).
Linear regression is a method used to find a straight line that best represents the relationship between two variables. It looks at how changes in one variable affect another and tries to predict values based on that relationship.
The goal is to minimize the differences between the actual data points and the points predicted by the line. Essentially, it aims to optimize for the highest R-Square value.
Below are the results:
It is important to note that both the slope (a-value) and the y-intercept (b-value) have associated standard errors. These standard errors can be used to calculate confidence intervals by multiplying them by the t-values (two degrees of freedom) from the linear regression.
These t-values can be found in a t-distribution table. For the top cycle confidence intervals, we used t10% (0.133), t25% (0.323), and t33% (0.414). For the bottom cycle confidence intervals, the t-values used were t10% (0.133), t25% (0.323), t33% (0.414), t50% (0.765), and t67% (1.063).
The final bull cycle function is:
y = 10^(4.058 ± 0.133 * log10(x) – 6.44 ± 0.324)
The final bear cycle function is:
y = 10^(4.684 ± 0.025 * log10(x) – -9.034 ± 0.063)
The main Criticisms of growth curve models:
The Bitcoin logarithmic growth curve model faces several general criticisms that we’d like to highlight briefly. The most significant, in our view, is its heavy reliance on past price data, which may not accurately forecast future trends. For instance, previous growth curve models from 2020 on TradingView were overly optimistic in predicting the last cycle’s peak.
This is why we aimed to present our process for deriving the final functions in a transparent, step-by-step scientific manner, including statistical confidence intervals. It's important to note that the bull cycle function is less reliable than the bear cycle function, as the top band is significantly wider than the bottom band.
Even so, we still believe that the Bitcoin logarithmic growth curve presented in this script is overly optimistic since it goes parly against the concept of diminishing returns which we discussed in this post:
This is why we also propose alternative parameter settings that align more closely with the theory of diminishing returns.
Our recommendations:
Drawing on the concept of diminishing returns, we propose alternative settings for this model that we believe provide a more realistic forecast aligned with this theory. The adjusted parameters apply only to the top band: a-value: 3.637 ± 0.2343 and b-parameter: -5.369 ± 0.6264. However, please note that these values are highly subjective, and you should be aware of the model's limitations.
Conservative bull cycle model:
y = 10^(3.637 ± 0.2343 * log10(x) - 5.369 ± 0.6264)
在腳本中搜尋"curve"

[2024] Inverted Yield CurveInverted Yield Curve Indicator
Overview:
The Inverted Yield Curve Indicator is a powerful tool designed to monitor and analyze the yield spread between the 10-year and 2-year US Treasury rates. This indicator helps traders and investors identify periods of yield curve inversion, which historically have been reliable predictors of economic recessions.
Key Features:
Yield Spread Calculation: Accurately calculates the spread between the 10-year and 2-year Treasury yields.
Visual Representation: Plots the yield spread on the chart, with clear visualization of positive and negative spreads.
Inversion Highlighting: Background shading highlights periods where the yield curve is inverted (negative spread), making it easy to spot critical economic signals.
Alerts: Customizable alerts notify users when the yield curve inverts, allowing timely decision-making.
Customizable Yield Plots: Users can choose to display the individual 2-year and 10-year yields for detailed analysis.
How It Works:
Data Sources: Utilizes the Federal Reserve Economic Data (FRED) for fetching the 2-year and 10-year Treasury yield rates.
Spread Calculation: The script calculates the difference between the 10-year and 2-year yields.
Visualization: The spread is plotted as a blue line, with a grey zero line for reference. When the spread turns negative, the background turns red to indicate an inversion.
Customizable Plots: Users can enable or disable the display of individual 2-year and 10-year yields through simple input options.
Usage:
Economic Analysis: Use this indicator to anticipate potential economic downturns by monitoring yield curve inversions.
Market Timing: Identify periods of economic uncertainty and adjust your investment strategies accordingly.
Alert System: Set alerts to receive notifications whenever the yield curve inverts, ensuring you never miss crucial economic signals.
Important Notes:
Data Accuracy: Ensure that the FRED data symbols (FRED
and FRED
) are correctly referenced and available in your TradingView environment.
Customizations: The script is designed to be flexible, allowing users to customize plot colors and alert settings to fit their preferences.
Disclaimer:
This indicator is intended for educational and informational purposes only. It should not be considered as financial advice. Always conduct your own research and consult with a financial advisor before making investment decisions.

Bitcoin Logarithmic Curves OscillatorThis a companion indicator for the Bitcoin Logarithmic Growth Curves indicator.
This is an oscillator version of the above. When the indicator is at / near 1 then Bitcoin price is at / near the upper range of its long-term logarithmic growth trend. When at / near 0 then price is at / near the lower range of that trend.
This indicator only works with the BLX Brave New Coin Index (ticker:BLX) and only on 1 day, 3 day, or 1 week timeframes.

Macro Stress Monitor (USDJPY + JGB + Yield Curve)
# **Note‑Style Description**
This indicator provides a consolidated framework for monitoring two of the most systemically important channels of global USD liquidity transmission: **offshore USD funding conditions in Japan** and **front‑end U.S. rates stress linked to repo and collateral dynamics**. While TradingView does not supply direct access to cross‑currency basis swaps or repo benchmarks, the script employs market‑validated proxies that closely track the same underlying pressures observed in dealer balance‑sheet constraints, FX‑hedged flows, and Treasury funding markets.
### **1. USD/JPY Funding Pressure (Basis‑Swap Proxy)**
The USD/JPY cross‑currency basis is a primary indicator of offshore USD funding premia for Japanese banks, insurers, and real‑money accounts. Basis widening typically reflects elevated USD demand, reduced hedge ratios, and impaired FX swap market liquidity.
To approximate this behavior in real time, the indicator combines:
- **USDJPY spot**, which tends to accelerate higher during USD funding stress, FX swap dislocations, or shifts in BOJ/Fed policy differentials.
- **JP10Y (Japan 10‑year yield)**, which captures JGB‑market stress, duration‑hedging flows, and the impact of FX‑hedged UST carry dynamics on domestic rates.
The joint behavior of these two series provides a high‑signal proxy for USD/JPY basis conditions, particularly around quarter‑end, fiscal year‑end, and BOJ policy events.
### **2. U.S. Front‑End Curve Stress (Repo/Collateral Proxy)**
Stress in the U.S. repo market often manifests first in the front end of the Treasury curve, where funding volatility, collateral scarcity, and dealer balance‑sheet compression drive rapid curve distortions.
The indicator tracks:
- **US02Y – US10Y (2s10s spread)** as a public‑market proxy for repo tightness, GC specialness, and leveraged Treasury basis‑trade unwind risk.
A deeper inversion or accelerated flattening of the 2s10s curve frequently coincides with rising funding premia, increased margin requirements, and deleveraging across rates‑sensitive strategies.
### **3. Stress Diagnostics**
The script highlights three conditions that historically align with elevated cross‑asset fragility:
- **USDJPY > 20‑day SMA** — proxy for USD funding stress / basis widening
- **JP10Y < 20‑day SMA** — proxy for JGB‑market stress or hedging‑related duration flows
- **2s10s < –0.50** — proxy for front‑end funding pressure and repo‑related curve distortions
These are not directional trading signals. They are **liquidity‑risk diagnostics** intended to identify periods when global funding markets become more vulnerable to synchronized deleveraging.
### **4. Intended Use Case**
This tool is designed for macro practitioners, cross‑asset strategists, and risk managers who monitor:
- USD funding premia and cross‑currency basis dynamics
- FX‑hedged UST flows and Japanese institutional positioning
- Treasury basis‑trade leverage and repo‑driven volatility
- BOJ/Fed policy interactions and quarter‑end balance‑sheet effects
- Systemic liquidity conditions across FX, rates, and credit
The indicator provides a real‑time dashboard for identifying early‑stage liquidity stress that may precede broader cross‑asset volatility.

Bitcoin Log Growth Curve OscillatorThis script presents the oscillator version of the Bitcoin Logarithmic Growth Curve 2024 indicator, offering a new perspective on Bitcoin’s long-term price trajectory.
By transforming the original logarithmic growth curve into an oscillator, this version provides a normalized view of price movements within a fixed range, making it easier to identify overbought and oversold conditions.
For a comprehensive explanation of the mathematical derivation, underlying concepts, and overall development of the Bitcoin Logarithmic Growth Curve, we encourage you to explore our primary script, Bitcoin Logarithmic Growth Curve 2024, available here . This foundational script details the regression-based approach used to model Bitcoin’s long-term price evolution.
Normalization Process
The core principle behind this oscillator lies in the normalization of Bitcoin’s price relative to the upper and lower regression boundaries. By applying Min-Max Normalization, we effectively scale the price into a bounded range, facilitating clearer trend analysis. The normalization follows the formula:
normalized price = (upper regresionline − lower regressionline) / (price − lower regressionline)
This transformation ensures that price movements are always mapped within a fixed range, preventing distortions caused by Bitcoin’s exponential long-term growth. Furthermore, this normalization technique has been applied to each of the confidence interval lines, allowing for a structured and systematic approach to analyzing Bitcoin’s historical and projected price behavior.
By representing the logarithmic growth curve in oscillator form, this indicator helps traders and analysts more effectively gauge Bitcoin’s position within its long-term growth trajectory while identifying potential opportunities based on historical price tendencies.

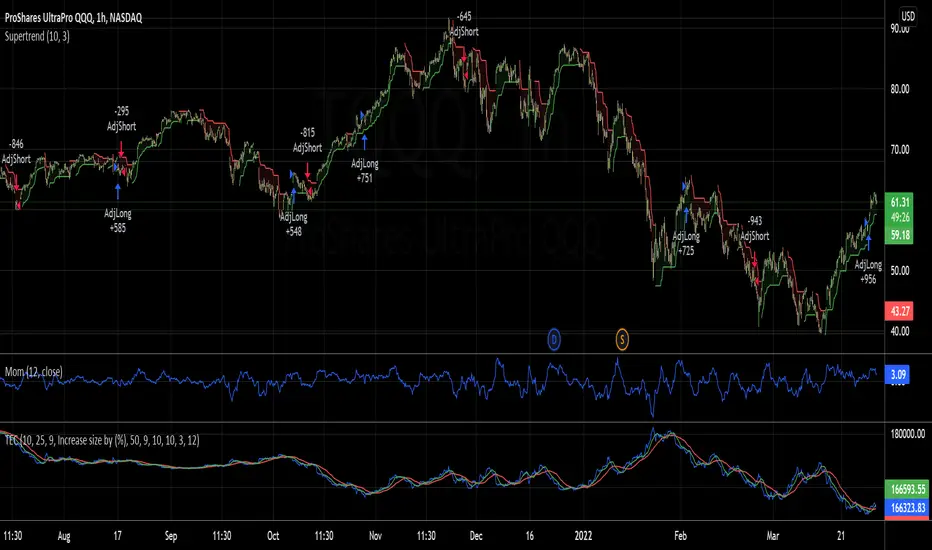
Trading the Equity Curve Position Sizing Example"Trading the equity curve" as a risk management method is the process of acting on trade signals depending on whether a system’s performance is indicating the strategy is in a profitable or losing phase.
The point of managing equity curve is to minimize risk in trading when the equity curve is in a downtrend. This strategy has two modes to determine the equity curve downtrend: By creating two simple moving averages of a portfolio's equity curve - a short-term and a longer-term one - and acting on their crossings. If the fast SMA is below the slow SMA, equity downtrend is detected (smafastequity < smaslowequity).
The second method is by using the crossings of equity itself with the longer-period SMA (equity < smasloweequity).
When Trading with the Equity Curve" is active, the position size will be reduced by a specified percentage if the equity is "under water" according to a selected rule. If you're a risk seeker, select "Increase size by %" - for some robust systems, it could help overcome their small drawdowns quicker.
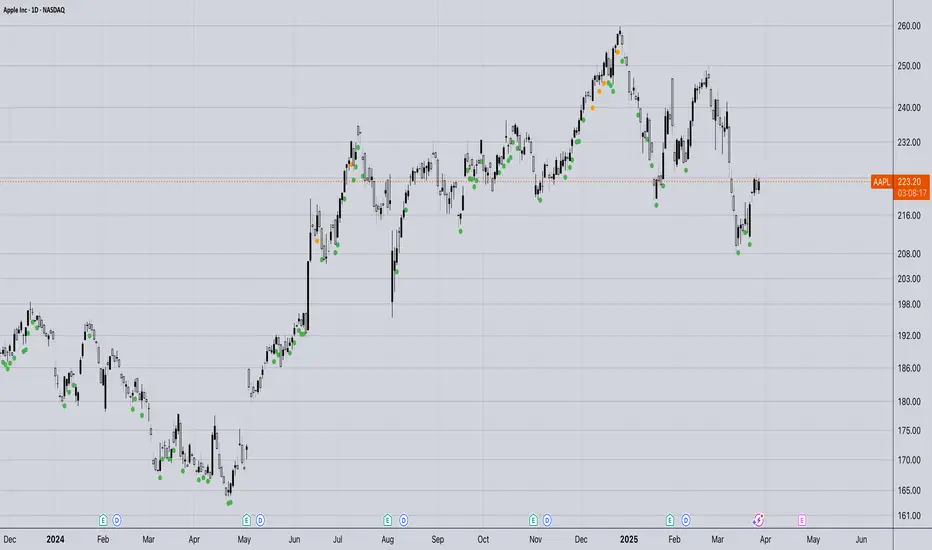
Coppock Curve with Pivot Points and Divergence The Coppock Curve is a long-term price momentum indicator used primarily to recognize major downturns and upturns in a stock market index. It is calculated as a 10-month weighted moving average of the sum of the 14-month rate of change and the 11-month rate of change for the index. It is also known as the "Coppock Guide."
The Coppock formula was introduced in Barron's in 1962 by Edwin Coppock.
The Coppock Curve is a technical indicator that provides long-term buy and sell signals for major stock indexes and related ETFs based on shifts in momentum.
What Does the Coppock Curve Tell You?
The Coppock Curve was originally implemented as a long-term buy and sell indicator for major indices such as the S&P 500 and the Wilshire 5000. Often, it is used with long-term time series such as a candlestick chart, but where each candle contains a month's worth of price information.
The Difference Between the Coppock Curve and Rate of Relative Strength Index (RSI)?
The relative strength index looks at how the current price compares to prior prices, though it is calculated differently than the rate of change (ROC) indicator used in the Coppock Curve calculation. Therefore, these indicators will provide different trade signals and information.
What are those circles?
-These are Divergences. Red for Regular-Bearish. Orange for Hidden-Bearish. Green for Regular-Bullish. Aqua for Hidden-Bullish.
What are those triangles?
- These are Pivots . They show when the VPT oscillator might reverse, this is important to know because many times the price action follows this move.
Please keep in mind that this indicator is a tool and not a strategy, do not blindly trade signals, do your own research first! Use this indicator in conjunction with other indicators to get multiple confirmations.

RSI (w/ Curve and Volatility)This is a centered triple oscillator which measures RSI, RVI (volatility), and Coppock Curve (trend). This is centered so it ranges from negative 50 to positive 50. This indicator is used most accurately when all 3 indicators show above/below 0.
RSI is the bright pink line. RSI determines strength in a direction. When it is above 20 or below -20, a pullback is likely - this could be a prime time to scale out of position. Remember do not enter a trade just because it is oversold, as the strength is still greatly against you.
RVI is the thin lighter line. RVI was created by Donald Dorsey to use in conjunction with other indicators. The instructions for using RVI is to sell/short when below -10 and buy/cover when above 10. Use this indicator to confirm your bias.
The purple area is the Coppock curve . This curve is used to analyze longer term trends in a chart. RSI and RVI struggle to indicate long term trends, use the Coppock curve to confirm your bias. The curve is bullish when above 0 and bearish when below 0. Be cautious when trying to buy or sell it early when its falling. If it is falling and pops back up without reaching 0, it is typically indicate of a big price movement in that direction.

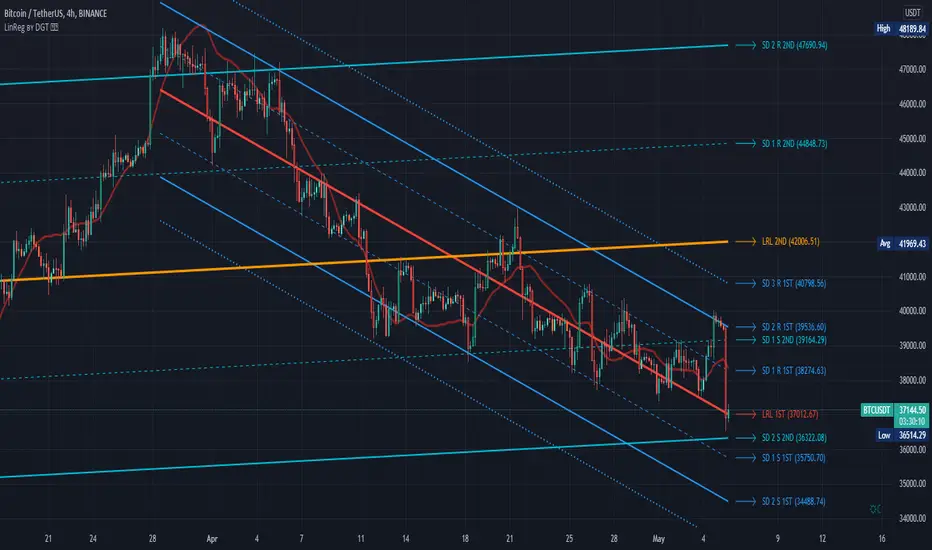
Linear Regression Channel / Curve / Slope by DGTTʜᴇ Lɪɴᴇᴀʀ Rᴇɢʀᴇꜱꜱɪᴏɴ Cʜᴀɴɴᴇʟꜱ
Linear Regression Channels are useful measure for technical and quantitative analysis in financial markets that help identifying trends and trend direction. The use of standard deviation gives traders ideas as to when prices are becoming overbought or oversold relative to the long term trend
The basis of a linear regression channel
Linear Regression Line – is a line drawn according to the least-squares statistical technique which produces a best-fit line that cuts through the middle of price action, a line that best fits all the data points of interest. The resulting fitted model can be used to summarize the data, to predict unobserved values from the same system. Linear Regression Line then present basis for the channel calculations
The linear regression channel
2. Upper Channel Line – A line that runs parallel to the Linear Regression Line and is usually one to two standard deviations above the Linear Regression Line.
3. Lower Channel Line – This line runs parallel to the Linear Regression Line and is usually one to two standard deviations below the Linear Regression Line.
Unlike Fibonacci Channels and Andrew’s Pitchfork, Linear Regression Channels are calculated using statistical methods, both for the regression line (as expressed above) and deviation channels. Upper and Lower channel lines are presenting the idea of bell curve method, also known as a normal distribution and are calculated using standard deviation function.
A standard deviation include 68% of the data points, two standard deviations include approximately 95% of the data points and any data point that appears outside two standard deviations is very rare.
It is often assumed that the data points will move back toward the average, or regress and channels would allow us to see when a security is overbought or oversold and ready to revert to the mean
please note : Over time, the price will move up and down, and the linear regression channel will experience changes as old prices fall off and new prices appear
█ Linear Regression Study Features
Linear Regression Channel
- Linear regression line as basis
- Customizable multiple channels based on Standard Deviation
- ALERTs for the channel levels
Linear Regression Curve
- Linear regression curve as basis
- Optional : Bands based on Standard Deviation or Volatility (ATR). Bands are applied with fixed levels 1, 2 and 3 times StdDev or ATR away from the curve
Linear Regression Slope
- Optional : Up/Down slope arrows for a used defined period
█ Volume / Volatility Add-Ons
High Volatile Bar Indication
Volume Spike Bar Indication
Volume Weighted Colored Bars
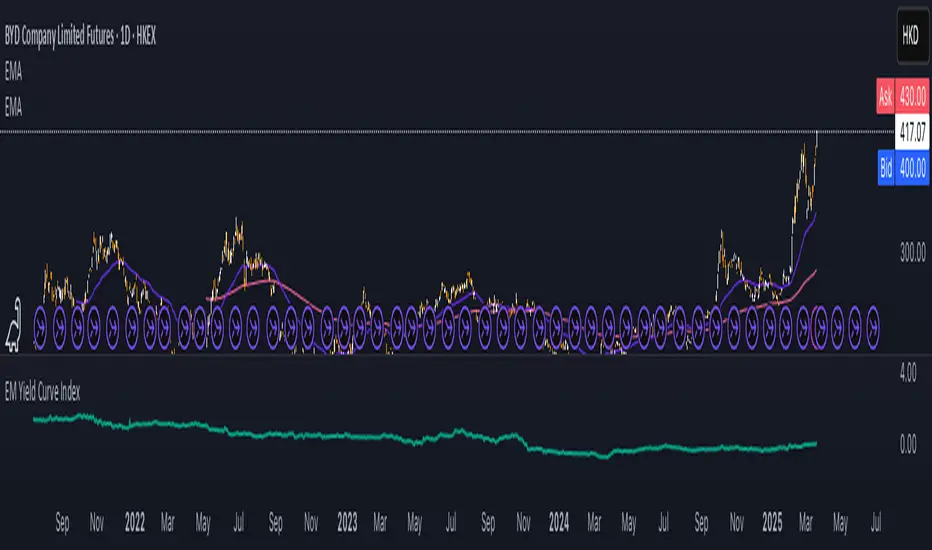
EM Yield Curve IndexThis script calculates the Emerging Markets (EM) Yield Curve Index by aggregating the 2-year and 10-year bond yields of major emerging economies. The bond yields are weighted based on each country's bond market size, with data sourced from TradingView. The yield curve is derived by subtracting the 2-year yield from the 10-year yield, providing insights into economic conditions, risk sentiment, and potential recessions in emerging markets. The resulting EM Yield Curve Index is plotted for visualization.
Note: In some cases, TradingView's TVC data did not provide a 2-year bond yield. When this occurred, the best available alternative yield (such as 3-month, 1-year or 4-year yields) was used to approximate the short-term interest rate for that country.
Forward Curve Visualization ToolProvide the spot symbol and the futures product root, and the script automatically scans all relevant contracts for you—no more tedious manual searches. The result is a clean, intuitive chart showing the live forward curve in real time.
It also detects contango or backwardation conditions (based on spot < F1 < F2 < F3).
Future Features:
Plot historical snapshots of the curve (1 day, 1 week, or 1 month ago) to understand market trends over time.
Display additional metrics such as annualized basis, cost of carry (CoC), and even volume or open interest for deeper insights.
If you trade futures and watch the forward curve, this script will give you the actionable data you need and get more ideas or features you’d like to see. Let’s build them together!
Disclaimer
Please remember that past performance may not be indicative of future results.
Due to various factors, including changing market conditions, the strategy may no longer perform as well as in historical backtesting.
This post and the script don’t provide any financial advice.

Bitcoin Rainbow Logarithmic CurvesThis indicator shows the logarithmic regression curves for BTC and color codes it based on how extended we are from the best fit line (middle).
Yield CurveThis script tracks the U.S. 2Yr/10Yr Spread and uses inversions of the curve to predict recessions. Whenever a red arrow appear on the yield curve, expect a recession to begin within the next 2 years. Use this signal to either exit the market, or hedge current positions. Whenever a green arrow appears on the yield curve, expect a recession to have nearly ended. Use this signal to enter the market, or cut current hedges against a recession. (I may update this script in the future to better incorporate the effective federal funds rate into exit points, but for now I am satisfied with the results).

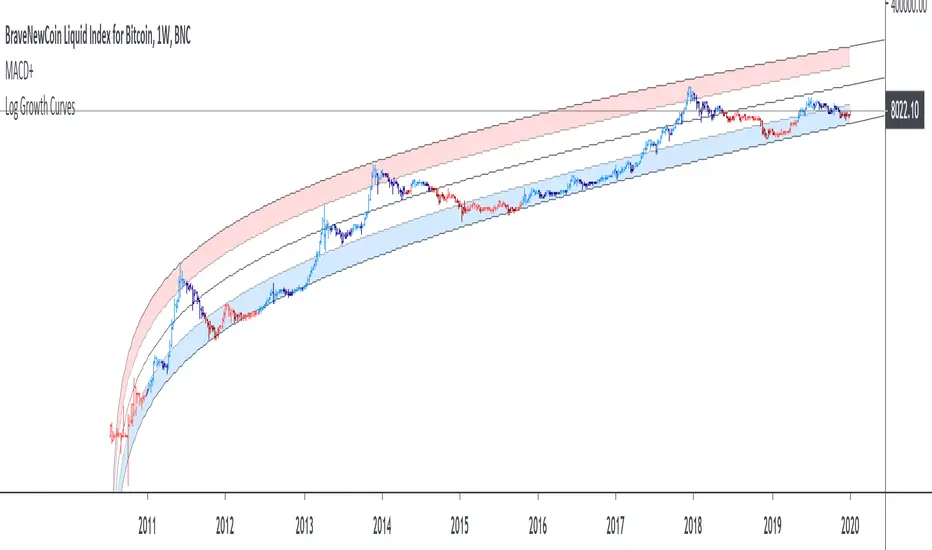
Bitcoin Logarithmic Growth Curves & ZonesI found this awesome script from @quantadelic and edited it to be a bit more legible for regular use, including coloured zones and removing the intercept / slope values as variables, to leave space for the fib levels in the indicator display. I hope you all like it.

Bitcoin Logarithmic Growth CurvesThis is a version of the Log Growth Curves previously published by Quantadelic. The update includes customizable fib levels and filled upper and lower bands. This script is only intended for the Bitcoin log chart to reflect the channel that can be found on a log/log Bitcoin chart. The projections out from current levels are theoretical path of BTC based on the current trajectory.
In theory, reaching into the bottom zone of this chart is a good zone for accumulation while the top zone is a good are for distribution.
Ranked Parabolic Curve Detector (Adaptive + Reversion Aware)The Parabolic Curve Detector is a smart, adaptable trading signal engine designed to help you spot true momentum — not the flashy head-fakes, but sustained, accelerating moves that have the potential to go parabolic. Whether you’re new to trading or looking to sharpen your edge, this tool combines a suite of time-tested and modern techniques into one unified signal, all while adjusting to changing market conditions.
The core idea is simple: detect when price is not just rising, but accelerating, like a curve bending upward. To do that, the script analyzes the log of price and calculates both:
Slope1: how fast the price is moving (momentum)
Slope2: how fast that momentum is changing (acceleration)
Over a user-defined number of bars (which amounts to sensitivity ), the script checks for consistency. So, for example, if both slope1 and slope2 have been positive for 4 bars, that’s a strong signal.
But it doesn’t stop there.
The key is weighted Intelligence
What makes this tool uniquely customizable is that each layer of signal logic is weighted:
Slope1 and Slope2: You can assign how much these matter (e.g., 60% for slope1, 20% for slope2)
Ichimoku Trend Filter: A bullish setup (Tenkan > Kijun) can contribute to the total score
RSI Context: The indicator checks for overextension (RSI > 70 and falling) and mean-reversion potential (RSI < 45 and rising), adjusting scores accordingly
You can fine-tune these weights to match your trading style — whether you prefer to catch early momentum, ride mature trends, or fade reversals.
Finally, there is adaptive Intelligence . This isn’t a static signal. The indicator auto-adjusts its strictness using:
Slope Flip Rate: If price changes direction frequently, the required bar count increases
Volatility (ATR): In volatile markets, the threshold for signal confirmation tightens to avoid noise
You can turn this adaptive behavior on or off. When enabled, it makes the script self-tuning across timeframes — more reactive on clean moves, more skeptical in chop.
How to Use It
Start on a log-scaled daily chart
Enable the indicator and optionally turn on Adaptive Sensitivity
Look for:
Green Circles = bullish signal with favorable RSI + trend
Orange Circles = still bullish, but possibly overextended
For bearish setups, enable Parabolic Drops in settings
I am still experimenting with it, so if you find a better way to use it, let us know!
My suggested tweaks :
sensitivity: 3–5 for normal, higher for stricter
signalThreshold: 0.7–0.85 depending on how picky you want to be
Weights for slope1/slope2/trend
RSI boost/penalty levels
US Yield Curve ComparisonIn finance, the yield curve is a graph which depicts how the yields on debt instruments – such as bonds – vary as a function of their years remaining to maturity. The graph's horizontal or x-axis is a time line of months and years remaining to maturity, with the shortest maturity on the left and progressively longer time periods on the right. The vertical or y-axis depicts the annualized yield to maturity.
To see changes of a definded timeframe, use this indicator to compare the current US yield curve with one in the past.

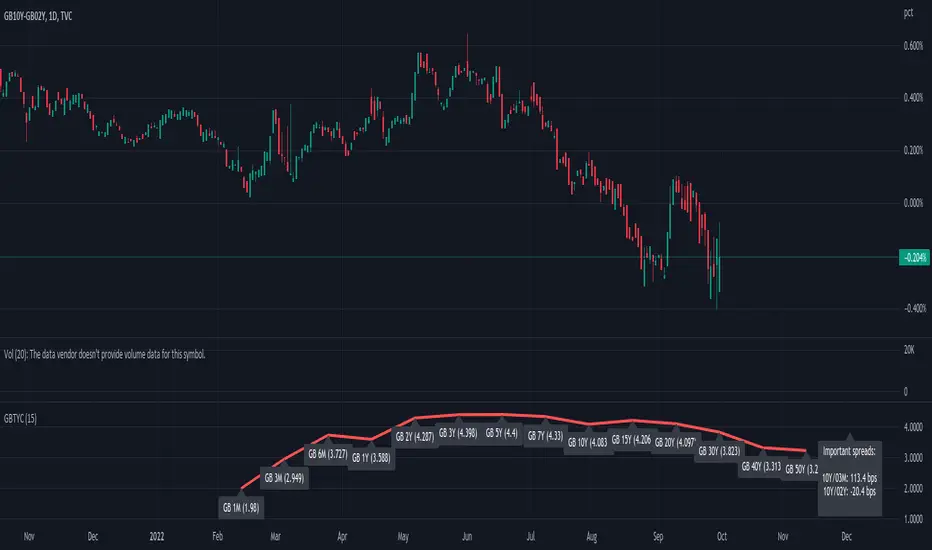
GB Gilt Yield CurveWith thanks to @longfiat whose US Treasury Yield Curve served as the basis for this indicator
This is created very quickly to provide a sense of the GB Gilt Yield curve in light of government induced market dysfunction as a result of an ill-conceived mini-budget.
Note that I omitted GB04Y, GB06Y, GB08Y, GB09Y and GB12Y to avoid overcrowding the chart with excess information and thereby render the indicator more readily usable.
Regression Curve with Normalized AngleRegression Curve with Normalized Angle plots the Linear Regression Curve and the Pearson correlation coefficient to allow a visualized direct comparison of the two over a user defined lookback period. The Pearson correlation coefficient can be used to identify trend without the need to chart the Linear Regression line. As seen in the Crude Chart, Linear Regression angle alone cannot always be used to determine trend. Included are Long and Short threshold lines that can be used to define at what angle a Long or Short trend begins.

VIX Near-Term Futures CurveThis indicator provides a 3 day smoothed histogram expressing whether the near term VIX futures curve is in a state of contango or backwardation. The solid red/green bars express the spot vs front-month vs next month curve with the value being the cumulative point spread between them. The shaded overlay bars express the spread between the VIX spot index and front-month futures contract only.
This indicator is to be used on a 1 DAY interval or higher.

Yield Curve Percent Inverted**************************************************************************************************
Yield Curve Percent Inverted Indicator
This indicator will check all fifty-five Treasury Bond Yield spreads - every combination from
1-month up to 30-year - and then graph the percentage of spreads which are inverted.
Yield curve inversion occurs when the longer-duration bond pays a lower yield than the shorter-
duration bond. Longer-dated bonds normally pay a higher yield because the investor's money is
committed for a longer period of time. Inversion occurs when investors have little confidence
in the near-term economy and demand higher rates for short-term investments.
Historically, a few months ahead of a recession this percent-inverted value will spike up into
the 60%-70% range - you can see this behavior in 1989, 2000, 2007, and 2019. (Note that there
is no data available on Trading View prior to 1987.)
**************************************************************************************************

Yield Curve Inversion MonitorIdentifies when the US Treasury Yield Curve inverts (2 and 10 year bond rates).
When they ‘invert’ long-term bonds have a lower interest rate than short-term bonds. In other words, the bond market is pricing in a significant drop in future interest rates (which might be caused by the US Fed fighting off a recession in the future).
In the last 50 years, every time the US treasury yield curve inverted a recession followed within 3 years. On average the S&P500 gained 19.1% following the inversion and peaked 13 months later. In other words, as far as investors are concerned, the recession began roughly one year later.
However, once the market peaks, it then drops 37.6% on average, wiping out all those gains and more.
...Looks like 2020 is shaping up to be another prime example.

Linear Regression CurveLinear Regression Curve
Regression analysis is the analysis method used to measure the relationship between two or more variables. In statistics, linear regression is a linear approach to modeling the relationship between a scalar response and one or more explanatory variables. An explanatory variable is called simple linear regression. For multiple descriptive variables, the process is called multiple linear regression.
Regression analysis is performed in order to determine the relationship between two or more variables including cause-effect relationship and to make predictions or predictions about that subject by using this relationship.
When we see a relationship in a point graph, we can use a line to summarize the relationship in the data. We can also use this truth to make estimates of the data. This process is called linear regression.
Linear Regression Curve , Your should do detailed research to get more information about it.
* In this display, you can adjust the length.