Pink's Daily SMA Script🚗 This script provides a customizable overlay of seven simple moving averages (SMAs) on the chart. Users can control the display of each SMA by toggling them on or off. The lengths of these SMAs are adjustable, allowing for tailored analysis based on individual preferences.
📊 The script calculates daily SMA values using the request.security() function and plots them as horizontal lines on the chart. These SMAs are updated once per day, typically at the start of the pre-market session (9:00 AM in the "America/New_York" timezone). The script resets the SMA values at the start of each new day, ensuring fresh data for daily analysis.
🕒 In addition to the SMAs, the script includes an optional feature that highlights specific time ranges on the chart: from 11:00 AM to 11:05 AM and from 1:00 PM to 1:30 PM (based on the "America/New_York" timezone). Users can toggle these background highlights on or off, providing visual cues for key times during the trading day. The 11:00 AM window is highlighted in gray, while the 1:00 PM window is highlighted in blue.
🔖 The SMAs are labeled on the right side of the chart, with only one label visible at a time for each SMA. These labels display the length of the respective SMA, and their colors match the lines drawn on the chart, helping to distinguish between the different SMAs.
Special thanks to Pinks333 (www.tradingview.com)
Who provided the logic for the script and was willing to share her logic and open source the script.
在腳本中搜尋"daily"

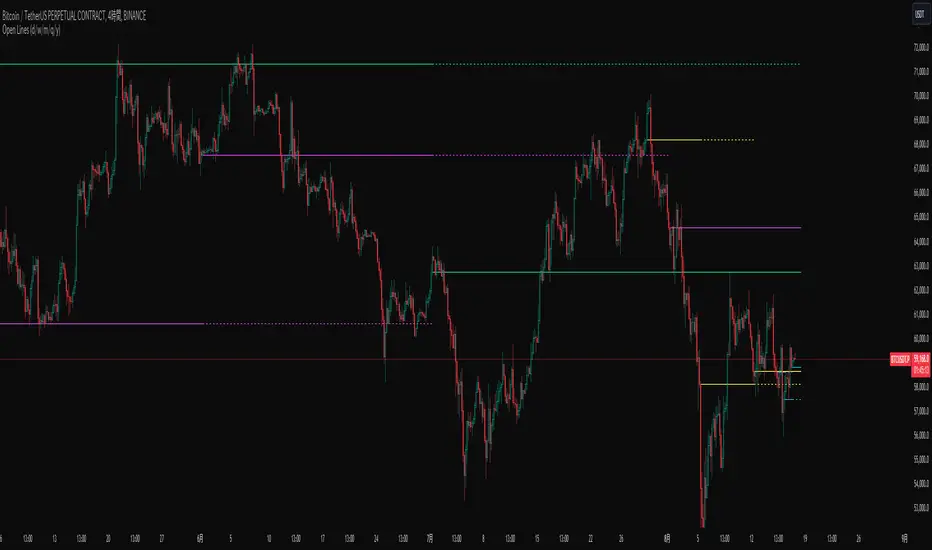
Open Lines (Daily/W/M/Q/Yearly)Overview
This script draws horizontal lines based on the opening prices of daily, weekly, monthly, quarterly, and yearly candles. A unique feature of this script is the ability to overlay lines from previous periods onto the current period. For example, it can draw the opening price line of the current month as well as the line from the previous month. This allows you to observe not only the battle between bullish and bearish candles of the current period but also the battle over whether the current candle engulfs the previous candle.
Settings
1. Common Settings for Daily to Yearly
On: Toggles the line drawing ON/OFF.
Line: Sets how many periods back the line should be drawn from the current period.
Extend: Sets how many periods into the future the lines from past candles should be extended.
Typically, an Extend value of 1 is sufficient, but you can increase this value if you want to observe engulfing patterns spanning multiple periods.
2. Style Settings
To differentiate between the current and past lines, the following settings are available:
Current session line style: Sets the style for the line representing the opening price of the current candle.
Next session line style: Sets the style for the line representing the opening price of past candles.
Available styles are as follows:
sol: solid line
dsh: dashed line
dot: dotted line
3. Other Settings
Allow overlapping of different session lines: By default, this setting prevents overlapping lines when candles from different periods open at the same time. Enabling this option allows lines from different periods, such as quarterly and monthly, to be drawn simultaneously if they overlap. By default, only the lines from the higher time frame are drawn.
B A N K $ - Opening Lines / Daily Separators This is a simple indicator that aids the trader in being able to visualise each trading day of the week;
Key Features
Weekly Open Line
Daily Open Line
Option for Background Lines
Weekly & Daily Open Lines
Information ℹ️
These are vertical lines that are anchored to the hour of the Weekly Open and the hour of each Daily Candle Open. The settings are customisable, allowing to you edit the Width, Style & Colour. You can also select Monday as the Weekly Open if Monday is a no-trade day for you.
Settings ⚙️
1h Toggle - by default Daily Open Lines are only visible under the 1h, you can select to also make them visible on the 1h.
Background Lines - you can replace the chart lines with background lines, this can improve performance and allow you to load more lines on the chart when going back in price.
Show Days of Week - this prints the current day on the chart.

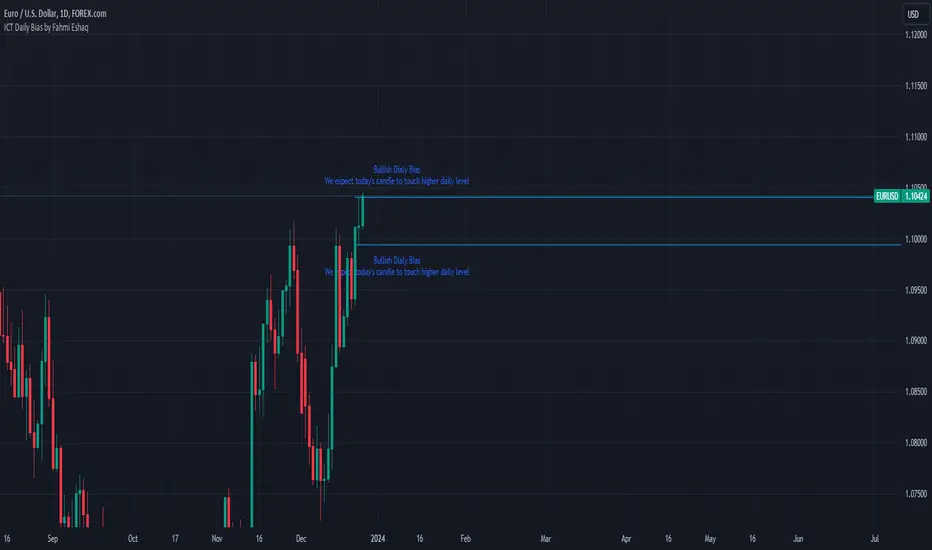
ICT Daily Bias by Fahmi EshaqICT Daily Bias helps us determine where the market is likely to go for the day. The ICT Daily Bias tool aids in forecasting the likely direction of the market for the day. It delineates the previous day's high and low levels, providing insights into potential price movements whether the market is expected to touch the previous day's high or low.
Previous Day High and Low + Separators Daily/WeeklyPrevious Day High and Low + Separators Daily/Weekly is an indicator based on separators of days and weeks and at the same time points out the previous highs and lows, everything is marked by lines, it consists of creating a clean graph and separated by the different trading days, referring to the extreme points created the previous day.
USEAGE
Point to each day of the week at the top of the chart to get a time location in your trading week and day sparation determined by 00:00 of any timezone.
The reference of the previous day's higs and LOWS is vitally important to understand which direction is most likely for the next day, either continuation or reversal.
DETAILS
As you can see you will be able to adapt these lines according to your chart design and with the desired intensity of appearance.
SETTINGS
UTC OFFSET: Determine your TIMEZONE in this section.
DAILY SEPARATOR: You have the option to change the color, style, width and text color.
WEEKLY SEPARATOR: You have the option to change the color, style, width and text color.
PREVIOUS HIGS & LOWS: You have the option to change the color, style, width and text color.

Scoopy StacksWaffle Around Multiple
(Open, High, Low, Close) Stacks On
Pre/Post Market & (Daily, Weekly,
Monthly, Yearly) Sessions With
Meticulous Columns, Rows, Tooltips,
Colors, Custom Ideas, and Alerts.
Sessions Use Two Step Incremental Values
Default Value: (1) Shows Two Previous
(O, H, L, C); Increasing Value Swaps
Sessions With Next Two Stacks.
⬛️ KEY WORDS:
🟢 Crossover | 🔴 Crossunder
📗 High | 📕 Low
📔 Open | 📓 Close
🥇 First Idea | 🥈 Second Idea
🥉 Third Idea | 🎖️ Fourth Idea
🟥 ALERTS:
Default Option: (Per Bar)
Alerts Once Conditions Are Met
(Bar Close) Alerts When Bar Closes
Default Option: (Reg)
Alerts During Regular Market
Trading Hours, (0930-1600)
(Ext) Alerts During Extended
Market Hours, (1600-0930)
(24/7) Alerts All Day
Optional Preferences:
Regular Alerts - Stocks
Extended Alerts - Futures
24/7 Alerts - Crypto
🟧 STACKS:
Default Value: (1)
Incremental Stack Value, Increasing Value
Swaps Sessions With the Next Two Stacks
(✓) Swap Stacks?
Pre/Post Market High/Lows,
1-2 Day High/Lows, 1-2 Week High/Lows,
1-2 Month High/Lows, 1-2 Year High/Lows
( ) Swap Stacks?
Pre/Post Market Open/Close,
1-2 Day Open/Close, 1-2 Week Open/Close,
1-2 Month Open/Close, 1-2 Year Open/Close
🟨 EXAMPLES:
Default Stack:
🟢 | 📗 Pre Market High (PRE) | 4600.00
🔴 | 📕 Post Market Low (POST) | 420.00
Optional: (Open)
🟢 | 📔 Post Market Open (POST) | 4400.00
Optional: (Close)
🔴 | 📓 Pre Market Close (PRE) | 430.00
Default Stack Value: (1)
🔴 | 📗 1 Day High (1DH) | 460.00
Next Stack Value: (3)
🟢 | 📕 4 Day Low (4DL) | 420.00
Optional: (Open)
🔴 | 📔 2 Day Open (2DO) | 440.00
Optional: (Close)
🟢 | 📓 3 Day Close (3DC) | 430.00
Default Stack Value: (5)
🟢 | 📗 5 Week High (5WH) | 460.00
Next Stack Value: (7)
🔴 | 📕 8 Week Low (8WL) | 420.00
Optional: (Open)
🔴 | 📔 7 Week Open (7WO) | 4400.00
Optional: (Close)
🟢 | 📓 6 Week Close (6WC) | 430.00
Default Stack Value: (9)
🔴 | 📗 9 Month High (9MH) | 460.00
Next Stack Value: (11)
🟢 | 📕 12 Month Low (12ML) | 420.00
Optional: (Open)
🟢 | 📔 11 Month Open (11MO) | 4400.00
Optional: (Close)
🔴 | 📓 10 Month Close (10MC) | 430.00
Default Stack Value: (13)
🟢 | 📗 13 Year High (13YH) | 460.00
Next Stack Value: (15)
🟢 | 📕 16 Year Low (16YL) | 420.00
Optional: (Open)
🔴 | 📔 15 Year Open (15YO) | 4400.00
Optional: (Close)
🔴 | 📓 14 Year Close (14YC) | 430.00
🟩 TABLES:
Default Value: (1)
Moves Table Up, Down, Left, or Right
Based on Second Default Value
First Default Value: (Top Right)
Sets Table Placement, Middle Center
Allows Table To Move In All Directions
Second Default Value: (Default)
Fixed Table Position, Switching Values
Moves Direction of the Table
🟦 IDEAS:
(✓) Show Ideas?
Shows Four Ideas With Custom Texts
and Values; Ideas Are Based Around
Post-It Note Reminders with Alerts
Suggestions For Text Ideas:
Take Profit, Stop Loss, Trim, Hold,
Long, Short, Bounce Spot, Retest,
Chop, Support, Resistance, Buy, Sell
🟪 EXAMPLES:
Default Value: (5)
Shows the Custom Table Value For
Sorted Table Positions and Alerts
Default Text: (🥇)
Shown On First Table Cell and
Message Appearing On Alerts
Alert Shows: 🟢 | 🥇 | 5.00
Default Value: (10)
Shows the Custom Table Value For
Sorted Table Positions and Alerts
Default Text: (🥈)
Shown On Second Table Cell and
Message Appearing On Alerts
Alert Shows: 🔴 | 🥈 | 10.00
Default Value: (50)
Shows the Custom Table Value For
Sorted Table Positions and Alerts
Default Text: (🥉)
Shown On Third Table Cell and
Message Appearing On Alerts
Alert Shows: 🟢 | 🥉 | 50.00
Default Value: (100)
Shows the Custom Table Value For
Sorted Table Positions and Alerts
Default Text: (🎖️)
Shown On Fourth Table Cell and
Message Appearing On Alerts
Alert Shows: 🔴 | 🎖️ | 100.00
⬛️ REFERENCES:
Pre-market Highs & Lows on regular
trading hours (RTH) chart
By Twingall
Previous Day Week Highs & Lows
By Sbtnc
Screener for 40+ instruments
By QuantNomad
Daily Weekly Monthly Yearly Opens
By Meliksah55

Ribbit RangesBounce Around Multiple
(Open, High, Low, Close) Ranges
On Pre/Post Market & (Daily, Weekly,
Monthly, Yearly) Sessions With
Meticulous Lines, Labels, Tooltips,
Colors, Custom Ideas, and Alerts.
Sessions Use Two Step Incremental Values
Default Value: (1) Shows Two Previous
(O, H, L, C); Increasing Value Swaps
Sessions With Next Two Ranges.
⬛️ KEY WORDS:
🟢 Crossover | 🔴 Crossunder
📗 High | 📕 Low
📔 Open | 📓 Close
🥇 First Idea | 🥈 Second Idea
🥉 Third Idea | 🎖️ Fourth Idea
🟥 ALERTS:
Default Option: (Per Bar)
Alerts Once Conditions Are Met
(Bar Close) Alerts When Bar Closes
Default Option: (Reg)
Alerts During Regular Market
Trading Hours, (0930-1600)
(Ext) Alerts During Extended
Market Hours, (1600-0930)
(24/7) Alerts All Day
Optional Preferences:
Regular Alerts - Stocks
Extended Alerts - Futures
24/7 Alerts - Crypto
🟧 RANGES:
Default Value: (1)
Incremental Range Value, Increasing Value
Swaps Sessions With the Next Two Ranges
(✓) Swap Ranges?
Pre/Post Market High/Lows,
1-2 Day High/Lows, 1-2 Week High/Lows,
1-2 Month High/Lows, 1-2 Year High/Lows
( ) Swap Ranges?
Pre/Post Market Open/Close,
1-2 Day Open/Close, 1-2 Week Open/Close,
1-2 Month Open/Close, 1-2 Year Open/Close
🟨 EXAMPLES:
Default Range:
🟢 | 📗 Pre Market High (PRE) | 4600.00
🔴 | 📕 Post Market Low (POST) | 420.00
Optional: (Open)
🟢 | 📔 Post Market Open (POST) | 4400.00
Optional: (Close)
🔴 | 📓 Pre Market Close (PRE) | 430.00
Default Range Value: (1)
🔴 | 📗 1 Day High (1DH) | 460.00
Next Range Value: (3)
🟢 | 📕 4 Day Low (4DL) | 420.00
Optional: (Open)
🔴 | 📔 2 Day Open (2DO) | 440.00
Optional: (Close)
🟢 | 📓 3 Day Close (3DC) | 430.00
Default Range Value: (5)
🟢 | 📗 5 Week High (5WH) | 460.00
Next Range Value: (7)
🔴 | 📕 8 Week Low (8WL) | 420.00
Optional: (Open)
🔴 | 📔 7 Week Open (7WO) | 4400.00
Optional: (Close)
🟢 | 📓 6 Week Close (6WC) | 430.00
Default Range Value: (9)
🔴 | 📗 9 Month High (9MH) | 460.00
Next Range Value: (11)
🟢 | 📕 12 Month Low (12ML) | 420.00
Optional: (Open)
🟢 | 📔 11 Month Open (11MO) | 4400.00
Optional: (Close)
🔴 | 📓 10 Month Close (10MC) | 430.00
Default Range Value: (13)
🟢 | 📗 13 Year High (13YH) | 460.00
Next Range Value: (15)
🟢 | 📕 16 Year Low (16YL) | 420.00
Optional: (Open)
🔴 | 📔 15 Year Open (15YO) | 4400.00
Optional: (Close)
🔴 | 📓 14 Year Close (14YC) | 430.00
🟩 COLORS:
(✓) Swap Colors?
Text Color Is Shown Using
Background Color
( ) Swap Colors?
Background Color Is Shown
Using Text Color
🟦 IDEAS:
(✓) Show Ideas?
Plots Four Ideas With Custom Lines
and Labels; Ideas Are Based Around
Post-It Note Reminders with Alerts
Suggestions For Text Ideas:
Take Profit, Stop Loss, Trim, Hold,
Long, Short, Bounce Spot, Retest,
Chop, Support, Resistance, Buy, Sell
🟪 EXAMPLES:
Default Value: (5)
Shows the Custom Value For
Lines, Labels, and Alerts
Default Text: (🥇)
Shown On First Label and
Message Appearing On Alerts
Alert Shows: 🟢 | 🥇 | 5.00
Default Value: (10)
Shows the Custom Value For
Lines, Labels, and Alerts
Default Text: (🥈)
Shown On Second Label and
Message Appearing On Alerts
Alert Shows: 🔴 | 🥈 | 10.00
Default Value: (50)
Shows the Custom Value For
Lines, Labels, and Alerts
Default Text: (🥉)
Shown On Third Label and
Message Appearing On Alerts
Alert Shows: 🟢 | 🥉 | 50.00
Default Value: (100)
Shows the Custom Value For
Lines, Labels, and Alerts
Default Text: (🎖️)
Shown On Fourth Label and
Message Appearing On Alerts
Alert Shows: 🔴 | 🎖️ | 100.00
⬛️ REFERENCES:
Pre-market Highs & Lows on regular
trading hours (RTH) chart
By Twingall
Previous Day Week Highs & Lows
By Sbtnc
Screener for 40+ instruments
By QuantNomad
Daily Weekly Monthly Yearly Opens
By Meliksah55

Crypto Daily WatchList And Screener [M]
Hi, this is a watchlist and screener indicator designed for traders in the field of cryptocurrencies who want to monitor developments in other currency pairs and indices.
The indicator consists of two tables. One of them is the table containing indices such as BTC dominance, total, total2, which allows you to track market developments and changes. In this table, you will find price information, daily change, stochastic, and trend information.
The other table includes cryptocurrencies like BTC/USDT, ETH/USDT, DOT/USDT, and more. In this table, you will see real-time prices, daily volume, daily change, stochastic, the correlation coefficient between the pair and Bitcoin, and the trend value calculated based on MACD.
The "Customize" section in the settings enables you to personalize the appearance of the tables according to your preferences.

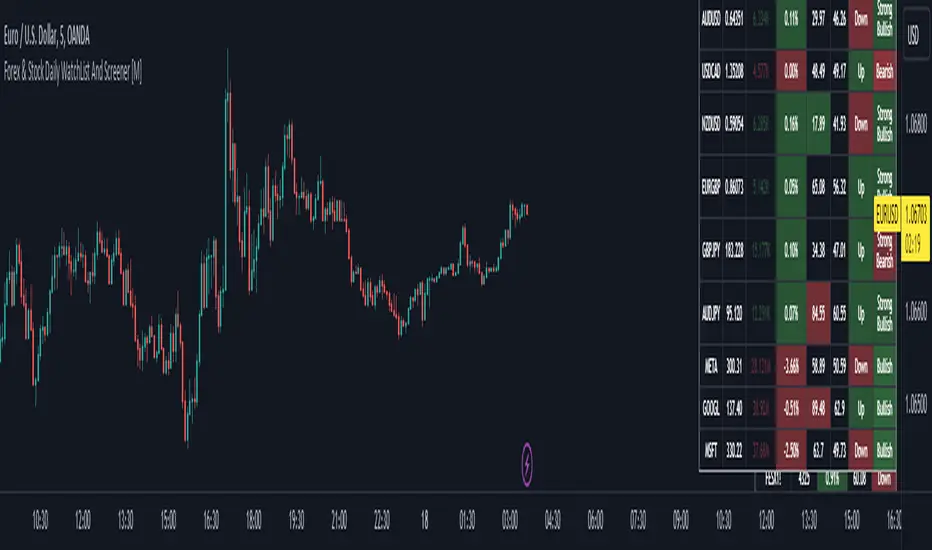
Forex & Stock Daily WatchList And Screener [M]Hi, this is a watchlist and screener indicator for Forex and Stocks.
This indicator is designed for traders who trade in the forex markets and monitor developments in indices and other currency pairs.
It includes information on 14 indices such as the volatility index, Baltic dry index, etc. You can customize the indices as you wish. The indices table contains the index's price (or points), daily change, stochastic value, and trend direction.
The second table is designed for trading forex and stock currency pairs.
In this table, you will find information such as price, volume, change, stochastic, RSI, trend direction, and MACD result for all traded pairs. You can customize all the currency pairs in this table as you wish, and you can also tailor the oscillator settings to your preferences.
In the settings section, you can use checkboxes to hide the pairs in both tables.
The "Customize" section in the settings allows you to personalize the table appearances according to your preferences.
OBV Daily High Low Box Realtime (On Balance Volume)Overview
This indicator plots horizontal lines at the daily high and low levels of the On Balance Volume (OBV).
The numerical lines for each day are updated in real-time as the OBV high and low values change.
Please note that there are limitations on how far back in history the indicator can go due to Pine Script's object drawing limitations.

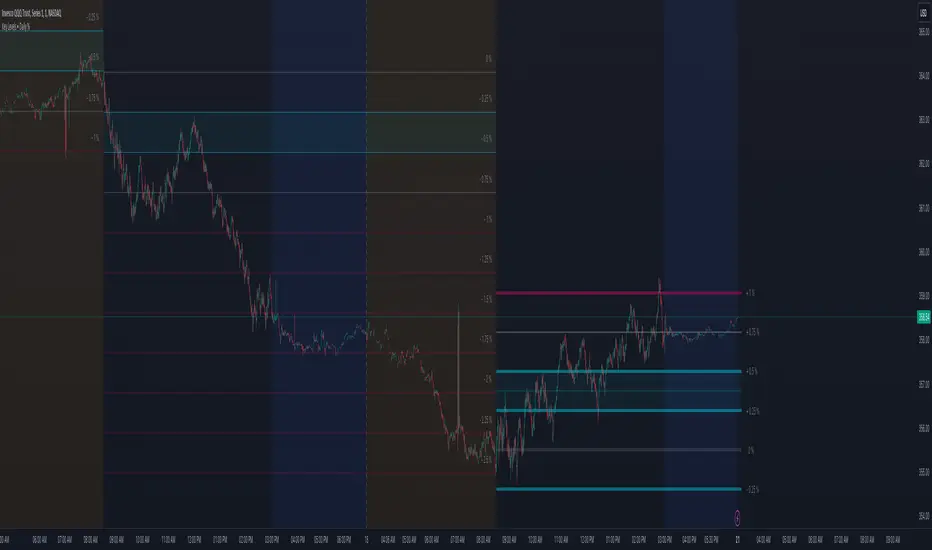
Key Levels (Daily Percentages)OVERVIEW
This indicator automatically identifies and progressively draws daily percentage levels, normalized to the first market bar.
Percentages are one of the most common ways to measure price movement (outside price itself). Being able to visually reference these levels helps contextualize price action, in addition to giving us a glimpse into how algos might "see" the market.
This script is most useful on charts with smaller time frames (1 to 5 minutes). This is not ideal for medium or larger time frames (greater than 5 minutes).
INPUTS
You can configure:
• Line size, style, colors and maximum length
• Label colors and visibility
• Fractional and intra level visibility
• Bidirectional zone parameters (custom range and extended anomalies)
• Normalization source
• Price Proximity features
• Market Hours and Time Zone
INSPIRATION
Broad Assumptions:
• +/- 70% of days move 1%, 20% of days move 1-2%, and 10% of days have moves exceeding 2%.
• +/- 10-20% of days trend, with moves ≥ 1%.
• All trading strategies are effectively scalping, mean reversion, or trend.
• Humans program algos to capitalize on these assumptions, using percentages to mange / execute trades.
MarketSmith Daily Market IndicatorsMarketSmith Daily Market Indicators is designed to mimic the Daily Market Indicators tab found in MarketSmith. This tab contains 4 different secondary indicators to help gauge the health of the overall market.
This indicator allows you to choose which of the 4 indicators to show, as well as which index to pull data from, Nasdaq or NYSE. There is also a snapshot table showing the following:
# of stock advancing and up volume
# of stocks declining and down volume
# of stock unchanged and unchanged volume
# of stocks making new highs and new lows
Now let's look at the 4 indicators and how they work.
Advance/Decline Line
Plots the number of advancing shares vs the number of declining shares. Heavily weighted index stocks can skew price action, this line helps reveal that and whether most stocks are aligned with the trend.
Short Term Overbought/Oversold Oscillator
A 10-day moving average of the number of stocks moving up in price less the number of stocks moving down in price.
10 Day Moving Average of Up & Down Volume
Two 10 day moving averages to represent the volume of all stocks. Blue line: total volume of all stocks moving up in price. Red line: the total volume of all stocks moving down in price.
10 Day Moving Average of New Highs & New Lows
Two 10-day moving average to represent stocks making new highs and new lows. Blue line: The number of stocks making new price highs. Red line: The number of stocks reaching new lows.
Note this indicator is designed to work on a daily time frame chart. Data typically updates 90 minutes after the close. Data may differ from Marketsmith due to different providers, however the general trends are the same.

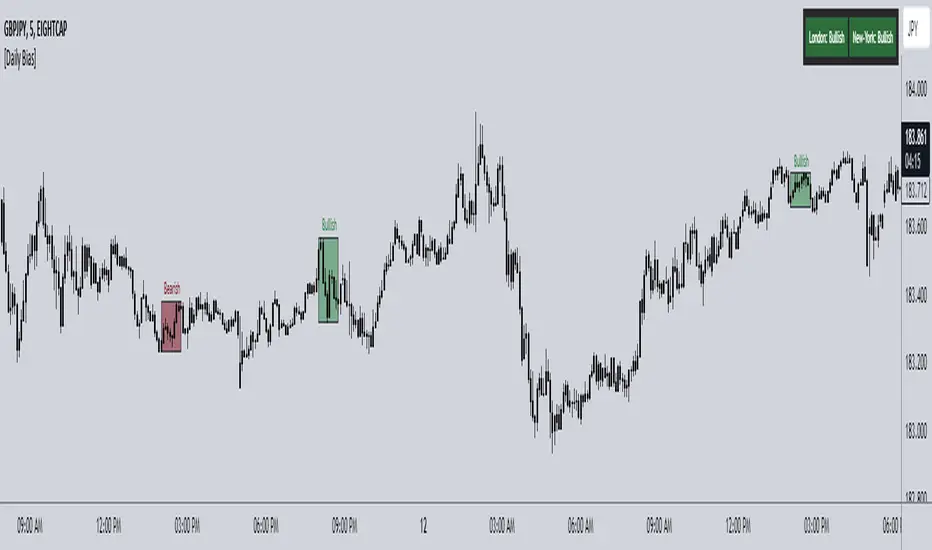
ICT Daily Bias Finder [DTCC]What is This?
The ICT Daily Bias Finder uses a method called "DTCC" to identify the London and New York session's bias, bullish or bearish. This indicator should only be relied on for 5 minute, and not other timeframes.
How do I use it?
Look at the previous days two boxes (labeled DTCC Bear/DTCC Bull), if both are bullish or both are bearish it is NOT recommended to rely on DTCC for that day. If the first one is bullish and second one is bearish, the DTCC for the next day says that London session will turn ABOVE midnight opening price, while New York will turn UNDER midnight opening price (longs in London, shorts in New York). If the second one is bearish and the first is bullish, the DTCC for the next day says that London session will turn UNDER midnight opening price, while New York will turn ABOVE midnight opening price (shorts in London, longs in New York)
Emoji guide to DTCC indicator:
🟢🟢: Don't trust DTCC for that day
🔴🔴: Don't trust DTCC for that day
🟢🔴: Longs in London above Midnight Opening Price, Shorts in New York under Midnight Opening Price
🔴🟢: Shorts in London under Midnight Opening Price, Longs in New York under Midnight Opening Price
Reminder: NEVER rely solely on DTCC, DTCC can be wrong and is not right 100% of times.
Relative Daily Change% by SUMIT
"Relative Daily Change%" Indicator (RDC)
The "Relative Daily Change%" indicator compares a stock's average daily price change percentage over the last 200 days with a chosen index.
It plots a colored curve. If the stock's change% is higher than the index, the curve is green, indicating it's doing better. Red means the stock is under-performing.
This indicator is designed to compare the performance of a stock with specific index (as selected) for last 200 candles.
I use this during a breakout to see whether the stock is performing well with comparison to it`s index. As I marked in the chart there was a range zone (red box), we got a breakout with good volume and it is also sustaining above 50 and 200 EMA, the RDC color is also in green so as per my indicator it is performing well. This is how I do fine-tuning of my analysis for a breakout strategy.
You can select Index from the list available in input
**Line Color Green = Avg Change% per day of the stock is more than the Selected Index
**Line Color White = Avg Change% per day of the stock is less than the Selected Index
If you want details of stocks for all index you can ask for it.
Disclaimer : **This is for educational purpose only. It is not any kind of trade recommendation/tips.

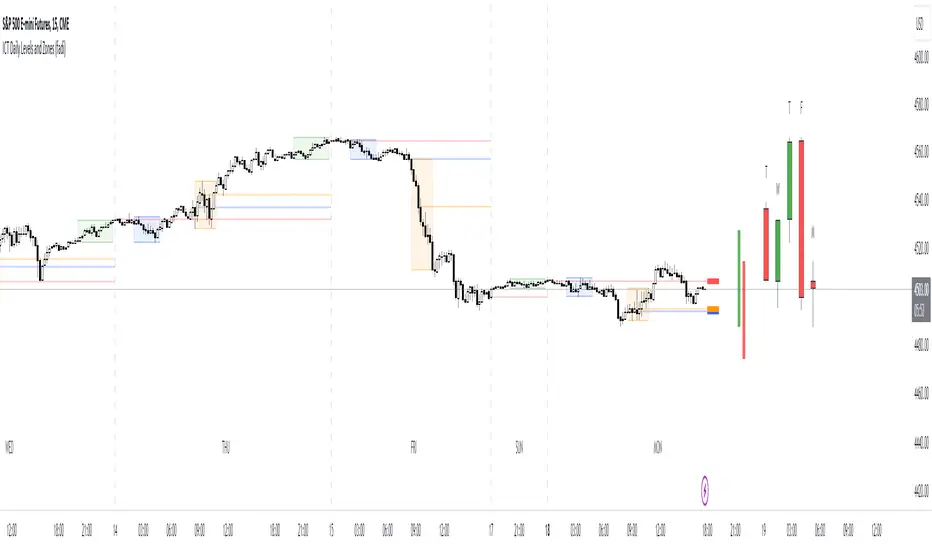
ICT Daily Levels and Zones (fadi)ICT Daily Levels and Zones indicator provides some of the relevant zones and levels for ICT type analysis. The purpose of this indicator is to provide consolidated way of automatically highlighting and identifying relevant levels for ICT type traders.
Daily Separator and Day of Week
Display a separator based on NY Midnight and day of week.
Killzones
Highlight ICT Asia, London, and NY killzones. Please note that the default times are based on Index Futures. Update the times of day if you plan on using it for other instruments such as Forex.
Open Range
The 9:30am to 10:00am open range
(Shown with Extend setting on)
Open Range Gap
The open range Gap is the difference between the 4:15pm close and the 9:30am open.
(Shown with Extend setting on)
Time of Day Levels
The Midnight, 8:30am, and 9:30am open levels.
Daily Midnight Candle
ICT style Daily candle formation based on Midnight open
High Volume Daily Warning Signal- Jesse Livermore // values are in %, so on right Y axis a value of 50 means 50% above the average volume of set length (default of 20)
These important confirming volume spurts often end the day with a 50 percent to 500 percent increase in the average daily volume of the stock. - Jesse Livermore
when daily volume increases by 50% of it average daily volume, it is a warning sign in the possible change of trend or pivotal point
you can select horizontal levels of interest

ATR Daily BandThis indicator draws an upper and lower band for each day. It uses the Average True Range calculation (with configurable lookback) and places the band at 1ATR above and 1ATR below the daily open.
I use this indicator as a simple gauge to tell how significant price movement is, and get a feel for the daily volatility. Due to the fractal nature of price action, it can be difficult to determine if a price movement is significant while zoomed in on a single intraday chart. Using this indicator, I can tell if the price action is approaching the ATR or if it's just staying within the band.
Strategies: Useful for both mean reversion and momentum strategies. It's up to you to decide how this metric will fit into your trading strategy. I currently use this indicator to look for mean reversion setups, but that is due to the current market conditions and my personal trading style.

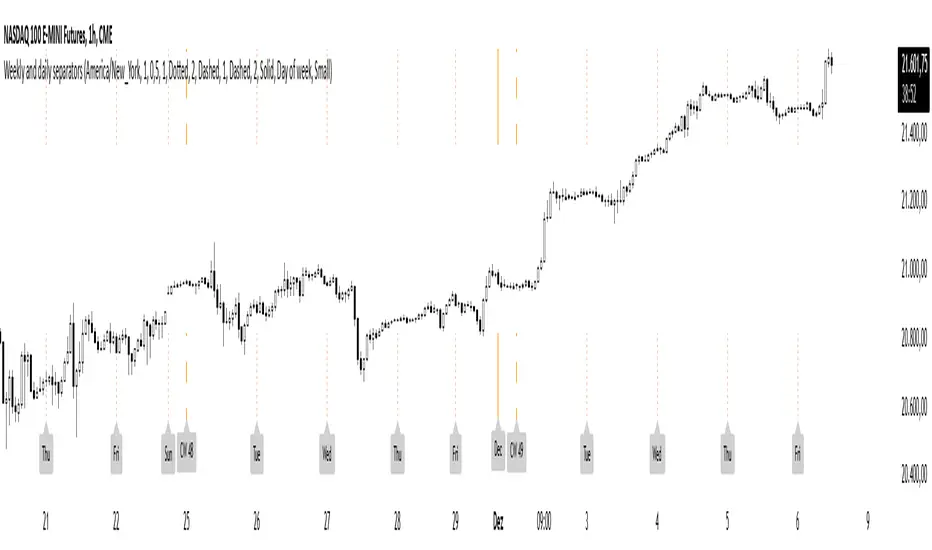
Weekly and daily separatorsThis script plots vertical line between each trading week (thick, solid) and smaller lines (dotted) between each trading day. This helps kepping a better overview on the aspect of time on the higher timeframes below 1D. The distance of the lines to the top and bottom of the chart is controlled by your chart settings menu under Appearance -> Margins.
Short Sale Restriction (SSR) Level - Intraday and daily chartsThis script plots the Short Sale Restriction (SSR) Level relative to the previous day's closing price. It works on any time frame from 1 minute to daily, showing the correct level even during the extended session.
The Short Sale Restriction (SSR) is a rule of the Securities and Exchange Commission (SEC) that restricts traders from short-selling stocks that are rapidly decreasing in value in an attempt to profit from the price drop. The rule was introduced in 2010, after the 2008 financial crisis, to prevent market manipulation and excessive volatility.
The SSR works as follows: when the price of a particular stock drops 10% compared to the previous day's closing price, the SSR is triggered and a temporary limitation is imposed on traders' ability to short-sell that stock for the rest of the trading day and the following day. During the SSR activation period, traders can still short-sell, but only if the sale is "covered" by another long position on the same stock.
Knowledge of the SSR level is especially important for day traders because it helps them to plan their trading strategies in advance, avoiding situations where short-selling becomes more difficult. Additionally, if a stock has exceeded the SSR threshold, traders can expect an increase in price volatility.
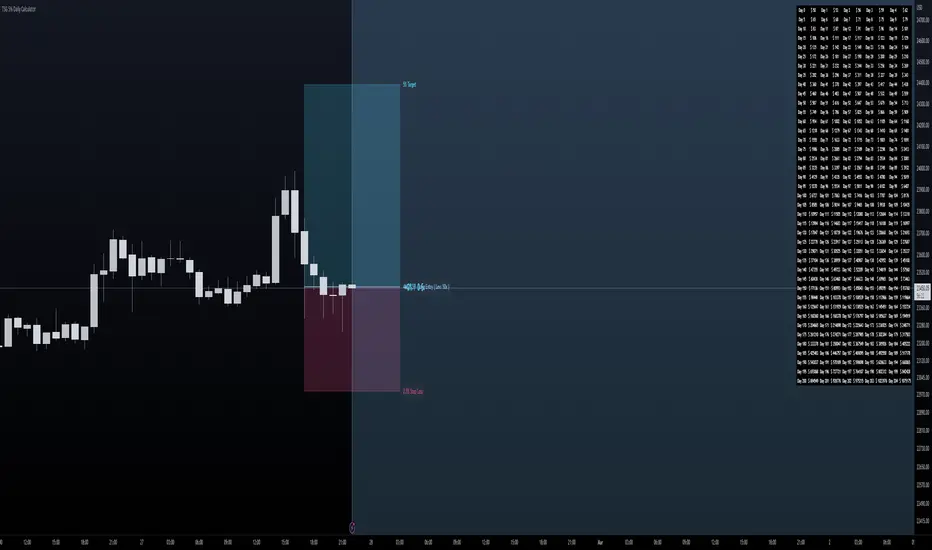
TSG 5% Daily CalculatorThis is a calculator I've created to help visualize Target and Risk Levels based on leverage use to trade crypto.
How to use it ?
Basic Use:
- Set the Direction of your trade - either Long or Short
- Set the Leverage you use in your trade - it is crutial to define the risk and target levels
- Set the Risk Amount you want to risk (in %) of your total balance ( Advised 2-3% )
- Set the Target Amount you want to profit at the target (the idea of this is 5% daily, so 5%).
- Set Entry Price if you have opened a position, and you will visually see your progress. Otherwise the levels will be adjusted to the Close of the candle.
Additions:
- Set your Initial Balance - to help you visualize on the Table your progress
- Set your Current Balance - for visualization purposes on ongoing trades and on the Table
- Entry Date - Advised to set it when you open a trade - you will be tracking the progress of your trade since the candle on which you opened it
- Show Table - to show the table of 5% daily and the target it is set on per day
- Table Size - Set table to be small or normal
- Together with the Table you have a big blue area behind that ends on the day you will become a Millionaire based on the Initial Balance, Current balance and Target % in your inputs
Opening Range & Daily and Weekly PivotsThis script is for a combination of two indicators: an Opening Range Breakout (ORB) indicator and a daily/weekly high/low pivot indicator. The ORB indicator displays the opening range (the high and low of the first X minutes of the trading day, where X is a user-defined parameter) as two lines on the chart. If the price closes above the ORB high, the script triggers an alert with the message "Price has broken above the opening range." Similarly, if the price closes below the ORB low, the script triggers an alert with the message "Price has broken below the opening range."
The daily/weekly high/low pivot indicator plots the previous day's high and low as well as the previous week's high and low. If the current price closes above yesterday's high or last week's high, the script triggers an alert with the messages "We are now trading higher than the previous daily high" and "We are now trading higher than the last week high", respectively. If the current price closes below yesterday's low or last week's low, the script triggers an alert with the messages "We are now trading lower than the previous daily low" and "We are now trading lower than the last week low", respectively.
In addition to the visual representation on the chart, the script also triggers alerts when the price crosses any of these levels. These alerts are intended to help traders make decisions about entering or exiting trades based on the price action relative to key levels of support and resistance.

Moon Phases + Daily, Weekly, Monthly, Quarterly & Yearly Breaks█ Moon Phases
From LuxAlgo description.
Trading moon phases has become quite popular among traders, believing that there exists a relationship between moon phases and market movements.
This strategy is based on an estimate of moon phases with the possibility to use different methods to determine long/short positions based on moon phases.
Note that we assume moon phases are perfectly periodic with a cycle of 29.530588853 days (which is not realistically the case), as such there exists a difference between the detected moon phases by the strategy and the ones you would see. This difference becomes less important when using higher timeframes.
█ Daily, Weekly, Monthly, Quarterly & Yearly Breaks
This indicator marks the start of the selected periods with a vertical line that help with identifying cycles.
It allows to enable or disable independently the daily, weekly, monthly, quarterly and yearly session breaks.
This script is based on LuxAlgo and kaushi / icostan scripts.
Moon Phases Strategy
Year/Quarter/Month/Week/Day breaks
Month/week breaks

Buy Sell Calendar [LuxAlgo]The Buy Sell Calendar indicator displays a calendar showing the sentiment for the current day/month. Three different methods can be used to determine this sentiment.
The calendar can also highlight the percentage of bullish days/months for a month/year.
🔶 SETTINGS
Frequency: Calendar frequency, options include "Daily" and "Monthly"
Sentiment Method: Method used to determine the sentiment for the day/month, options include: "Linreg", "Accumulated Deltas", and "Max/Min"
Timezone Offset: UTC time zone offset.
Limit Date: Limit date used by the calendar, the sentiment of days/months outside this limit will not be returned.
🔹 Calendar
Show Calendar: Determines whether to display or hide the calendar.
Location: Location of the calendar on the chart.
Size: Calendar size.
🔶 USAGE
The proposed script can allow users to quickly determine if a specific day/month is considered bullish or bearish. A green cell is used for bullish days/months, while a red one is used for bearish days/months.
Additionally vertical lines are displayed on new days/months with a color highlighting the current sentiment for this specific day/month. Note that this is done retrospectively, the color of a line set at time t might differ at time t+n .
🔶 SENTIMENT METHODS
Determining whether a day/month is bullish or bearish can be done using three different methods. Note that each method makes use of the closing price as the input, and as such can eventually return different results depending on the selected timeframe. Each method is described below:
🔹 Linreg
The Linreg method fit lines between each day/month using the method of least squares and determines if that particular day is bullish or bearish based on the line slope sign. For example, a rising line would indicate a bullish day/month.
🔹 Accumulated Deltas
The method of accumulated deltas simply accumulates bullish and bearish price changes for the current day/month, the result with the highest magnitude determines the sentiment for that day/month.
🔹 Max/Min
The max/min method computes a trailing maximum and a trailing minimum for the current day/month. The sentiment is determined by the price position relative to the average between the obtained maximum/minimum, with a bullish sentiment being determined if price is above the average.
