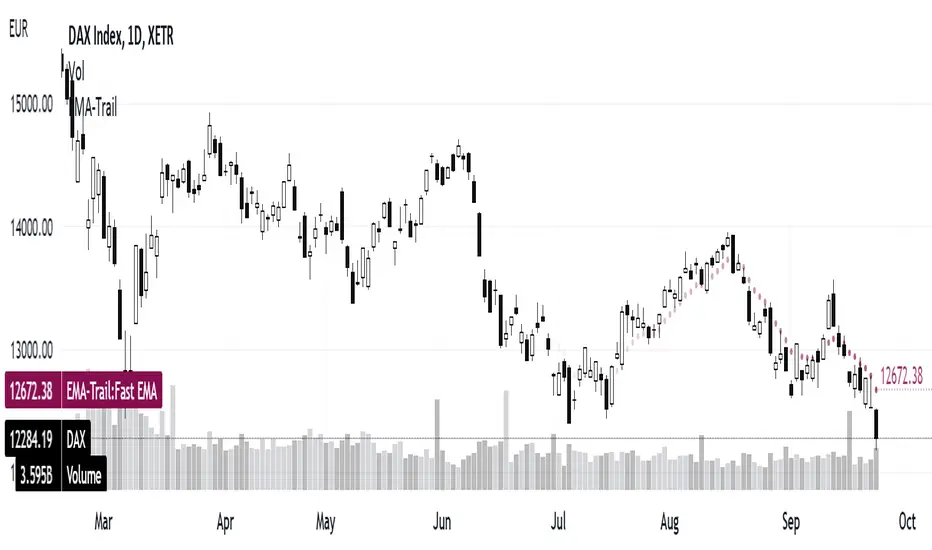
3 EMAs: Daily fixed and custom timeframe (cajole)Simply adds 3 exponential moving averages (EMAs) to the chart. Two are fixed to the daily scale (e.g., 200 and 50 days) and one adjusts to the chart's scale (e.g. 8 bars).
To use the 8-EMA as a trail stop, you can enable labels on the plot or on the price axis.
在腳本中搜尋"daily"
Average Daily Range Lines + VWAP by TenozenOANDA:EURUSD
Hello! I created an indicator called ADRL (Average Daily Range Lines). This is my first original work, and I hope it's helpful to you guys.
1. Let me explain a bit of how it works...
So first of I need the ADR value, as by default length I use 19 for it. I want this indicator to calculate every start of the new day and break if another new day starts, so if the target level isn't reached, then the value would start to go back to 0 and get the new target level of the day. The target level is based on the first ADR multiplied by how much "percent" we want for the target level to hit, based on the first ADR value of the day. When the new day starts, the algo would start to add up the ADR value. If the added ADR hits the target level, it starts to plot a line by the candlestick by its high, low, and mid-level; it would create a new line if there is a new target being hit. So that's it.
About the VWAP, I took Tradingview's VWAP. I added the anchored part so I can plot a line if there is a new target level being hit. I hope that's okay.
2. How to use it...
- Using this indicator is pretty easy. When a new box is being plotted, that means that's the time when you should trade, as the box is still fresh. The VWAP helps if the market is trending or not.
- You can treat this indicator just like an S&R, as the price tends to respect the box. So best to use it as a pullback trade.
- We can assume if the price above the box, is a buy; vice versa.
3. Best Market to use...
- I suggest a trade in a nonvolatile market. The more volatile the market is, the harder the box is to be respected by the price. But if you really want to trade in that market, I suggest adjusting the inputs by how the box is being respected.
4. Suggestions...
- Use this indicator in 5 minutes chart if you day trade.
- Try using 30 minutes and setting the percent input from 100 to 80 and changing the ADR length from 19 to 14, this is much more suitable if you tend to hold trades.

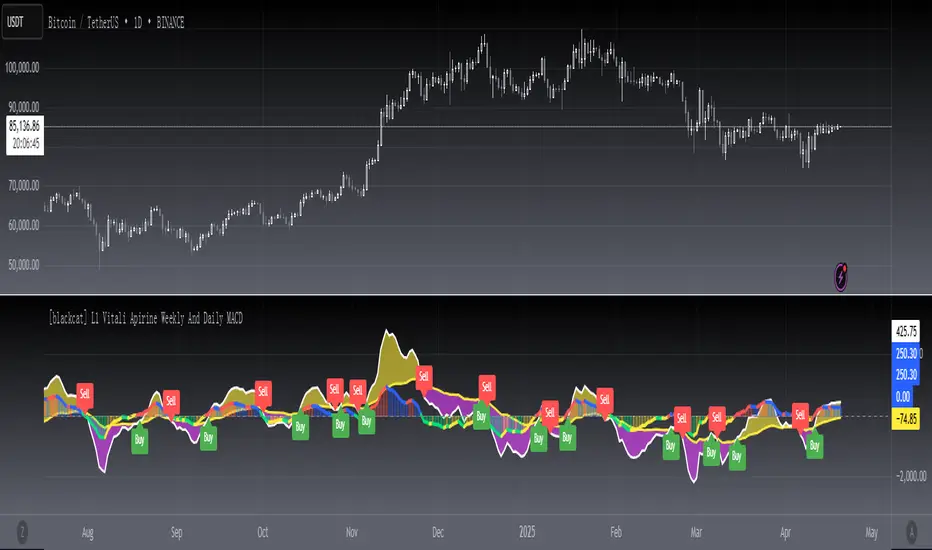
[blackcat] L1 Vitali Apirine Weekly And Daily MACDLevel 1
Background
This indicator was originally formulated by Vitali Apirine for TASC - December 2017 Traders Tips, “Weekly & Daily MACD”.
Function
In the article “Weekly & Daily MACD” in this issue, author Vitali Apirine introduces a novel approach to using the classic MACD indicator in a way that simulates calculations based on different timeframes while using just a daily-interval chart. He describes a number of ways to use this new indicator that allows traders to adapt it to differing markets and conditions.
Remarks
Feedbacks are appreciated.
MTF VWAP & StDev BandsMulti Timeframe Volume Weighted Average Price with Standard Deviation Bands
I used the script "Koalafied VWAP D/W/M/Q/Y" by Koalafied_3 and made some changes, such as adding more standard deviation bands.
The script can display the daily, weekly, monthly, quarterly and yearly VWAP.
Standard deviation bands values can be changed (default values are 0.618, 1, 1.618, 2, 2.618, 3).
Also the previous standard deviation bands can be displayed.

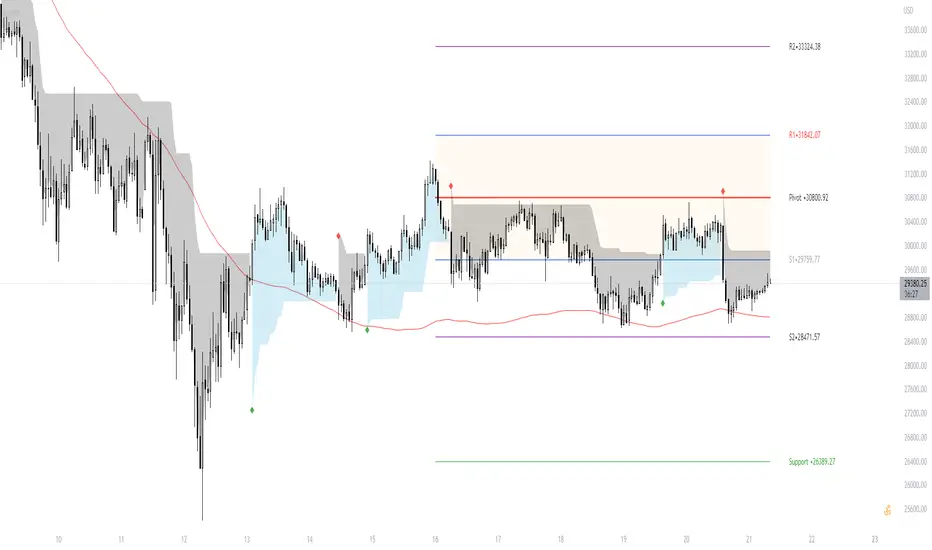
Average Daily Range (ADR) (Multi Timeframe, Multi Period)Average Daily Range (ADR)
(Multi Timeframe, Multi Period, Extended Levels)
Tips
• Narrow Zones are an indication of breakouts. It can be a very tight range as well.
• Wider Zones can be Sideways or Volatile.
What is this Indicator?
• This is Average Daily Range (ADR) Zones or Pivots.
• This have Multi Timeframe, Multi Period (Up to 3 Levels) and Extended Target Levels.
Advantages of this Indicator
• This is a Leading indicator, not Dynamic or Repaint.
• Helps to identify the reversal points.
• The levels are more accurate and not like the old formulas.
• Can practically follow the Buy Low and Sell High principle.
• Helps to keep minimum Stop Loss.
Who to use?
• Highly beneficial for Day Traders
• It can be used for Swing and Positions as well.
What timeframe to use?
• Any timeframe.
When to use?
• Any market conditions.
How to use?
Entry
• Long entry when the Price reach at or closer to the Green Support zone.
• Long entry when the Price retrace to the Red Resistance zone.
• Short entry when the Price reach at or closer to the Red Resistance zone.
• Short entry when the Price retrace to the Green Support zone.
• Long or Short at the Pivot line.
Exit
• Use past ADR levels as targets.
• Or use the Target levels in the indicator for breakouts.
• Use the Pivot line as target.
• Use Support or Resistance Zones as targets in reversal method.
What are the Lines?
Gray Line:
• It the day Open or can be considered as Pivot.
Red & Green ADR Zones:
• Red Zone is Resistance.
• Green Zone is Support.
• Mostly price can reverse from this Zones.
• Multiple Red and Green Lines forms a Zone.
• These lines are average levels of past days which helps to figure out the maximum and minimum price range that can be moved in that day.
• The default number of days are 5, 7 and 14. This can be customized.
Red & Green Target Lines:
• These are Target levels.
What are the Labels?
• First Number: Price of that level.
• Numbers in (): Percentage change and Change of price from LTP (Last Traded Price) to that Level.
General Tips
• It is good if Stock trend is same as that of the Index trend.
• Lots of indicators creates lots of confusion.
• Keep the chart simple and clean.
• Buy Low and Sell High.
• Master averages or 50%.

Qullamaggie Daily with ADR% and Compression RangeQullamaggie Daily
This Indicator is a Combination of Moving Averages (Simple and Exponential) as definied from Qullamaggie and used in his TC2000 Setup
Moving Averages:
- The Moving Averages are Guidelines for the current Trend and are not decive for the Entry
- They shall be a quick view and visual assistance to find strong momentum stock that are currently in a Phase of a "Flag Pattern"
ADR% 20 Day:
- Average Daily Range in % should indicate the Momentum of the Stock. It is similar but still works different as the Volalitily indicators.
- A stock is recommend to a have a ADR% above 5-6 to be considered a Momentum Leading Stock.
Consolidation Range:
- This Indicator should help to define Ranges in which the Volumen get compressed(increase) while the price movement is minimal
- A strong breakout is to be expected. The Range should be easier to be identified with this indication.

[blackcat] L2 Vitali Apirine Weekly & Daily StochasticsLevel 2
Background
Vitali Apirine’s articles in the Sep issues on 2018,“Weekly & Daily Stochastics”
Function
In “Weekly & Daily Stochastics” in this issue, author Vitali Apirine introduces a novel approach to using the classic stochastic indicator in a way that simulates calculations based on different timeframes while using just a daily interval chart. He describes a number of ways to use this new indicator that allows traders to detect the state of longer-term trends while looking for entry points and reversals. Here, I am providing the TradingView pine code for an indicator based on the author’s ideas.
Remarks
Feedbacks are appreciated.

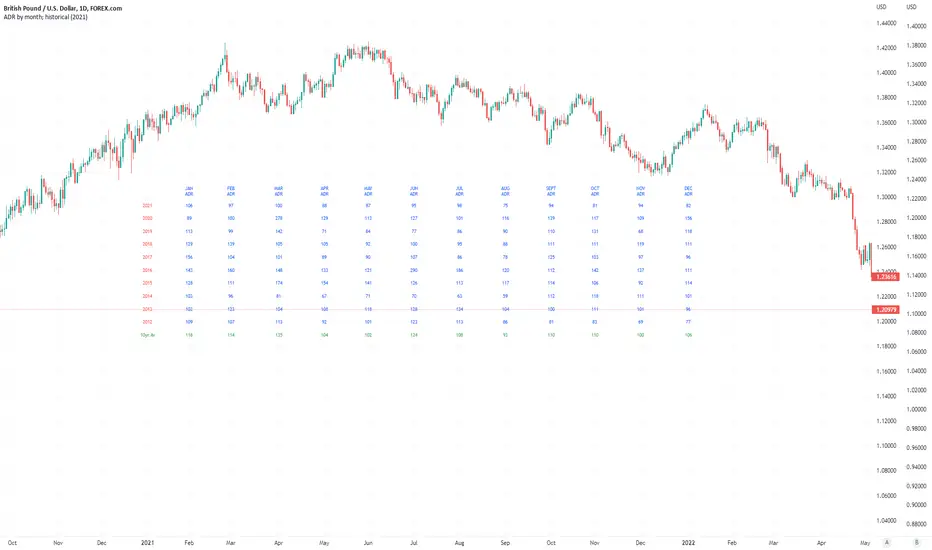
Average Daily Pip Ranges by monthShows historical average daily pip ranges for specific months for FOREX pairs
useful for guaging typical seasonal volatility; or rough expected daily pip ranges for different months
works on both DXY and foreign currencies
option to plot 10yrs worth of data; with 10yr average of the average daily range for specific months
cast back to any previous 10yrs of your choosing
@twingall
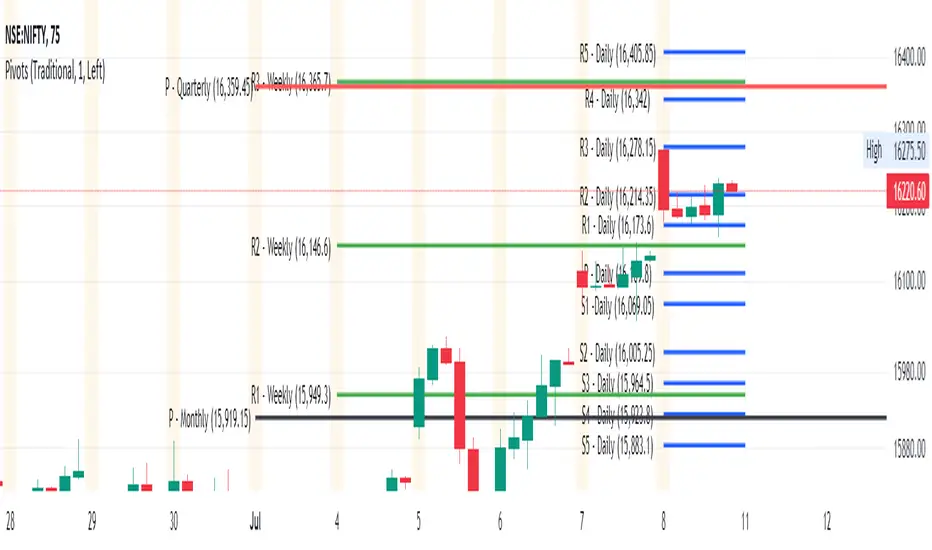
Pivot Points Standard M, W, D (Monthly, Weekly & Daily)This script is based on Pivot Point Standard and is intended for educational purposes only.
"Pivot points are a technical indicator that is used to determine the levels at which price may face support or resistance.
Pivot Points indicator consists of a Pivot (P) level, several support (S) and several resistance (R)."
You can view the Daily timeframe - support/resistance.
You can view the Weekly timeframe - support/resistance.
You can view the Monthly timeframe - support/resistance.
Options to choose "Traditional" or "Fibonacci" or "Woodie" or "Classic" or "DM" or "Camarilla"
Options to choose historical pivots (Number of Pivots Back)
This tool can be handy in any trading process from short-long term trades or timeframes, multiple timeframe analysis, trend trades, swing trades, position trades, and momentum trades.
Credits
Credits to TradingView for original built-in source code
Artharjan Volume AnalysisHi,
I have created Artharjan Volume Analysis indicator dashboard which gives following information about the volume to the traders.
It has two rows. The first row containing volume information is for the Daily Timeframe and the second row containing volume information for any other timeframe of your choice (Basically Chart timeframe)
It gives following information about volume to the traders.
1] Current Volume in Lakhs (Not in Millions) since this script was made keeping in mind Volumes of the Scripts traded in Indian Stock Exchanges. 1 Lakh = 1,00,000
2] Change from its previous Volume. If the change is positive it will be highlighted in Green else in Red.
3] 25 period SMA of the Volume (This period is a Long Term Moving Average and its a customizable parameter which can be changed in Indicator Settings)
4] Current Volume as a percentage of Long term SMA( Volume). If the percentage is positive it will be highlighted in Green else in Red.
5] High Volume during the Lookback period
6] Low Volume during the Lookback period
7] Is current Volume equal to Min Level or Max Level? Or its between Min Max Levels.
8] Is the current Volume rising over past 5 candles or is it falling over past 5 candles or its Swinging? (Short Term Period which is a customizable parameter and it can be changed in the Indicator Settings)
9] Current Volume as a percentage of Short term SMA( Volume). If the percentage is positive it will be highlighted in Green else in Red.
The 1st row will be shown only when the Chart Timeframe is a Daily Timeframe.
The 1st and the 2nd row will be shown only when the Chart Timeframe is not a Daily Timeframe.
With this information regarding volume, traders can identify whether the current volume is at its Highest Levels or at its Lowest Levels, can identify whether volume is rising or volume is falling in accordance to the price action and then take trading decisions.
I hope you would enjoy using this indicator in your day to day trading journey.
Regards
Rahul Desai
@Artharjan.

Monthly Returns: Daily timeframeUse This indicator on the daily timeframe
The 30-day rolling returns can be used to gauge market strength and assess over/underheated price action.
Values between 0% and -30% are typical negative returns during consolidation periods of relatively low volatility.
Values below -50% often occur at cyclical bottoms, and may represent value buying areas.
Values over 50% represent de-risking zones and are often met with profit-taking.
Values over 70% are historically high and represent a high potential for a macro reversal.
This indicator is also used to detect local top and local battom
Coined By
Permabull Niño

ATR Daily Drift %This script is an especial request from a user
Plots the percent change between:
- ATR(daily) from yesterday
and
- open from today - actual price
Due to Tradingview limitations, only shows the plot if the actual timeframe of the graphic is daily or lower.
All my published scripts at: es.tradingview.com

[TT] Daily Levels
These pivots are based on calculations that i have been using for quite some time. I'm sure There is no need to explain on how to use pivots.
Labels are given to understand and you can Msg me here or comment if u need any explanation.
I have given few examples below.. check i t out
XAUUSD
BTCUSD
Nifty
Banknifty
Day/Week/Month/3M/6M/12M MTF breaks by makuchakuThis indicator plots breaks for multiple timeframes. Works on Daily to Yearly timeframes.
Currently supported timeframes :
Daily
Weekly
Monthly
Quarterly
Half Yearly
Yearly
It currently plots all breaks together. From Indicator settings hide what you don't need and save as default settings.

Naked Bar Upward ReversalAMEX:SPY
The Naked Bar Upward Reversal is a three bar candlestick pattern with an inside candle as a entry point. This pattern is bullish since it has a candle closing red from the previous candle; the most bearish pattern possible. The following inside candle is a reversal of its previous candle with an open above the previous candle's close. Look to buy the next open above the inside candle's close.
This is a bullish reversal pattern and should be used in this context. Successful entries are found in corrections along an upward trend, or buying into a dip. Performance drops when the pattern appears at tops. To improve profitability, use a cluster of evidence to enhance the performance of this pattern. The intended time frame is within the daily and weekly.

Average Daily Range x 3 by SergeIndicator plots 3 sets of daily extremes based on Average Daily Ranges, to identify probable intraday reversal areas.
The following can be changed in Settings for fine-tuning:
Look-back days for ADR calculation. By default they are set to 5, 7, and 14 days.
Method of calculation of average. Simple by default, but can be changed to Exponential (tick the 'EMA' checkbox).
Please note that this indicator is used for intraday trading only.

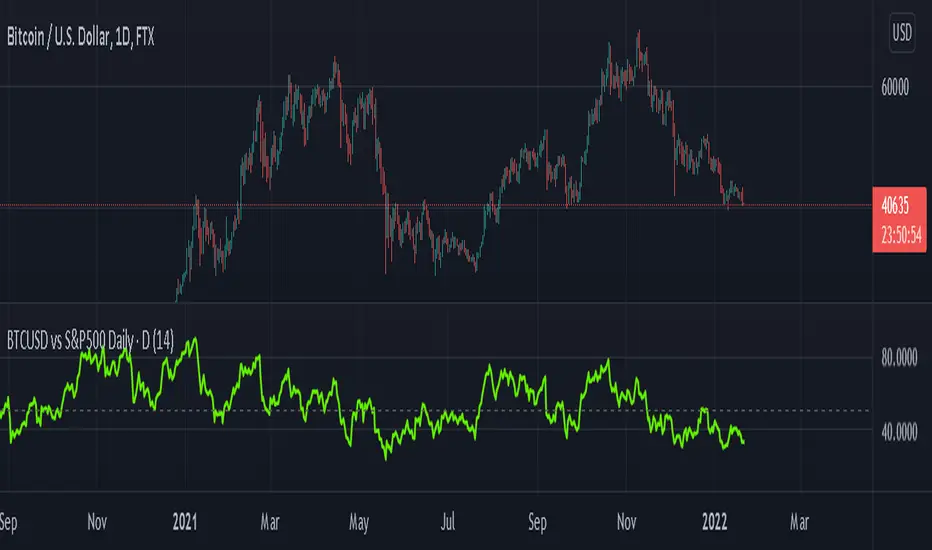
BTCUSD vs S&P500 (Daily)This script plots an RSI of the difference between the BTCUSD (FTX) and S&P 500 (FRED) prices, useful to see how the BTCUSD price correlates to the stock market.
This works in the daily timeframe only (because the S&P 500 can only be sampled on this timeframe). You can try lower timeframes but they will be gapped / interpolated.
Key Levels (Time Frames - Weekly,Monthly,Quarterly,Yearly)This indicator plots the 4h, Daily, Weekly, Monthly, Quarterly, Yearly Open High, Low and Mids.
You can watch how these institutional trading levels work as support and resistance.
Most Important you can add alerts to these levels with a few clicks.
Just add/remove unnecessary levels for scaling problems.
For any error/suggestion/improvement just let me know.

Simple Daily Weekly Monthly YearlySimple price line of the previous daily, weekly, monthly, and yearly opens and closes.
By default your will get the open and close of the last period of the time frame. If you're in March, you will get the open and close of Febraury. If it is calendary day 20, you will get the open and close of day 19 (or previous market day).
Script can be modified to see the most recent opens and closes by switching the period on a desired time range to 0. This will make so that if you're in March, you will get the open of March and it's most recent close price even if the month isn't over.
Colors can be changed to your liking via the settings for the indicator.
To show the price labels on your y-axis, go to Main Chart Settings -> Scales -> "Last Value Indicator Label" and click the checkbox. Also, might be helpful to check the "Indicator Name Label" under the same settings.
The line plots need to be completely transparent, otherwise they will show up and crowd the price chart.

ATR vs Daily DeltaThis indicator follows the idea of the average true range indicator, but splits red candles from green candles. It also displays daily deltas as a histogram chart. Finally, it allows you to "normalize" the indicator, which displays period percentage moves (shown in decimal form) instead of period deltas, and calculates the ATR from those percentages instead of period deltas.

Imbalance, ADR Daily Target & ADR > 3X1 x ADR Movement Calculated on the Asian Session - Times can be altered to suit your parameters
Daily Target is set High from low of Asian Range and Low from High of Asian Range
0-3X ADR Calculated and Displayed from a point you select for the following days targets - can be set Bearish or Bullish and ADR parameters can be altered
Imbalance Finder - Can be switched on or off to show imbalance on current time frame - default is off

ADR: Average Daily RangeVery basic script... adjust the EMA to 13 for stocks, and less volatile assets. 26 for crypto, and anything highly volatile.
When the Daily Low line (bottom yellow/orange line) dips hard, and finds support for 3+ bars somewhere, this is a sign of a trend reversal. For a solid confirmation, wait for the Super Average and EMA to spike downwards as well. All of this can also be seen as reversal at the top of a trend, just upturned.
The 2 Daily lines (2 yellow/orange lines) act as support for the price to bounce off of. Fine tuning is required to get these really smooth, but it's a simple enough idea.
Edit: Screwed up the EMA in my posted example. Should be 26.

Average Daily RangeRe-Re-upload!
There are a handful of decent Average Daily Range indicators out there.
Often they are built using Pinescript v2 (severely outdated) or have no customization or are "Closed Source"
In this version, you can select two multipliers to display on chart
Primary Mult - Large Green or Red crosses, by default set to 1 or 100% of ADR
Secondary Mult - Small Aqua or Maroon crosses, by default set to 0.5 or 50% of ADR
Cheers,
EFX
