Daily Range AnalysisThis indicator helps quickly identify if a stock is making a "price expansion" or a "price contraction". If today's range is larger than yesterday, then the stock is having a price expansion. This will be represented with a positive number. If today's range is smaller, the stock is making a contraction, and the indicator will display a negative number.
Indicator Features:
1. **Dark and Light Themes**: Users can choose between dark and light themes based on their preference. Dark themes are easier on the eyes in low-light conditions, reducing eye strain, while light themes are more suitable for well-lit environments.
2. **Customizable Text Colors**: Users can customize the text color for each data element displayed in the table. Customization allows users to tailor the appearance of the indicator to their liking and enhance readability.
3. **Show/Hide Data Options**: Users have the flexibility to show or hide each data element in the table individually. This feature enables users to focus on specific information they find most relevant, decluttering the chart and improving readability.
4. **Daily Range Analysis**: The script calculates and displays important metrics related to the daily price range of a financial instrument. These metrics include:
- Closing Range: Percentage indicating how close the closing price is to the daily low relative to the daily range. Helps traders assess where the closing price lies within the day's price action.
- Range Expansion: Percentage indicating the change in the daily price range compared to the previous day. Useful for identifying potential volatility shifts and trend continuation or reversal.
- StopH: Price level representing the midpoint between the day's open and close, commonly used as a reference for setting stop-loss orders.
- StopL: The low of the day, providing information about the lowest price reached during the trading session. Some traders like to use the Low of Day as a Stop Loss.
Overall, this script provides traders with essential insights into daily price movements, enabling them to make more informed trading decisions based on key price action metrics. The customization options enhance user experience and adaptability, catering to individual preferences and trading styles
在腳本中搜尋"daily"

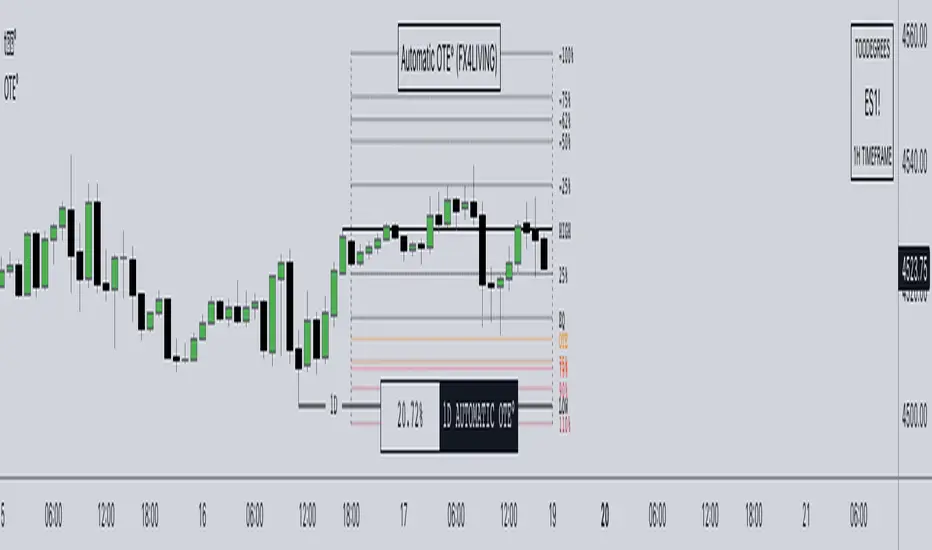
Daily Automatic OTE (FX4LIVING)Description:
The Daily Automatic OTE is the Free version of the Automatic OTE (FX4_LIVING) . Unlock the Daily OTE with this advanced indicator, simplifying the intricate world of Daily Fibonacci retracements.
In collaboration with FX4_LIVING, key levels are thoughtfully grouped for enhanced ease and organization. These include the High, Low, Equilibrium (EQ), and the Optimal Trade Entry (OTE).
Optimal Trade Entry is a concept taught by the Inner Circle Trader utilizing fibonacci retracements to gauge when price is considered in Premium or Discount. When price reaches 62% retracement of the anchored swings, price enters an area considered for an optimal trade entry.
This said, these levels can act as much more than a simple retracement tool, showing continuous levels that price refers back to based on Premium and Discount prices of the previous interval.
CME_MINI:NQ1! Price trading from Premium to Discount, landing at OTE at the end of the Day:
... another CME_MINI:NQ1! example, the following Day:
This tool provides with default levels aligned to FX4_LIVING's Trading Models. The integrated data table offers a distilled view of price action, enabling easy tracking where price is trading compared to the previous Day in percentage – where the High and the Low represent Previous Daily High and Previous Daily Low interchangeably. This feature allows you to quickly know where price is, even if you decide to hide the Fibonacci Levels.
Key Features:
Versatility Across Assets: Daily Automatic OTE is meticulously designed for futures, forex, and bond markets, offering a comprehensive solution for a wide range of financial instruments.
Adaptive Table Colors: witness the data table adapt its colors when price approaches OTE levels, aligning seamlessly with Fibonacci levels.
Other Features:
Customize Fibonacci and Key Level Line Style.
Personalize Fibonacci and Key Level Line Color.
Adjust Fibonacci and Key Level Line Width.
Tailor Table Size and Location.
Usage Guidance:
Add Daily Automatic OTE to your Tradingview chart.
Observe where and when Fibonacci Levels are traded. Leverage this invaluable information to shape your narrative, whether you choose to explore internal range liquidity or capitalize on post-purge reversals.
Customize your desired Timeframe and Fibonacci Levels according to your preferences.
These tools are available ONLY on the TradingView platform.
Daily TrendDescription:
The "Daily Trend" script is a powerful technical analysis tool designed for TradingView. This indicator helps traders identify key support and resistance levels based on daily price data. It offers a visual representation of these levels, along with other technical indicators like Exponential Moving Averages (EMA), Supertrend, and Parabolic SAR.
Features:
Past Candle Price Levels: This script calculates and displays past daily candle price levels, including R1, R2, R3, R4, S1, S2, S3, and S4. These levels are vital for identifying potential reversals and breakout points.
Exponential Moving Average (EMA): The script includes an EMA indicator with a customizable period to help traders spot the trend direction and potential crossovers.
Supertrend Indicator: The Supertrend indicator is used to identify trend changes. It plots the Supertrend line and highlights the trend direction with color-coded regions.
Parabolic SAR: The Parabolic SAR indicator is integrated into the script to assist traders in identifying potential entry and exit points in the market.
Customizable Alerts: Traders can customize the indicator by choosing which past candle price levels and other features to display on the chart.
How to Use:
Apply the "Daily Trend" script to your TradingView chart.
Customize the indicator by enabling or disabling specific features, such as past candle price levels and EMA.
Pay attention to the color-coded regions for Supertrend and Parabolic SAR to determine the current trend direction.
Look for potential reversal or bounce signals based on the indicator's signals and the price action.
Consider using this script in conjunction with your trading strategy for enhanced technical analysis.
Risk Warning: Trading involves significant risk, and past performance is not indicative of future results. Always practice proper risk management and consider the broader context of the market before making trading decisions.

Daily Pivots with Fakeout Protection█ OVERVIEW
The "Daily Pivots with Fakeout Protection" indicator is a powerful tool designed to help traders identify potential price breakouts and pivot levels on daily charts. This indicator calculates and displays daily pivot points along with breakout lines that are adjusted to provide a certain level of protection against fakeouts, which are false price movements that can mislead traders.
█ FEATURES
• Pivot Timeframe Selection: You can choose the timeframe for the pivot calculations. The default is set to daily (D), but you have the flexibility to select other timeframes as well.
• Fakeout Protection: A percentage-based parameter allows you to define the amount of protection you want against fakeouts. This helps filter out potentially unreliable breakouts.
• Bullish and Bearish Signals: The indicator distinguishes between bullish and bearish conditions by comparing the closing price to the daily high and low.
• Breakout Signals: Triangular symbols (upward and downward) appear below and above bars to signal potential breakout points. These are based on the closing price crossing the adjusted breakout lines.
• Visual Representation: Pivot points, daily high, and daily low are plotted on the chart, with distinctive line styles and colors for easy identification.
• Background Highlighting: The background color of the chart changes when a new period begins, helping you quickly recognize the start of a new trading day.
• Color-Coded Zones: The indicator colors the background around the closing price differently based on whether the market is bullish (green) or bearish (red).
█ HOW TO USE
1 — Apply the "Daily Pivots with Fakeout Protection" indicator to your TradingView chart.
2 — Customize the parameters like pivot timeframe and fakeout protection percentage according to your trading preferences.
3 — Watch for the triangular breakout symbols that appear above and below bars, indicating potential breakout points.
4 — Keep an eye on the pivot points, daily high, and daily low lines to understand price levels relevant to the current trading day.
5 — Use the background color changes to quickly identify the beginning of a new trading day and any potential shifts in market sentiment.
Note:
• This indicator is designed for daily charts but can be adjusted to work with other timeframes as well.
• Be cautious of relying solely on breakout signals; consider using additional technical and fundamental analysis for confirmation.
Start integrating the "Daily Pivots with Fakeout Protection" indicator into your trading strategy to enhance your ability to identify breakouts and pivot levels more effectively.

Daily Range Support & Resistance Levels [QuantVue]The Daily Range Support & Resistance Levels is an advanced analytical tool designed to assess daily price movements and provide potential support and resistance levels.
This tool examines the average daily price fluctuations over the past 150 trading days, and creates support and resistance levels based on the opening price.
The indicator also considers a standard deviation multiplier.
This enables traders and investors to identify potential price zones.
The support and resistance levels are dynamically updated every day.
Users can also choose to view previous daily levels as well.
Customizable settings for this tool include:
-Averaging Period: Adjust the number of days to calculate the average daily range.
-Standard Deviation Multiplier: Modify the standard deviation multiplier to fine-tune the sensitivity of the support and resistance levels. A higher multiplier will result in wider levels, accommodating higher price fluctuations.
-Toggle Support & Resistance Prices: Easily switch on or off the display of support and resistance price levels.
-Show Daily Open Line: Display the daily opening price as a reference point on the chart.
-Show Previous Levels: Choose whether to display past daily support and resistance levels.
Note: this indicator works best on 5 or 15 minute charts.
Give this indicator a BOOST and COMMENT your thoughts!
We hope you enjoy.
Cheers.

Daily SPY PlanThe Daily SPY Plan indicator is a technical analysis tool designed to provide traders with a visual representation of price levels and take profit points for the SPY (S&P 500 ETF) on a daily timeframe. This indicator utilizes the Average True Range (ATR) to calculate projected price levels and take profit points, aiding traders in identifying potential breakout and profit-taking opportunities.
Indicator Description:
The indicator is written in Pine Script, specifically for use on the TradingView platform. It plots several levels on the price chart, each representing a potential breakout or take profit point. The levels are determined based on a fraction of the ATR added or subtracted from the closing price. The fractions used are 0.25, 0.5, 0.75, 1.0, 1.25, and 1.5 times the ATR.
The indicator distinguishes between breakout levels and take profit levels using different colors. Breakout levels, which indicate potential entry or exit points, are displayed in green, while take profit levels are shown in gray.
Key Features and Use:
ATR Calculation: The indicator calculates the Average True Range (ATR) using a specified length (default value of 14). ATR is a measure of market volatility and represents the average range between the high and low prices over a specific period.
Projected Price Levels: The indicator plots several projected price levels above and below the closing price. These levels are calculated by adding or subtracting a fraction of the ATR from the closing price. Traders can use these levels as potential breakout points or areas to set stop-loss orders.
Take Profit Points: The indicator also plots take profit points at specific levels above and below the closing price. These levels are designed to help traders identify potential areas to secure profits or partially exit their positions.
Visual Representation: The indicator utilizes step-like lines to plot the projected price levels and take profit points, providing a clear visual representation on the price chart. Traders can easily identify the relevant levels and incorporate them into their trading strategies.
Customizability: The indicator allows traders to customize the ATR length and choose whether to display Fibonacci levels (although there are no Fibonacci calculations in the provided code). These customization options enable traders to adapt the indicator to their preferred trading style and timeframe.
Limitations and Considerations:
Complementary Analysis: The Daily SPY Plan indicator should be used as a complementary tool alongside other technical analysis techniques and indicators. It provides price levels and take profit points based on ATR calculations, but it doesn't incorporate additional market factors or trading strategies.
Timeframe Suitability: The indicator is specifically designed for the daily timeframe of the SPY. Traders should consider adjusting the parameters and adapting the indicator if using it on different timeframes or instruments.
Risk Management: While the indicator suggests potential breakout and take profit points, it does not provide explicit stop-loss levels or risk management parameters. Traders should incorporate appropriate risk management techniques to protect their capital.
Conclusion:
The Daily SPY Plan indicator is a valuable technical analysis tool for traders focusing on the SPY ETF and the daily timeframe. By utilizing the ATR, it helps traders identify potential breakout levels and take profit points. However, traders should remember that this indicator is just one piece of the puzzle and should be used in conjunction with other technical analysis tools and risk management strategies to make informed trading decisions.

Daily/Weekly ExtremesBACKGROUND
This indicator calculates the daily and weekly +-1 standard deviation of the S&P 500 based on 2 methodologies:
1. VIX - Using the market's expectation of forward volatility, one can calculate the daily expectation by dividing the VIX by the square root of 252 (the number of trading days in a year) - also know as the "rule of 16." Similarly, dividing by the square root of 50 will give you the weekly expected range based on the VIX.
2. ATR - We also provide expected weekly and daily ranges based on 5 day/week ATR.
HOW TO USE
- This indicator only has 1 option in the settings: choosing the ATR (default) or the VIX to plot the +-1 standard deviation range.
- This indicator WILL ONLY display these ranges if you are looking at the SPX or ES futures. The ranges will not be displayed if you are looking at any other symbols
- The boundaries displayed on the chart should not be used on their own as bounce/reject levels. They are simply to provide a frame of reference as to where price is trading with respect to the market's implied expectations. It can be used as an indicator to look for signs of reversals on the tape.
- Daily and Weekly extremes are plotted on all time frames (even on lower time frames).

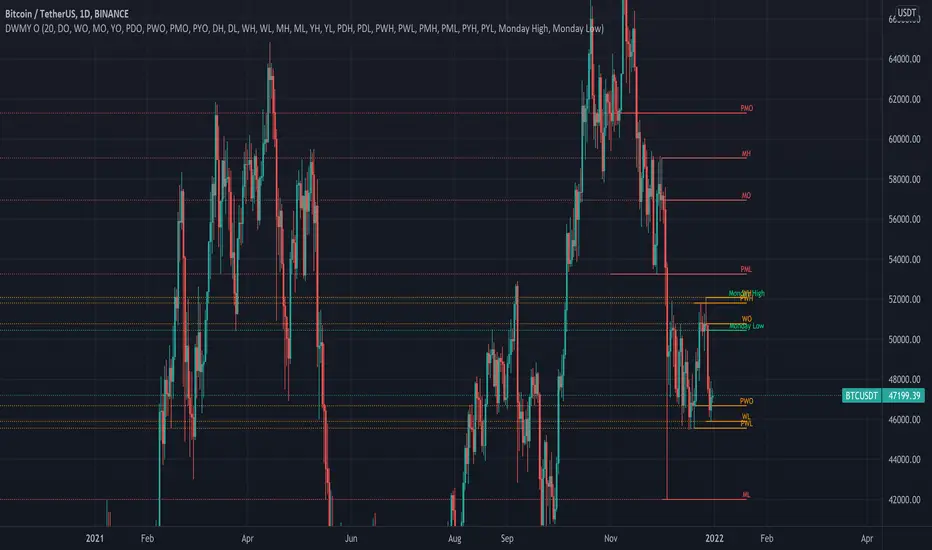
Daily Weekly Monthly Yearly OpensThis indicator draws key level lines such as daily open, weekly open, monthly open, yearly open, previous daily open, previous weekly open, previous monthly open, previous yearly open, monday daily high and monday daily low to chart. This lines can act either support or resistance but it is just possibility. This lines will help you to find buy and sell places.
Financial Astrology Indexes ML Daily TrendDaily trend indicator based on financial astrology cycles detected with advanced machine learning techniques for some of the most important market indexes: DJI, UK100, SPX, IBC, IXIC, NI225, BANKNIFTY, NIFTY and GLD fund (not index) for Gold predictions. The daily price trend is forecasted through planets cycles (angular aspects, speed phases, declination zone), fast cycles are based on Moon, Mercury, Venus and Sun and Mid term cycles are based on Mars, Vesta and Ceres . The combination of all this cycles produce a daily price trend prediction that is encoded into a PineScript array using binary format "0 or 1" that represent sell and buy signals respectively. The indicator provides signals since 2021-01-01 to 2022-12-31, the past months signals purpose is to support backtesting of the indicator combined with other technical indicator entries like MAs, RSI or Stochastic . For future predictions besides 2022 a machine learning models re-train phase will be required.
When the signal moving average is increasing from 0 to 1 indicates an increase of buy force, when is decreasing from 1 to 0 indicates an increase in sell force, finally, when is sideways around the 0.4-0.6 area predicts a period of buy/sell forces equilibrium, traders indecision which result in a price congestion within a narrow price range.
We also have published same indicator for Crypto-Currencies research portfolio:
DISCLAIMER: This indicator is experimental and don’t provide financial or investment advice, the main purpose is to demonstrate the predictive power of financial astrology. Any allocation of funds following the documented machine learning model prediction is a high-risk endeavour and it’s the users responsibility to practice healthy risk management according to your situation.

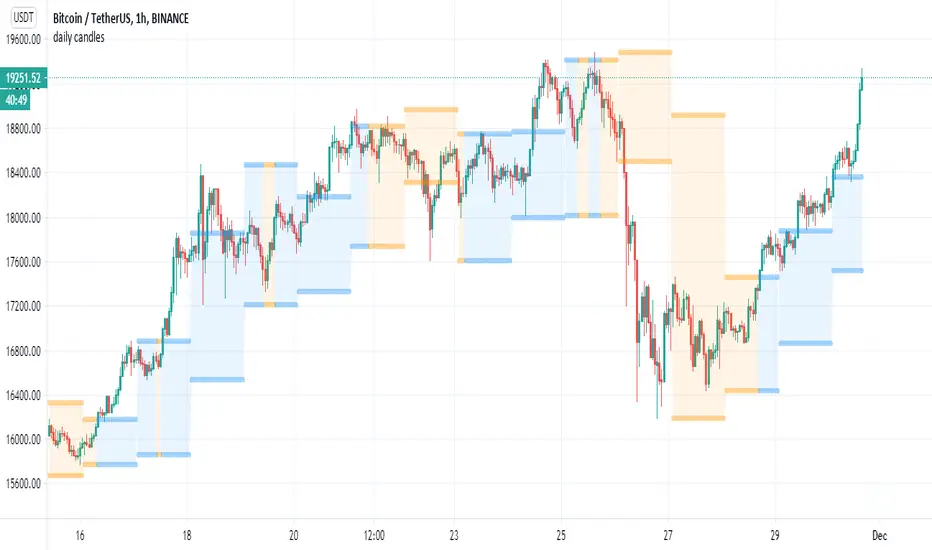
daily candleseasy simple script for using daily non repainted daily candles on lower TF (4 hour or lower)
the color change (bullish=blue) , bearish =orange is made by special indicator that calculate the change of daily no security MTF to current close
so I just put this as template if someone want to use it as helper
the daily candles use security in non repainted mode that suggested by TV coders
so feel free to change this indicator as you wish :)
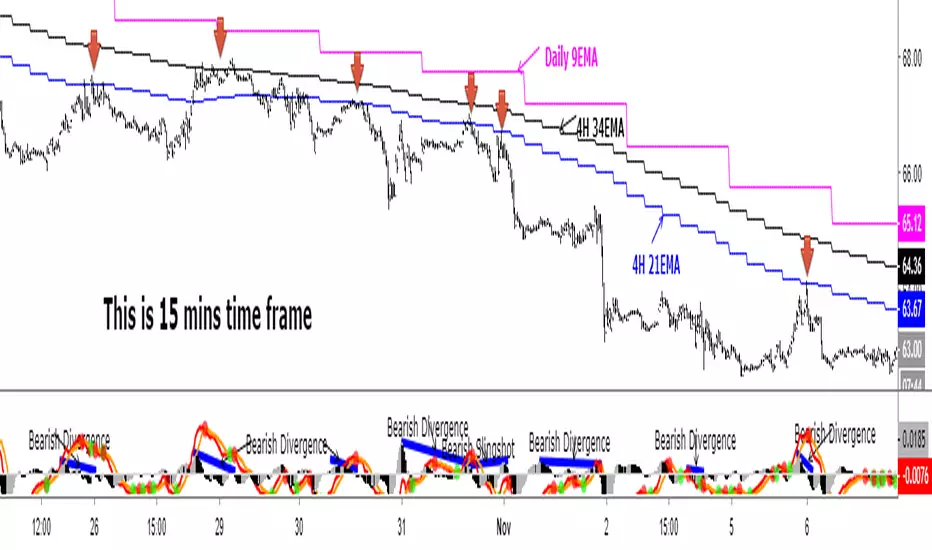
Daily 9 EMA Plotted at Other Than Daily Time Frame
Credit to the great @Zoen Triste for his original script at:
I just amend it for the Daily, 4H and other time frames. The main function of the Daily 9EMA (pink line) is to easily distinguish the big trend. It is also for multi time frames dynamic support / resistance when trading using tf lower than Daily, without having to toggle between the time frames. Everything is there at a single time frame chart. I like to day trade and switch to swing trade when there is a solid setup for it. To be able to do that, I use 15mins tf together with the Daily 9EMA, 4H 34EMA and 4H 21EMA.
How to trade using this setup?
First of all, if price is below the pink line (Daily 9EMA), it means the big trend is downtrend (and vice versa). When price retrace and reach the blue (4H 21EMA) or black (4H 34EMA) or the pink (Daily 9EMA) line (look at the red arrows), if there is bearish divergence / slingshot at the MACD's histogram together with a reversal candle such as pin bar (shooting star), dark cloud cover or bearish engulf, it's a short setup. We don't need to put the Stop Loss immediately. We can wait for the price to resume in the direction of the big trend to trail the SL.
I do add up daily and weekly pivots and trendlines for additional support / resistance for greater confidence. If the above setup occurs at certain pivots and trendline, we'll have a very high probability setup. Please see the zoomed-in chart as below:
When price is above the pink line, the setup is just the opposite.
My conclusion: When day trading using this setup at smaller time frames such as 15mins, we don't have to toggle between 4H and 15min time frames to see where is the EMA21 and EMA34 at 4H for the moment.
It's like we are able to see a microscopic and bird's eye views at the same time using a single time frame chart.
Daily Levels ImporterUser Guide: Daily Levels Importer
What This Indicator Does
This tool allows you to instantly draw multiple support and resistance lines on your TradingView chart by pasting a list of data. It avoids the need to manually draw lines one by one. It also features a dashboard to identify the ticker and filters to toggle specific line colors on or off.
1. The Data Format
The indicator reads text in a specific 3-column format (Comma Separated).
Format: \, \, \
* Ticker: The symbol name (used for the dashboard display).
* Price: The price level where the line will be drawn.
* Color Code:
r = Red
g = Green
y = Yellow
Example:
ES, 4150.25, r
ES, 4200.00, g
ES, 4175.50, y
2. How to Use It
3. Copy Your Data: Select your list of levels (from Excel, a text file, or a website) and copy them to your clipboard.
4. Open Settings: On your TradingView chart, hover over the indicator name and click the Settings (Gear Icon).
5. Paste Data:
* Find the "Paste Data Here" text box in the Inputs tab.
* Delete any existing text.
* Paste your new list.
6. Save: Click OK. The lines will instantly render on your chart.
7. Controls & Filters
You can customize the view without deleting data by using the checkboxes in the Settings menu:
* Line Filters:
* Show Red Levels: Uncheck to hide all red lines.
* Show Green Levels: Uncheck to hide all green lines.
* Show Yellow Levels: Uncheck to hide all yellow lines.
* Dashboard Location:
* Use the dropdowns to move the Ticker ID box to any corner of the screen (e.g., Top Right, Bottom Left) or change its size.
8. Troubleshooting
Lines aren't showing up?
* Ensure the prices match the asset you are viewing (e.g., don't paste SPX prices on an AAPL chart).
* Check if you accidentally unchecked the "Show " box in the settings.
"No Data" in Dashboard?
* The script reads the ticker name from the first row of your pasted data. Ensure the first row is not blank.
Is there a limit?
* Yes. TradingView allows approximately 4,000 characters in the text box. This is roughly 250 lines of price levels. If you need more, add a second instance of the indicator to the chart.

Daily Auto-Fib Zones (Custom Colors)This indicator automatically draws daily Fibonacci-based zones using the current session’s high and low. The levels update dynamically as new price action forms and include optional visual regions for several commonly referenced retracement percentages.
Features include:
• Automatic detection of the daily high and low
• Real-time updates throughout the session
• Optional zones for 0.11–0.17, 0.5, and 0.618–0.786 levels
• Custom color inputs for every line and zone
• Dynamic boxes that expand with the day’s range
• Lightweight visual layout with toggleable components
The tool is intended purely for chart visualization. It does not provide signals or trade recommendations.

Daily Buy Signal – RSI/EMA21
Daily Buy Signal – RSI/EMA21
A simple technical signal that identifies potential daily buy opportunities using RSI and EMA21 alignment.
This script generates a daily buy signal when momentum and trend strength align.
The signal triggers when the price closes above the 21-period EMA and the RSI(14) crosses above the 50 level, or when both the RSI stays above 50 and the price shifts from closing below the EMA21 to closing above it.
A label is plotted below the candle, and the script includes an alert condition so users can receive real-time notifications.

Daily Range Box (RIC) V0.2This update enhances the "Daily Range Box" indicator by adding user-configurable inputs for colors and line styles. Users can now customize the box border color and the midline color independently through dedicated color picker inputs. Additionally, separate dropdown menus allow selection of line styles (Solid, Dashed, or Dotted) for both the box border and the midline, enabling personalized visualization while maintaining the core functionality of drawing daily range boxes with midlines across all timeframes.

Daily High-Low-Open + LabelsSimple PDH/PDL/DO indicator. It is in horizontal line form and it includes labels. So you don't have to place them daily yourself. Updates on its own every single day.

Daily Low < Threshold AND Close > Threshold//@version=5
indicator("Daily Low < Threshold AND Close > Threshold", overlay=true)
// Get 1-month close (no lookahead)
monthlyClose = request.security(syminfo.tickerid, "1M", close, lookahead=barmerge.lookahead_off)
// Compute adjustment and threshold
adjustment = monthlyClose * 12.15 / (100 * math.sqrt(360.0 / 30.0))
threshold = monthlyClose - adjustment
// Conditions
condLow = low < threshold
condClose = close > threshold
signal = condLow and condClose
// Plots
plot(threshold, title="Threshold", color=color.orange, linewidth=2)
plot(low, title="Daily Low", color=color.red, linewidth=1)
plot(close, title="Daily Close", color=color.green, linewidth=1)
// Signal marker
plotshape(signal,
title="Signal",
location=location.belowbar,
style=shape.labelup,
text="OK",
textcolor=color.white,
size=size.tiny,
color=color.green)

Daily Fib Levels Clean (Retrace + Extension)This indicator automatically detects the latest Daily Swing High and Swing Low and plots clean Fibonacci retracement levels based on those swings.
Even if you switch to 4H, 1H, 15m, or 5m, the levels remain locked to the Daily timeframe, giving you consistent higher-timeframe structure on any chart.

Daily Swing High/Low Fibs (Clean v6)This indicator automatically detects the latest Daily Swing High and Swing Low and plots clean Fibonacci retracement levels based on those swings.
Even if you switch to 4H, 1H, 15m, or 5m, the levels remain locked to the Daily timeframe, giving you consistent higher-timeframe structure on any chart.

Daily 20/50/100/200 SMA with Auto-Labeling (Multi-Timeframe)This script plots the four most widely used Simple Moving Averages - 20, 50, 100, and 200-period SMAs from the Daily timeframe - directly onto any chart, regardless of the chart’s timeframe. It provides a clean, easy-to-read visual overlay for traders who rely on higher-timeframe moving averages for trend analysis, support and resistance, or confluence.
To improve clarity, the script automatically places floating labels beside the most recent price bar, identifying each SMA by color and period. These labels stay neatly positioned to the right of the chart and update dynamically without cluttering historical bars.
Features
• Plots Daily SMA-20, SMA-50, SMA-100, SMA-200 on any timeframe
• Clean multicolored lines with consistent formatting
• Automatic right-side labels that identify each moving average
• Labels update only on the latest bar - no chart clutter
• Adjustable label offset for perfect placement
• Ideal for trend traders, swing traders, and timeframe confluence strategies
This indicator keeps your chart clean while giving you instant awareness of key daily moving averages that institutions and technical traders watch closely.

daily median 00:00-14:00 This indicator calculates the daily median price from all candle closes between 22:00 of the previous day and 15:00 of the current day, using the selected European timezone. The median is only computed after the 15:00 candle has closed and is plotted as a single horizontal line for the remainder of the day. Both the 22:00 and 15:00 closes are included in the calculation. The indicator resets at the start of each new day and remains hidden until the session completes, providing a clean, stable daily reference level.

Daily EMA TrendThis show whether price is above or below the set DAILY EMAs that you set. Default is 200, 100, 50 & 20.

DAILY - 3-Condition Arrows - Buy & SellVersion 1.
On the DAILY time frame, this indicator will add a green BUY arrow to a stock price when the following 3 conditions are ALL true:
BUY (all 3 conditions are true)
1. Stock price > 50 EMA
2. MACD line above moving average
3. Williams %R (Best_Solve version) is above moving average
Conversely, a red SELL arrow will point out when the following 3 conditions are ALL true:
SELL (all 3 conditions are true)
1. Stock price < 50 EMA
2. MACD line below moving average
3. Williams %R (Best_Solve version) is below the moving average
