40 DOMINANT ALTCOINS BINANCEThis indicator is a combination of 40 different altcoins which are found on Binance exchange.
I have listed all Binance altcoins in the order of the oldest listed and the newest.
Due to limitations on TV for calling only 40 securities at the same time, I have limited myself with adding only the oldest ones (9+ months) and some 8+ to make up at least 40 for more data.
I have excluded BTC, BCC, ETH, USDT, BNB from list as these are the trading pairs.
I have some updates in mind and will try to add more options in coming months
Regularly updating 40 altcoins list by sorting them by market cap and available historical data from Binance
Adding Bitfinex, Bittrex and other exchanges separetly, as there is only 40 security call limit
Adding ETH; USDT pairs for all above exchanges.
You can add any indicator to this indicator - such as MACD, RSI, EMA and so on to help you analyse it more deeper
When you load this indicator, it takes about 1 min wait as it takes and calculates a lot of data. After it is loaded, it works perfectly.
Currently there is only 40 oldest altcoins to gather enough data, but as time passes, I will change some of them to create better picture of alt coins.
Please report any problems and give feedback.
Any idea of improvement is welcome and I will try my best.
Please support me an consider to give a small tip to addresses bellow. It would greatly help me to free more time for improvements as I am working to support family and my time is limited for markets.
ETH: 0xac290B4A721f5ef75b0971F1102e01E1942A4578
BTC: 39p3rKuJYKGqph1Qs35yEfNWoPvpUJBBcy
This will greatly help me to keep update this indicator and give me more time to analyse and sort out all altcoins my their market cap, volume and influence.
在腳本中搜尋"deep股票代码"

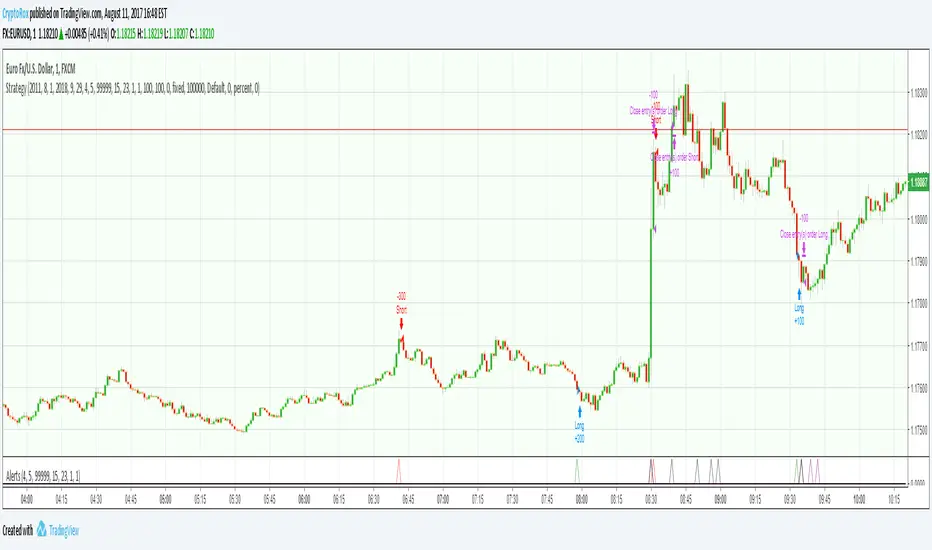
How to automate this strategy for free... Version 2Hello fellow traders and automation lovers.
It has been about 2 years since we originally created Autoview to connect your exchanges/brokers with your TradingView alerts. We've since added multiple exchanges, parameters and have built a large community filled with awesome, passionate traders.
One of the first strategies we built was sadly not a viable one for trading due to it using built-in variables that resulted in the backtest results being inaccurate in comparison to placing live trades. Luckily, we did not encounter repainting until a few strategies in, however, there was a point where we published a few of them as well. We will be going through all of our scripts again to not only eliminate any repainting and update to version 3, but to also include all the code snippets that we've learned to use over the years that allow for accurate backtesting and live trading.
The first script we are redoing is our How to automate this strategy for free using a chrome extension. .
Easter egg: This includes a new snippet of code that makes controlling how many orders you pyramid within a study fast and easy.
We look forward to bringing all of our scripts and delving deep into Pine again :)
Happy Trading
Autoview
Candle CountingI was talking with one of the biggest hedge fund traders in the world the other day. He goes to me, "Brian, why don't you come and work for us, since you're a better trader than anyone at our firm?" Well I said I would, but there's no one there with an iq as high as mine, so I'd have no one to talk to when I'm eatin my sammiches. Man I'm a savant mate, I'm a f***ing CANDLE COUNTER. I tell people all the time, know your market. And that's your tip of the day really, I mean nobody out there knows Yen better than me. I mean the other day I was 70,000 in the hole, but I didn't get out, I was balls deep making a cheese sammich on the George Forman. Now I mean you can try and do what I'm doing, but understand something, I am 100% smarter than you, and your machines. In the industry, they call me Mr. Yen, I touch the sun, and my d*ck, regularly.

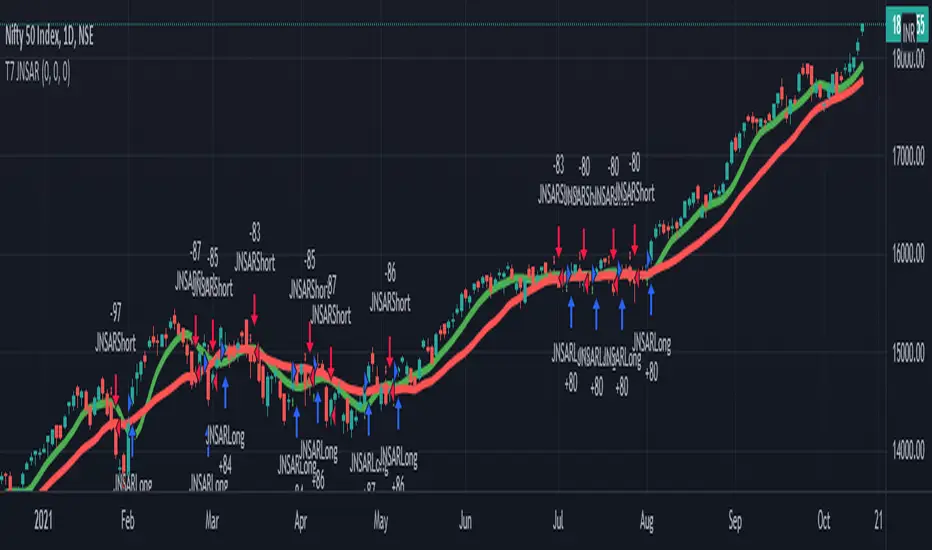
T7 JNSARJNSAR stands for Just Nifty -0.14% Stop & Reverse. This is a Trend Following Daily Bar Trading System for NIFTY -0.14% . Original idea belongs to ILLANGO @ I coded the pine version of this system based on a request from @stocksonfire. Use it at your own risk after validation at your end. Neither me or my company is responsible for any losses you may incur using this system. Hope you like this system and enjoy trading it !!!
Updated V3 code for the T7 JNSAR system earlier published here V2 and here V1
Following updates made to the code
1. Added a 22 Period Simple moving average filter over and above the standard JNSAR value for generating trading signals. This simple filter reduces the whipsaw trades drastically along with similar improvements in the max draw down and overall profitability of the system. The SMA filter is turned ON by default but can be turned OFF by user through the settings window.
2. Backtest option is now turned ON by default.
Also am republishing the trading rules here again with some modification
1. Go Long when the daily close is above the JNSAR line. Go Short when the daily close is below the JNSAR line. JNSAR line is the varying green line overlayed over the price chart. Once a signal comes at market close enter in the direction of the signal @ market price @ next day market open.
2. Trade only Nifty -0.14% Index. This system was developed and backtested only for NIFTY -0.14% Index. So trade in its Futures or Options, as you may deem fit. My recommendation is to choose futures for simplicity. If you want to reduce the trading cost and go with options, trade with deep in the money options, preferably 2 strikes far from the spot price.
3. Trade all signals. Markets trend only 30-35% of the time and hence the system is only accurate to that extend. But system tends to make enough money, in this small trending window, to keep the overall profitability in good health. But one never knows when a big trend may come and when it comes its absolutely imperative that you take it. To ensure that, trade all signals and don't be choosy about what signals you are going to trade. Also I wouldn't recommend using your own analysis to trade this system. Too many drivers will crash the car.
4. Like all trend following systems, this system will have many whipsaws during flat markets along with large trade and account drawdowns. Also some months and even years may not be profitable. But to trade this system profitably, it is necessary to take these in one's stride and keep trading. As the backtester results from 1990 to 2017 proves, this system is profitable overall thus far. Take confidence from that objective fact.
5. Trade with only that amount of money you can afford to loose. Initial capital that you need to have to trade one lot of NIFTY -0.14% should be atleast - (Margin Money required to take and hold 1 lot position + maximum drawdown amount per lot)*1.2. Be prepared to add more if need be, but the above formula will give a rough idea of what you need to have to start trading and be in the game always.
6. Place an After Market Order @ Market Price with your broker after market close so that you get to execute the trade next trading day @ Market open to capture near similar price as the daily open price seen on the chart. This execution mode will give you the best chance to minimize the slippage and mimic the backtester results as closely as practically possible.
7. Follow all the 6 rules above religiously, as if your life depends on it. If you cant, then don't trade this system; You will certainly loose money.
Happy Trading !!! As always am looking out for your valuable feedback.

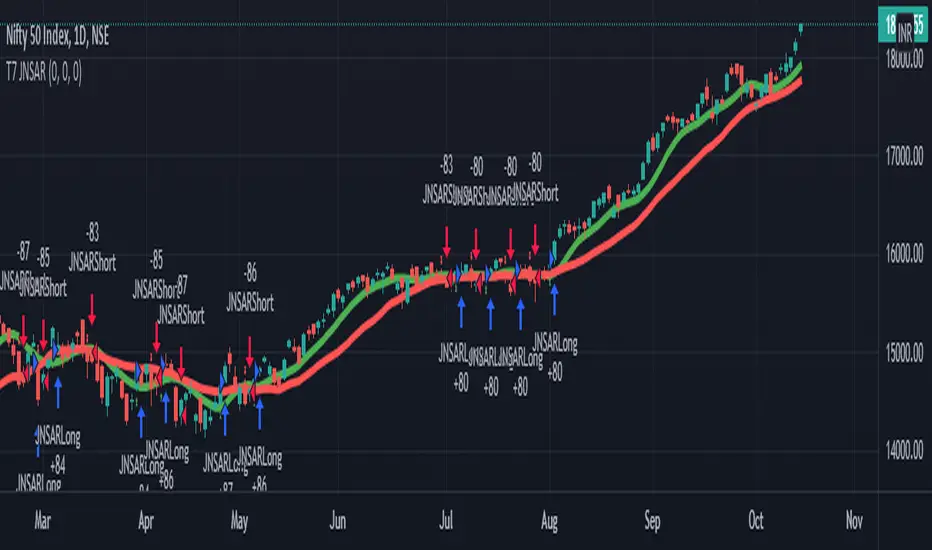
T7 JNSARUpdated code for the T7 JNSAR system earlier published here -
Following updates made to the code
1. Buy / Sell arrows now appear when the corresponding conditions are met.
2. Support for Heikin-Ashi Candles added
3. Different Backtesting Position Sizing Algorithms added for evaluation
Also am republishing the trading rules here again with some modification
1. Go Long when the daily close is above the JNSAR line. Go Short when the daily close is below the JNSAR line. JNSAR line is the varying green line overlayed over the price chart. Once a signal comes at market close enter in the direction of the signal @ market price @ next day market open.
2. Trade only Nifty Index. This system was developed and backtested only for NIFTY Index. So trade in its Futures or Options, as you may deem fit. My recommendation is to choose futures for simplicity. If you want to reduce the trading cost and go with options, trade with deep in the money options, preferably 2 strikes far from the spot price.
3. Trade all signals. Markets trend only 30-35% of the time and hence the system is only accurate to that extend. But system tends to make enough money, in this small trending window, to keep the overall profitability in good health. But one never knows when a big trend may come and when it comes its absolutely imperative that you take it. To ensure that, trade all signals and don't be choosy about what signals you are going to trade. Also I wouldn't recommend using your own analysis to trade this system. Too many drivers will crash the car.
4. Like all trend following systems, this system will have many whipsaws during flat markets along with large trade and account drawdowns. Also some months and even years may not be profitable. But to trade this system profitably, it is necessary to take these in one's stride and keep trading. As the backtester results from 1990 to 2016 proves, this system is profitable overall thus far. Take confidence from that objective fact.
5. Trade with only that amount of money you can afford to loose. Initial capital that you need to have to trade one lot of NIFTY should be atleast - (Margin Money required to take and hold 1 lot position + maximum drawdown amount per lot)*1.2. Be prepared to add more if need be, but the above formula will give a rough idea of what you need to have to start trading and be in the game always.
6. Place an After Market Order @ Market Price with your broker after market close so that you get to execute the trade next trading day @ Market open to capture near similar price as the daily open price seen on the chart. This execution mode will give you the best chance to minimise the slippage and mimic the backtester results as closely as practically possible.
7. Follow all the 6 rules above religiously, as if your life depends on it. If you cant, then don't trade this system; You will certainly loose money.
Happy Trading !!! As always am looking out for your valuable feedback.
T7 JNSARJNSAR stands for Just Nifty Stop & Reverse. This is a trend following daily bar trading system for NIFTY. Original idea belongs to ILLANGO @ I coded the pine version of this system based on a request from @stocksonfire. Use it at your own risk after validation at your end. Neither me or my company is responsible for any losses you may incur using this system. Hope you like this system and enjoy trading it !!!
While trading this system you must follow these simple rules.
1. Go Long when the daily close is above the JNSAR line. Go Short when the daily close is below the JNSAR line. JNSAR line is the varying green line overlayed over the price chart. Once a signal comes at market close enter in the direction of the signal @ market price @ next day market open.
2. Trade only Nifty Index. This system was developed and backtested only for NIFTY Index. So trade in its Futures or Options, as you may deem fit. My recommendation is to choose futures for simplicity. If you want to reduce the trading cost and go with options, trade with deep in the money options, preferably 2 strikes far from the spot price.
3. Trade all signals. Markets trend only 30-35% of the time and hence the system is only accurate to that extend. But system tends to make enough money, in this small trending window, to keep the overall profitability in good health. But one never knows when a big trend may come and when it comes its absolutely imperative that you take it. To ensure that, trade all signals and don't be choosy about what signals you are going to trade. Also I wouldn't recommend using your own analysis to trade this system. Too many drivers will crash the car.
4. Like all trend following systems, this system will have many whipsaws during flat markets along with large trade and account drawdowns. Also some months and even years may not be profitable. But to trade this system profitably, it is necessary to take these in one's stride and keep trading. As the backtester results from 1990 to 2016 proves, this system is profitable overall thus far. Take confidence from that objective fact.
5. Initial capital that you need to have to trade one lot of NIFTY should be atleast - (Margin Money required to take and hold 1 lot position + maximum drawdown amount per lot)*1.2. Be prepared to add more if need be, but the above formula will give a rough idea of what you need to have to start trading and be in the game always.
6. Follow all the 5 rules above religiously as if your life depends on it. If you cant, then don't trade this system; You will certainly loose money.
Fractal Resonance BarLazyBear's WaveTrend port has been praised for highlighting trend reversals with precision and punctuality (minimal lag). But strong "3rd Wave" trends can "embed" or saturate any oscillator flashing several premature crosses while stuck overbought/oversold. This happens when the trend stretches over a longer timescale than the oscillator's averaging window or filter time constant. Our solution: monitor many timescales. With Fractal Resonance Bar's rich color codings, strong wavefronts form across timescales and jump out like an approaching line of thunderclouds!
Fractal Resonance Bar color-codes the status of eight underlying stochastic oscillators, with each row averaging over twice the time of the row above.
Fractal Resonance Bar shifts its timescales along with your choice of main chart timescale:
1 minute chart: 1 minute through 128 minute (~2 hour) oscillators.
15 minute chart: 15 minute through 1920 minute (~32 hour) oscillators.
1 hour chart: 1 hour through 128 hour (~2 week) oscillators.
Daily chart: 1 day through 128 day (~4 month) oscillators.
The color map is configured as follows:
Hot Pink: Extreme Overbought (> 100%) rolled over to sell, but oscillators probably embedded with more upside (revert to Dark Green) possible after a pause.
Deep Red: Overbought (> 75%) crossover ripe for selling (validated when red spreads to timescales below).
Brown: Minor (< 75%) crossover sell from which could bounce back green or start a plunge toward gray/black.
Gray/Black: Mature (< -75%) sells turning full black in a plunge before the dawn.
Lime Green: Extreme Oversold (< -100%) and bouncing, though may yet bottom even lower.
Green: Oversold (< -75%) crossover ripe for buy. Green spreading to all timescales below will validate bottom is in.
Dark Green/Teal: Mature buy in overbought (> 75%) range, waiting for sell crossover to Hot Pink for a pause or correction.
White Stripes are Impulsive Trend Warning
Fractal Resonance Bar warns of oscillator embedding by showing white stripes when it detects strong, early surges in the timescale rows below.The white stripes usually accompany Hot Pink warning it's too early to go short, or Lime Green warning it's too early to go long.
Heeding these warnings will probably miss the exact top or bottom, but you're less likely to get overrun in a momentum move.
Usually the market gives us a second opportunity to short very close to the top or buy very close to the bottom after the warning white stripes have subsided.
NOTE: Recently rolled over Futures contracts may not have enough history for all oscillator calculations, in which case no bar colors will appear.
Tweakable Attributes
The default Channel Length, Stochastic Ratio Length and Lag Length work reasonably well on all timescales in our experience. Minor tweaks don't hurt but this may just overfit to a particular chart history.
We don't recommend changing the 75% Overbought and 100% Extreme Overbought default levels as these are ideal numbers relative to the underlying oscillator statistic calculations. But these settings can shift the color transition levels.
Embedded attribute controls the sensitivity/conservativeness of the white strip embedding detectors. Closer to 75 increases the warning sensitivity while closer to 100 decreases the aggressiveness of blocking white stripes.
Embed Separation also affects the white stripe sensitivity.
Row width increases each row's thickness to fill the available screen height you've afforded the bar.

Back to zero: Understanding seriestype: pine series basic example
time required: 10 minutes
level: medium (need to know the "array" data variable as a generic programming concept, basic Pine syntax)
tl;dr how variables and series work in Pine
Pine is an array/vector language. That's something that twists how it behaves, and how we have to think about it. A lot of misunderstandings come from forgetting this fact. This example tries to clear that concept.
First, you need to know what an array is, and how it works in a programmig language. Also, having javascript under your belt helps too. If you don't, google "javascript array basic tutorial" is your friend :)
So, in pine arrays are called "series". Every variable is an array with values for each candle in the chart. if we do:
myVar = true
this is not a constant. It is a series of values for each candle, { true, true,....., true }
In practice, the result is the same, but we can access each of the values in the series, like myVar{0}, myVar{7}, myVar{anyNumber}....
Again, it is not a constant, since you can access/modify the each value individually
so, lets show it:
plot (myVar, clolor = gray)
this plots an horizontal line of value 1 ( 1 is equal to true ) so it's all good.
On to a more usual series:
tipicalSeries = close > open ? true : false
plot(tipicalSeries, color= blue)
This gives the expected result, a tipical up and down line with values at 1 or 0. Naturally, "tipicalSeries" is an array, the "ups" and "downs" are all stored under the same variable, indexed by the candles.
In Pine, the ZERO position in the array is the last one, which corresponds to the last candle on the right. Say you have a chart with 12 candles. The close would be the closing value of what we intuitively think as first candle, the one on the left. then close ... and so on.... until close , the value of the "last" candle, the one on the right. It actually helps to start thinking of the positions backwards, counting down to zero, rocket launch style :)
And back to our series. The myVar will also be the same size, from myVar to myVar .
When we do some operation with them, something simple like
if ( myVar == tipicalSeries)
what is really happening is that internally, Pine is checking each of the indexes, as in myVar == tipicalSeries , myVar == tipicalSeries .... myVar == tipicalSeries
And we can store that stuff to check it. simply:
result = (myVar == tipicalSeries) ? true : false //yes, this is the same as tipicalSeries, but we're not in a boolean logic tut ;)
plot (result)
The reason we can plot the result is that it is an array, not a single value. The example indicator i provide shows a plot where the values are obtained from different places in the array, this line here:
mySeries3 = mySeries2 and mySeries1
this creates a series that is the result of the PREVIOUS values stored (the zero index is the one most at the right, or the "current" one), which here just causes a shift in the plotted line by one candle.
Go ahead, grab a copy of my code, try to change the indexes and see the results. Understanding this stuff is critical to go deeper into Pine :)

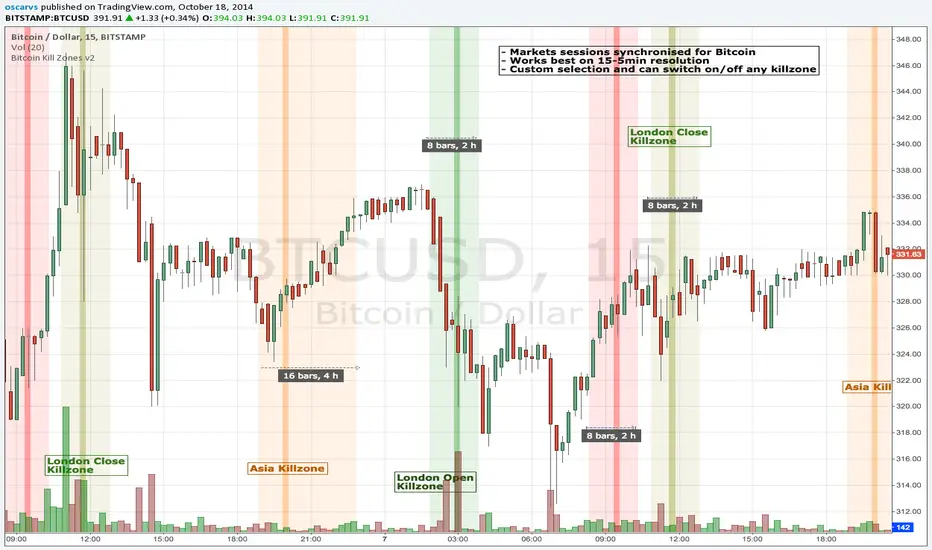
BITCOIN KILL ZONES v2Kill Zones
Kill zones are really liquidity events. Many different market participants often come together and act around these events. The activity itself may be event driven (margin calls or options exercise related activity), portfolio management driven (buy-on-close and asset allocation rebalancing orders) or institutionally driven (larger players needing liquidity to get filled in size) or a combination of any/all three. The point is, this intense cross current of activity at a very specific point in time often occurs near significant technical levels and trends established coming out of these events often persist until the next Kill Zone in approached/entered.
Specifically, there are three Kill Zones and each has its own importance/significance.
1. Asian Kill Zone (1900 - 2300 EST) Considered the "institutional" zone, this zone represents both the launch pad for new trends and also too a reloading area from the post American session. It is the start of a new day (or week) for the world and as such it makes sense this zone will often set the tone for the rest of the world's trading day. Since it is very wide (4 hours) one should pay attention to the Tokyo open (2100 EST) the Beijing open (2120 EST) and the Sydney open (0650 EST previous day).
2. London Kill Zone (0200 - 0400 EST) Considered the center of the financial universe for more than 500 years, Europe still carries a lot of influence within the banking world. Many larger players use the Euro session to establish their positions. As such, the London open often sees the most significant trend establishment activity through any given trading day. Indeed, it has been suggested 80% of all weekly trends are established through Tuesday's London Kill Zone.
3. New York Kill Zone (0830 - 1030 EST) The United States is still by far the world's largest economy and so by default New York's open carries a lot of weight and often comes with a big injection of liquidity. Indeed, most of the world's trade-able assets are priced in US dollars which gives even more significance to political and economic activity within this region. Because it comes relatively late in the globe's trading day, this Kill Zone often sees violent price swings within it's first hour leading to the time tested adage "never trust the first hour of North American trading.
Additional notes:
It has become apparent these Kill Zones are evolving over time and the course of world history. Since the end of the second world war, New York has slowly encroached on London's place as the global center for commercial banking. So much so through the later part of the 20th century New York was considered indeed, the new center of the financial universe. With the end of the cold war that leadership seems to have shifted back toward Europe and away from The United States. Additionally, Japan has slowly lost its former predominance within the global economic landscape while Beijing's has risen dramatically.
Only time will tell how these kill zones will evolve given each region's ever changing political, economic and socioeconomic influences.
Trading Notes:
If you have specific levels of interest odds are the bigger players have the same levels too. If it is indeed a solid level, look for price to trade to your level through the kill zone because the zone is a liquidity event where the bigger players can find enough size to get their big orders filled.
Try to avoid taking positions heading into Kill Zones and look for confirmation of your levels coming out of the event. For the more advanced trader, look to take positions on those level hits through the zone but understand higher time frame players often have far deeper pockets then day traders and can endure far more volatility then us little guys.
Thanks for the contribution to @CRInvestor and @ICT_MHuddleston
[LAVA] Relative Price DifferenceThis script shows the relative price difference based off the last high and low, so many bars ago. Bollinger bands are also included by default for closer inspection on the intensity of the movement or the lack thereof. Bollinger bands will follow the smoothed line which will allow the reactionary line to cross the boundary during an intense movement. With the colors selected, a gray color will appear after the color to the zero line to announce a deep correction is possible. Buy/Sell indicators show up as crosses to indicate when the price is moving in a certain direction. Sideways stagnation will have several crosses due to the close proximity to the zero line.
I use 21 in the demo here without the bollinger bands or buy/sell indicators to show the power of the script to identify bottoms and tops using the tips and hand drawn trendlines.
(This script is actually the same script as before, but listed here as the final version. Hopefully this will be my last update with this script.)
If you use and enjoy this script, please like it!
