FVG Donchian Channel strategy30min FVG + Donchian Channel strategy
buy sell by 30min fvg
and stoploss , take profit by Donchian Channel
Run the strategy on the 1min timeframe!
在腳本中搜尋"donchian"

QZ Trend (Crypto Edition) v1.1a: Donchian, EMA, ATR, Liquidity/FThe "QZ Trend (Crypto Edition)" is a rules-based trend-following breakout strategy for crypto spot or perpetual contracts, focusing on following trends, prioritizing risk control, seeking small losses and big wins, and trading only when advantageous.
Key mechanisms include:
- Market filters: Screen favorable conditions via ADX (trend strength), dollar volume (liquidity), funding fee windows, session/weekend restrictions, and spot-long-only settings.
- Signals & entries: Based on price position relative to EMA and EMA trends, combined with breaking Donchian channel extremes (with ATR ratio confirmation), plus single-position rules and post-exit cooldowns.
- Position sizing: Calculate positions by fixed risk percentage; initial stop-loss is ATR-based, complying with exchange min/max lot requirements.
- Exits & risk management: Include initial stop-loss, trailing stop (tightens only), break-even rule (stop moves to entry when target floating profit is hit), time-based exit, and post-exit cooldowns.
- Pyramiding: Add positions only when profitable with favorable momentum, requiring ATR-based spacing; add size is a fraction of the base position, with layers sharing stop logic but having unique order IDs.
Charts display EMA, Donchian channels, current stop lines, and highlight low ADX, avoidable funding windows, and low-liquidity periods.
Recommend starting with 4H or 1D timeframes, with typical parameters varying by cycle. Liquidity settings differ by token; perpetuals should enable funding window filters, while spot requires "long-only" and matching fees. The strategy performs well in trends with quick stop-losses but faces whipsaws in ranges (filters mitigate but don’t eliminate noise). Share your symbol and timeframe for tailored parameters.

CTA-min D1 — Donchian 55/20 Trend Breakout (ATR Risk)What it is
A clean, daily trend-following breakout inspired by classic CTA/Turtle logic. It buys strength and sells weakness, then lets winners run with a channel-based trailing stop. No curve-fitting, no clutter—just rules.
How it trades
Timeframe: Daily (D1)
Entry: Close breaks the previous 55-bar Donchian channel (above for longs, below for shorts).
Exit/Trail: Trailing stop at the 20-bar Donchian channel on the opposite side (no fixed TP).
Risk: Initial stop = ATR(N) × stopMult (ATR is smoothed). Position size risks riskPct% of equity based on stop distance.
Labels: “BUY/SELL” only on the entry bar; “STOP BUY/STOP SELL” only on the exit bar.
Pyramiding: Off (one position at a time).
Regime Alignment with EMAs (recommended filter, not enforced by code)
Add EMA 50 and EMA 200 to the D1 chart.
Long bias: take BUY signals only when EMA50 > EMA200 (bullish regime).
Short bias: take SELL signals only when EMA50 < EMA200 (bearish regime).
Optional: for extra selectivity, require the H4 EMAs (50/200) to align with D1 before acting on a signal.
Inputs
entryN (55), exitN (20), atrLen (20), atrSmooth (10), stopMult (2.0), riskPct (0.5%–1.0% recommended).
Works well on (tested by user)
BTCUSD (Bitcoin), EURUSD, GBPJPY, NAS100/US100, USDJPY, AUDUSD, XAGUSD (Silver), US30 (Dow), JP225 (Nikkei), EURGBP, NZDUSD, EURCHF, USDCHF.
How to use
Apply to D1 charts. Review once per day after the daily close and execute next session open to mirror backtest assumptions. Best used as a portfolio strategy across multiple uncorrelated markets. Use the EMA alignment above as a discretionary regime filter to reduce false breakouts.
Notes
For educational use. Markets involve risk; past performance does not guarantee future results. Use responsible position sizing.

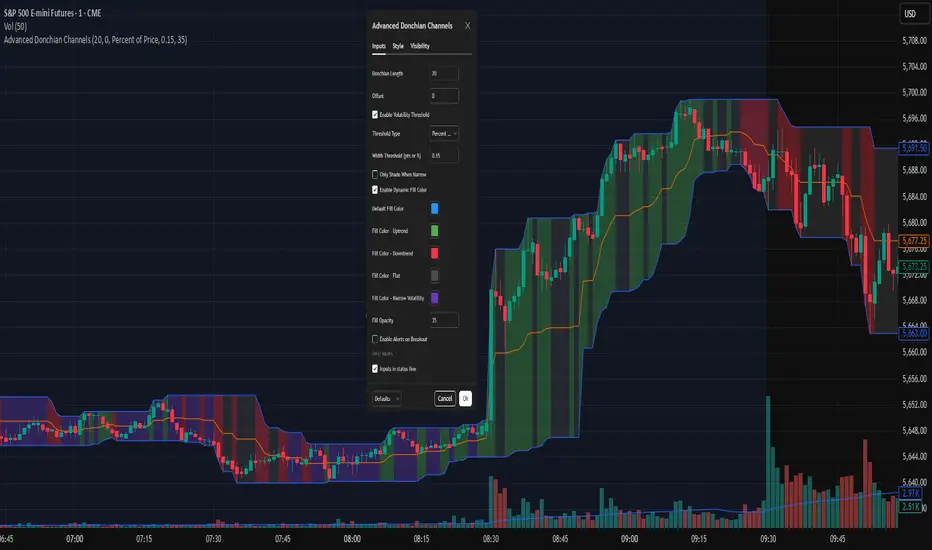
Advanced Donchian ChannelsJust an indicator I got ChatGPT to cook up for my own use, sharing it in case anyone else finds it useful. I have included a screenshot of my own settings as well for reference.
This indicator enhances the classic Donchian Channel with powerful contextual features to support modern breakout and volatility-based trading strategies.
🔹 Core Features:
Donchian Bands: Plots the highest high and lowest low over a configurable lookback period.
Dynamic Fill Shading:
- Color-coded based on the slope of the midline (Basis): Default settings are Green for uptrend, Red for downtrend, Silver for flat, Gray for narrow volatility.
- All fill colors are fully customizable.
Volatility Filter:
- Detects when the channel width is narrow using either a fixed value or a percentage of price.
- Optionally shades only during low-volatility (compression) periods.
Customizable Style:
- Adjustable opacity, offsets, and color settings to suit your charting style.
🛠 Use Cases:
- Spot potential breakout setups after periods of low volatility.
- Identify trend direction via basis slope shading.
- Combine with momentum or volume tools for high-probability entries.
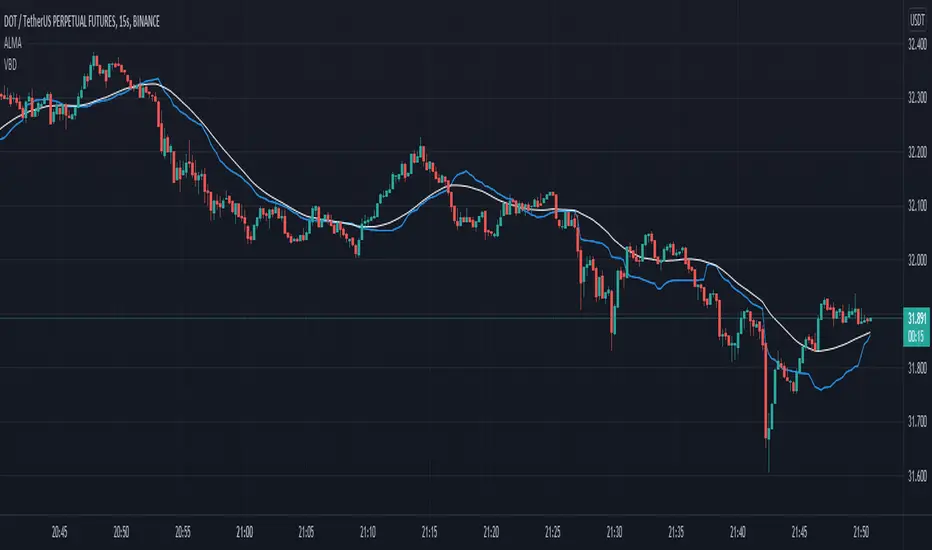
Volume Based DonchianA simple experiment that mixes volume and Donchian's algorithm.
In this version I have implemented a more elegant version of the formula, using the VWMA function instead of spelling out the steps.
I have kept both formulas for educational purposes.
I also plot an Alma Moving Average, how you can see a 16 periods Volume Based Donchian is pretty similar to a 80 period Alma. I think it could be nice stuff if you wanna ask me something write me.
Noro's Donchian StrategyThe strategy uses Donchian price channel . The channel is shown in blue lines. All other lines use Donchian channel too. The red line is the center line between the channel lines. The lime line is a few percent further away. The percentage is set by the user in the strategy settings.
Lines
Blue line - to open position using market stop order
Lime line - take-profit (limit order)
Red line - stop-loss (market stop order, trailing-stop)
For
- BTC /USD, XBT/USD, ETH/USD (need USD)
- timeframe: 1h or 4h

Turtle trading strategy (Donchian/ATR)Strategy based on Turtle Trading Strategy from William Eckhardt and Richard Dennis
- Considers entering trades on breakout of Donchian channels (upper for long, lower for short) (Default length = 20 for daily)
- Considers exiting trades on breakout of Donchian channels (lower for long, upper for short) with lower length (10 for daily)
- Uses 2N ATR (default) as stop loss

Trend Following with Donchian Channels and MACDThis is a trend following system based on the Donchian Channels. Instead of using a simple moving average crossover, this system uses the MACD as the trendfilter:
Long positions:
* Price makes a new 50 day high,
* The MACD-line crosses above or is above the Signal-line.
* Both the MACD and the Signal-lines are above the zero-line.
Short positions:
* Price makes a new 50 day low,
* The MACD-line crosses below or is below the Signal-line.
* Both the MACD and the Signal-lines are below the zero-line.
Stoploss:
The initial and the trailing stoploss are 4 ATRs away from the price.

VWMA Donchian ChannelsPlots Donchian Channel based on VWMA. Trend strength analysis tool.
Note that the VWMA is based on the ohlc not the close.
Strong trends will break out of this channel consolidation will remain inside of the channel. The Channel Midline may be a good bull bear indicator.
As with most trend indicators longer timeframes for the market you are trading will be best. But this can work on all chart time frames

James Donchian ChannelsThis derived from the basis of a Donchian channel with a SMA smoother applied to the indicator.
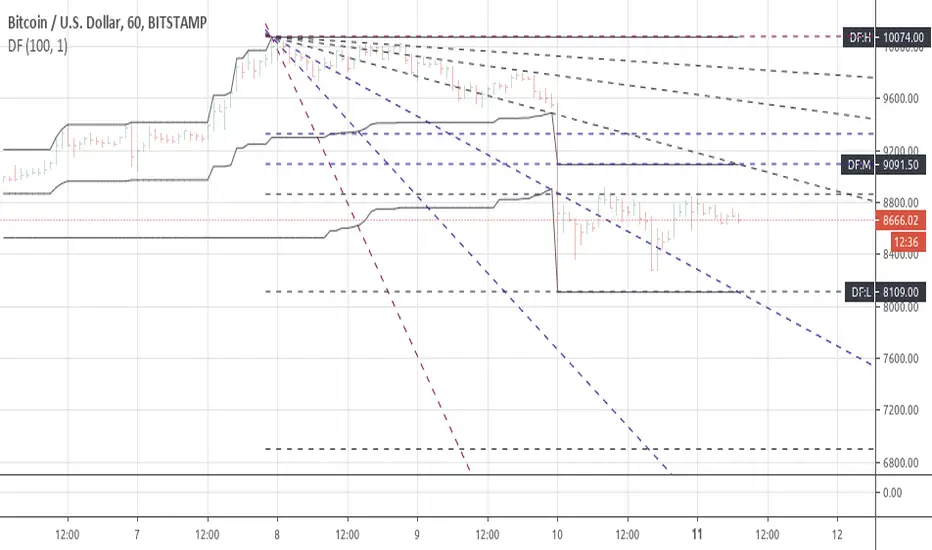
Running Donchian ChannelsExperimental script to plot a forecast for the Donchian Channels indicator.
By using show_last = 2 , the forecast shows a solid line, this gets messed up on the bar when a new high or low is made.. Like the image below. I don't know how to fix that, please tell me if you do :)

Complete turtles strategy based on the donchian channelsDear Traders and investor,
I want to demonstrate scrypt of the iconic "trend following strategy" coded by my
The main idea was borrowed from the book "Way of the Turtle: The Secret Methods that Turned Ordinary People into Legendary". The strategy is based on the donchian channels and is one of the oldest and easiest strategy in the using. Also strategy include risk managment and trends filter which prevent false entries and high drawndowns. The results are based on the period from 2006 to present, but you can also change timeframe and period of backtesting.
Best regards,
Vlad

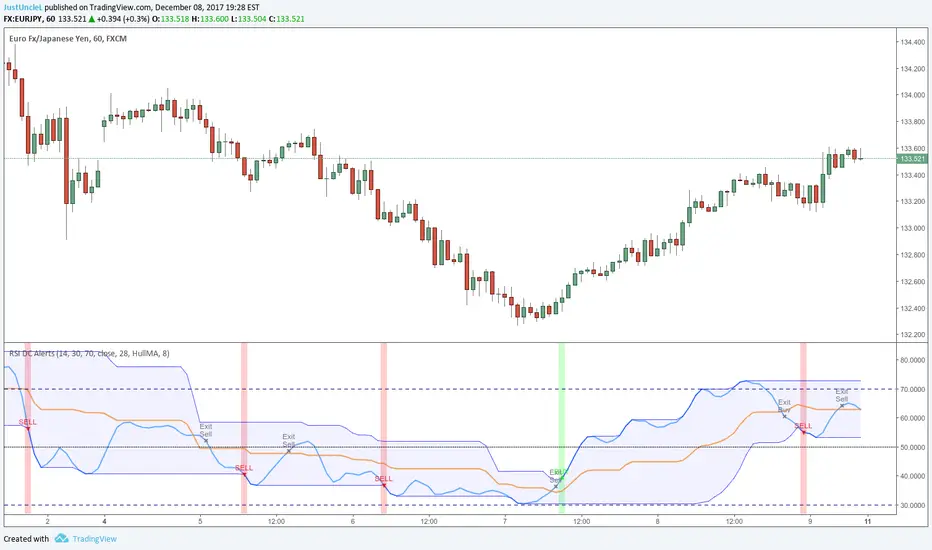
RSI Donchian R1 Alerts by JustUncleLThis study is based on an idea by presented by RicardoSantos and JayRogers of using Donchian Channel (DC) on the RSI curve. The idea being that when RSI passes through the DC centre and touches the Highest/Lowest DC then price action tends to follow in the same direction and stay there until the RSI crosses DC centre line again.
This script expands on the original idea by including alert and exit signals based on the above rules. These alerts are also filtered by the rule: they must be within the Oversold and Overbought boundaries of the RSI.
There is also the option of applying MA smoothing to the RSI curve, the HullMA (8) is recommended (default).
Each Entry and Exit signal creates an Alertcondition that can be picked up by the TradingView Alarm system.
TIP: Remember this type of Trading technique only works well in a trending market. Do not try to trade this technique in a ranging/flat market.
[RS]MTF Donchian Range Wave Sync V1EXPERIMENTAL: using Donchian channels with diferent lengths to extract multiple time frame's to extract price in range rates. the title may be a tiny bit misleading tho -_-''
update: reversed colors, joined the line zone space to make the waves visually stand out more.

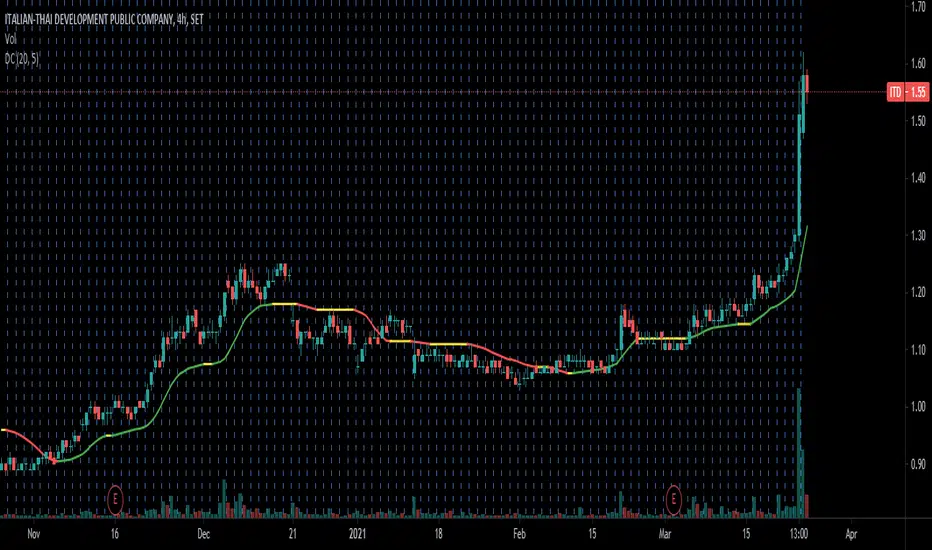
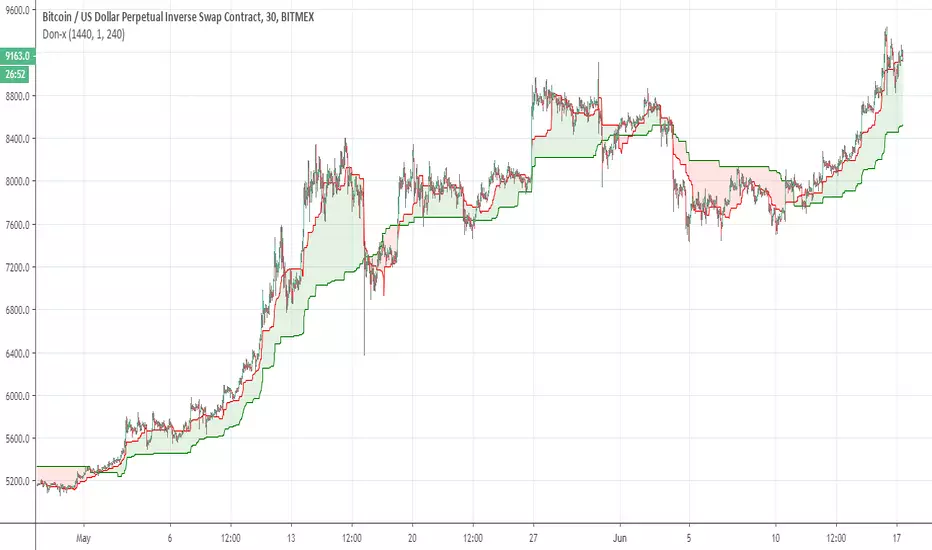
Don-xSimple indicator that nased on two donochian bases each calculated slight different with MTF , where we based a faster of 240 min over slower of daily one on each other and we put on lower time frame (30 min, 1 hour or 2 hour )
hence we can see the bullish trend (green ) or bearish trend (green ) more easy
can be used as by its own (slight lag ) or with other indicators to see where the asset direction is
Donochian zonesThis indicator give the ratio between the high and low of donochian channel and if we take ratio and add it to each other then we can calculate if it + meaning bullish trend or negative meaning bearish trend
using non repainting MTF we can see the zone of the channel at different time set
we can use this indicator to filter bad signal or make it stand alone
here example of amazon stock with 360 min mtf over one hour graph
here facebook 240min over 15 min graph

Contrarian DC Strategy - w Entry SL Pause and TrailingStopDonchian Channel Setup:
The strategy uses a tool called the Donchian Channel. Imagine this as two lines (bands) on a chart that show the highest and lowest prices over a certain number of past trading days (default is 20 days).
There's also a centerline, which is the average of these two bands.
Entry Conditions for Trades:
Buying (Going Long): The strategy considers buying when the price touches or falls below the lower band of the Donchian Channel. However, this only happens if there has been a pause after a previous losing trade. This pause is a number of candles where no new trades are taken.
Selling (Going Short): Similarly, the strategy considers selling when price reaches or exceeds the upper band of the Donchian Channel. Again, this is subject to a pause after a losing trade.
Stop Loss and Take Profit:
Each trade has a "Stop Loss" and "Take Profit" set. The Stop Loss is a preset price level where the trade will close to prevent further losses if the market moves against your position. The Take Profit does the same but locks in profit if the market moves in your favor.
The Stop Loss is set based on a percentage of the price at which you entered the trade.
The Take Profit is determined by the Risk/Reward Ratio. This ratio helps balance how much you're willing to risk versus the potential reward.
Trailing Stop Loss:
When a trade is profitable, the strategy should involve a "Trailing Stop Loss." This means the Stop Loss level moves (or trails) the price movement to lock in profits as the market moves in your favor.
For a buy trade, if the price moves above the centerline of the Donchian Channel, the Trailing Stop Loss should be adjusted in the middle between the entry price and the centerline. Viceversa for a sell trade, it should be adjusted in the same way if the price goes below the centerline.
IMPORTANT: There's no allert for the trailing stop at the moment.
Post-Stop Loss Pause:
If a trade hits the Stop Loss (i.e., it's a losing trade), the strategy takes a break before opening another trade in the same direction. This pause helps to avoid entering another trade immediately in a potentially unfavorable market.
In summary, this strategy is designed to make trades based on the Donchian Channel, with specific rules for when to enter and exit trades, and mechanisms to manage risk and protect profits. It's contrarian because it tends to buy when the price is low and sell when the price is high, which is opposite to what many traders might do.

FiboDonchianDonchian channels were developed by Richard Donchian, the father of trend following. The two outer bands are plotted as the highest high and lowest low for a set period of time.
In the FiboDonchian, the channel is divided into 3 zones according to Fibonacci levels:
0-0.382 (Bullish Zone)
0.382-0.618 (Neutral Zone)
0.618-1(Bearish Zone)
These levels will usually act as support and resistance during trends, and will reverse depending on the direction of the trend (e.g. in an uptrend the .382 is above the .5 and during a downtrend it is below).
An option to color candles according to the trend is given, with the following logic:
-During uptrends, candles will turn bullish when a new high is made and will remain in this state as long as price closes in the upper zone. Below this zone price turns neutral until a new high or low is made.
-During downtrends, candles will turn bearish when a new low is made and will remain like this provided that price closes in the lower zone. Above this zone price turns neutral until a new low or high is made.
Enjoy!!

Long and Short Term Highs and LowsLong and Short Term Highs and Lows
Overview:
This indicator is designed to help traders identify significant price points by marking new highs and lows over two distinct timeframes—a long-term and a short-term period. It achieves this by drawing optional channel lines that outline the highest highs and lowest lows over the chosen time periods and by plotting visual markers (triangles) on the chart when a new high or low is detected.
Key Features:
Dual Timeframe Analysis:
Long Term: Uses a user-defined “Time Period” (default 52) and “Time Unit” (default: Weekly) to determine long-term high and low levels.
Short Term: Uses a separate “Time Period” (default 50) and “Time Unit” (default: Daily) to compute short-term high and low levels.
Optional Channel Display:
For both long and short term periods, you have the option to display a channel by plotting the highest and lowest values as lines. This visual channel helps to delineate the range within which the price has traded over the selected period.
New High/Low Markers:
The indicator identifies moments when the highest high or lowest low is updated relative to the previous bar.
When a new high is established, an up triangle is plotted above the bar.
Conversely, when a new low occurs, a down triangle is plotted below the bar.
Separate input toggles allow you to enable or disable these markers independently for the long-term and short-term setups.
Inputs and Settings:
Long Term High/Low Period Settings:
Show New High/Low? (STW): Toggle to enable or disable the plotting of new high/low markers for the long-term period.
Time Period: The number of bars used to calculate the highest high and lowest low (default is 52).
Time Unit: The timeframe on which the long-term calculation is based (default is Weekly).
Show Channel? (SCW): Toggle to display the channel lines that connect the long-term high and low levels.
Short Term High/Low Period Settings:
Show New High/Low?: Toggle to enable or disable the plotting of new high/low markers for the short-term period.
Time Period: The number of bars used for calculating the short-term extremes (default is 50).
Time Unit: The timeframe on which the short-term calculations are based (default is Daily).
Show Channel?: Toggle to display the channel lines for the short-term highs and lows.
Indicator Logic:
Channel Calculation:
The script uses the request.security function to pull data from the specified timeframes. For each timeframe:
It calculates the lowest low over the defined period using ta.lowest.
It calculates the highest high over the defined period using ta.highest.
These values can be optionally plotted as channel lines when the “Show Channel?” option is enabled.
New High/Low Detection:
For each timeframe, the indicator compares the current high (or low) with its immediate previous value:
New High: When the current high exceeds the previous bar’s high, an up triangle is drawn above the bar.
New Low: When the current low falls below the previous bar’s low, a down triangle is drawn below the bar.
Usage and Interpretation:
Trend Identification:
When new highs (or lows) occur, they can signal the start of a strong upward (or downward) movement. The indicator helps you visually track these critical turning points over both longer and shorter periods.
Channel Breakouts:
The optional channel display offers additional context. Price movement beyond these channels may indicate a breakout or a significant shift in trend.
Customizable Timeframes:
You can adjust both the time period and time unit to fit your trading style—whether you’re focusing on longer-term trends or short-term price action.
Conclusion:
This indicator provides a dual-layer analysis by combining long-term and short-term perspectives, making it a versatile tool for identifying key highs and lows. Whether you are looking to confirm trend strength or spot potential breakouts, the “Long and Short Term Highs and Lows” indicator adds a valuable visual element to your TradingView charts.

Enhanced ShareGenius Swing TradingSwing Trading Strategy Features:
1. Point out candles where days low price matched 20 day low price (Blue Triangle with Yellow Bar)
2. Hollow Body candles depict days when days close is within the threshold of 20 day high (defaulted to 5%). An indication to start GTT buy orders.
3. Point out candles when GTT buy order was triggered (Light Green body)
Experimental:
1. Using tolerance to low price matching logic (instead of exact match)
As a result if the days low is within the tolerance, such candles will be highlighted with light blue triangle and yellow body

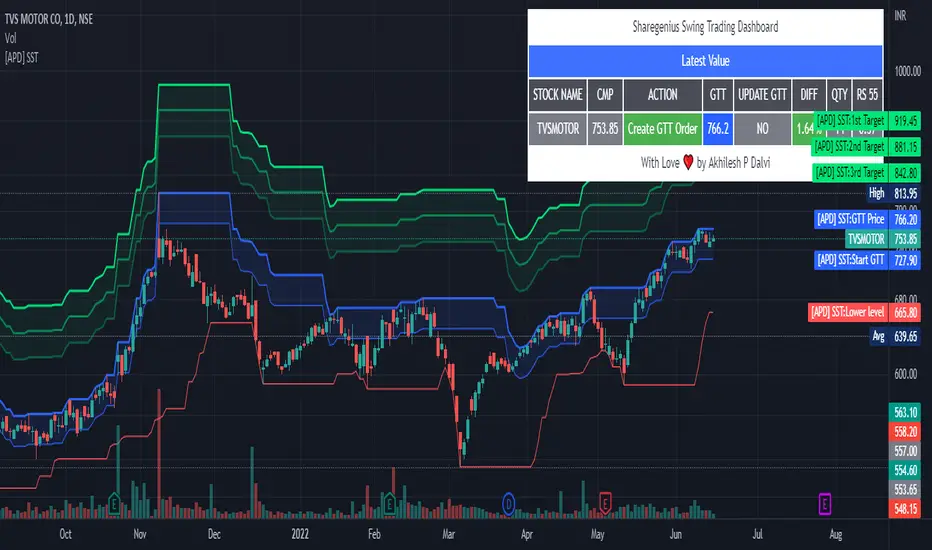
[APD] Sharegenius Swing Trading StrategyThis script plots GTT Price , Target Prices , Buy Zone , Target Zone and Information Dashboard according to Sharegenius Swing Trading Strategy. SST is for Swing Trading.
👉🏻 Strategy by Mahesh Kaushik -
1️⃣ Track the 20-Day Low of the instrument.
2️⃣ Create a GTT order which is 5% above 20 DL.
3️⃣ If the share makes a new 20 DL before getting purchased, then update your GTT order to be 5% above the new 20 DL.
4️⃣ Next GTT will be started when the average price falls by 10%. (GTT will be created as 5% above the last 20 DL or Buy on 10%, 20%, 30% fall in average price.)
5️⃣ Sell target is 5% of the average price. Sell all units or Set sell target on buy price.
6️⃣ No stop loss is needed as we buy when the stock falls.
👉🏻 Note:-
Trade in fundamentally good stocks & strong stocks those are outperforming index because we do not take stop loss in this strategy.
DISCLAIMER:- This Script is for educational purposes only. Nothing in this content should be interpreted as financial advice or a recommendation to buy or sell any sort of security or investment.
Stochastic ChannelsDonchain trend following system with overbought/ oversold areas inspired by stochastic. Multiplier to get non repainting HTF capability. features a smoothed price as well as moving average of the smoothed price, also inspired by the stochastic indicators %K and %D. This and slow stochastics compliment each other nicely.
%D line colored by direction.
Filled color areas represent overbought/oversold.
Shows breakouts as well as giving targets and entries in rangebound markets.
