Volume-Supported Linear Regression Trend Modified StrategyHi everyone, this will be my first published script on Tradingview, maybe more to come.
For quite some time I have been looking for a script that performs no matter if price goes up or down or sideways. I believe this strategy comes pretty close to that. Although nowhere near the so called "buy&hold equity" of BTC, it has produced consistent profits even when price goes down.
It is a strategy which seems to work best on the 1H timeframe for cryptocurrencies.
Just by testing different settings for SL and TP you can customize it for each pair.
THE STRATEGY:
Basically, I used the Volume Supported Linear Regression Trend Model that LonesomeTheBlue has created and modified a few things such as entry and exit conditions. So all credits go to him!
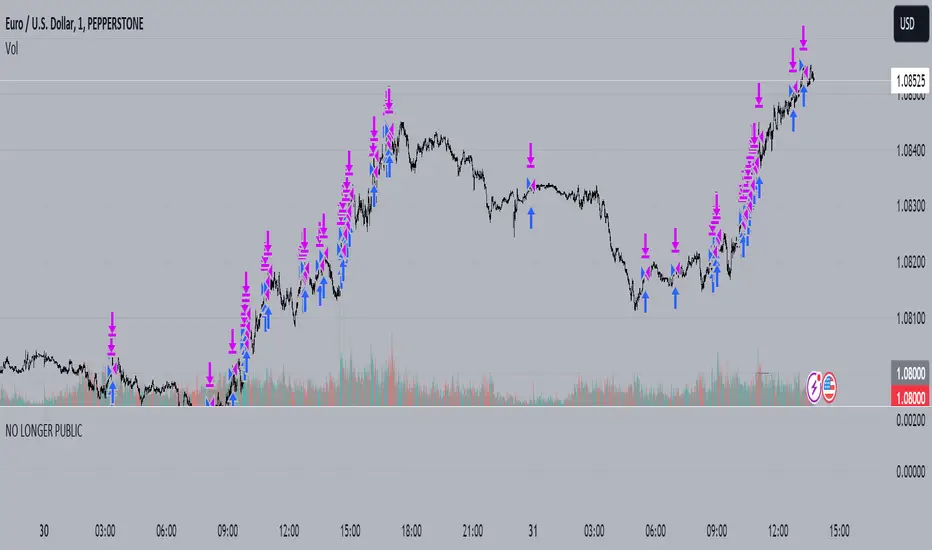
LONG ENTRY: When there is a bullish cross of the short term trend (the histogram/columns), while the long term trend is above 0 and rising.
SHORT ENTRY: When there is a bearish cross (green to red) of the short-term trend (the histogram/columns), while the long term trend is beneath 0 and decreasing.
LONG EXIT: Bearish crossover of short-term trend while long term trend is below 0
SHORT EXIT: Bullish crossover of short-term trend while long term trend is above 0
Combining this with e.g. a SL of 2% and a TP of 20% (as used in my backtesting), combined with pyramiding and correct risk management, it gives pretty consistent results.
Be aware, this is only for educational purpose and in no means financial advise. Past results do not guarantee future results. This strategy can lose money!
Enjoy :)
PS: It works not only on BTC of course, works even better on some other major crypto pairs. I'll leave it to you to find out which ones ;)
Pine Script®策略