Daily/Weekly FVG by KrisThis indicator is a Multi-Timeframe (MTF) tool designed to automatically identify and project Fair Value Gaps (Imbalances) from Daily and Weekly timeframes onto your current chart. It helps traders locate higher-timeframe Areas of Interest (POI) and liquidity voids without manually switching charts.
How it works:
The script utilizes `request.security` to fetch High and Low data from Daily and Weekly timeframes. It identifies a Fair Value Gap (FVG) based on the 3-candle formation logic where price moves inefficiently, leaving a gap between the wicks.
- Bullish FVG: Identified when the current Daily/Weekly Low is greater than the High of the candle from 2 periods ago.
- Bearish FVG: Identified when the current Daily/Weekly High is lower than the Low of the candle from 2 periods ago.
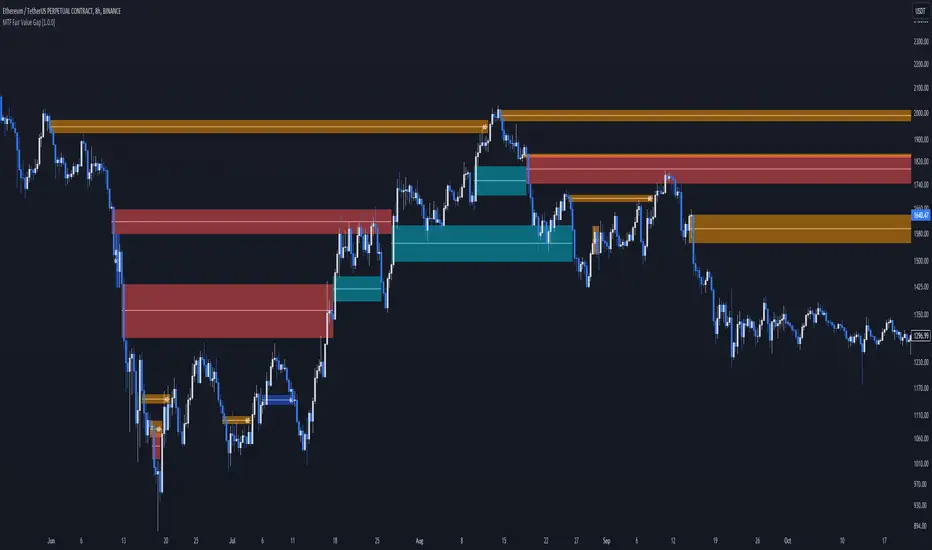
The indicator draws a box extending to the right to visualize the zone, along with a dotted midline which often acts as a sensitive support/resistance level.
Unique Feature: Smart Mitigation (Auto-Hide)
To keep your chart clean and focused on relevant data, the script includes a "Full Fill" logic. It continuously monitors price action relative to existing FVG boxes.
- If price completely crosses through a box (fully fills the gap), the indicator considers it "mitigated" and automatically hides the box and its midline (sets transparency to 100%).
- This ensures you only see "fresh" or unfilled gaps that are still relevant for trading.
Settings:
- TF Checkboxes (Daily/Weekly FVG): Toggle the visibility of Daily or Weekly gaps independently based on your analysis needs.
- Design Mode:
Colored: Uses classic Green (Bullish) and Red (Bearish) colors for easy trend identification.
Monochrome: Uses Gray tones for a minimalist look that reduces visual noise on the chart.
Usage:
Use these zones to identify potential reversal points or liquidity targets. Since these are higher-timeframe levels, they often carry more weight than intraday imbalances.
Pine Script®指標