Mad_FibonacciboxLibrary "Mad_Fibonaccibox"
This library is designed to create and manage multiple Fibonacci boxes, which are graphical representations based on the inputs.
-----------------
exports:
f_fib_calc(_Fibonacci_box, _itemnumber)
fibonacci calc.
@description This function block uses the levels and paramters set into the type_fibonacci_box(levels) and fills the corresponding array of prices.
Parameters:
_Fibonacci_box (type_Fibonacci_box )
_itemnumber (int)
Returns: returns a type_Fibonacci_box with the filled data
f_fib_draw(_Fibonacci_box, _itemnumber)
fibonacci draw.
@description This function block uses the levels, prices and paramters set into the type_fibonacci_box(levels) and draws the fib on the chart
Parameters:
_Fibonacci_box (type_Fibonacci_box )
_itemnumber (int)
Returns: returns lines labels and fills on the chart, no data returns
type_level
s for defining a lines and texts of a fibonacci box
Fields:
level (series float)
price (series float)
drawline (series bool)
linewidth (series int)
linetype (series string)
fiblinecolor (series color)
drawlabel (series string)
labeltext (series string)
textshift (series int)
fibtextcolor (series color)
fibtextsize (series string)
transp (series int)
type_fill
s for defining the fills of a fibonaccibox
Fields:
partner_A (series int)
partner_B (series int)
fill_color (series color)
transp (series int)
type_Fibonacci_box
s for defining a fibonacci box
Fields:
bottom_price (series float)
top_price (series float)
StartBar (series int)
StopBar (series int)
levels (type_level )
fills (type_fill )
ChartisLog (series bool)
fibreverse (series bool)
fibdrawreverse (series bool)
decimals_price (series int)
decimals_percent (series int)
drawlines (series bool)
drawlabels (series bool)
drawfills (series bool)
draw_biginfo (series bool)
biginfo_textshift (series int)
rangeinfo_location (series int)
rangeinfo_color (series color)
rangeinfo_textsize (series string)
line_array (line )
linefill_array (linefill )
label_array (label )
在腳本中搜尋"fib"
Auto Fibonacci Retracement // Atilla YurtsevenOverview:
This Pine Script™ is a specialized tool for traders, designed to automatically plot Fibonacci retracement levels over a user-defined date range in trading charts. It also indicates the extent of price retracement within these levels.
Key Features:
Date Range Customization: Users can specify the start and end dates to focus the analysis on a particular trading period.
Dynamic Fibonacci Levels: The script includes various Fibonacci ratios (0.0, 0.236, 0.382, 0.5, 0.618, 0.786, 1.0), with the flexibility to enable or disable individual levels.
Visual Customization: Each Fibonacci level can be customized for color and line style (solid, dotted, dashed). Labels for each level are also configurable.
Retracement Measurement: The script not only draws the Fibonacci levels but also measures and displays how much the price has retraced within these levels.
Extension and Additional Options: Users have options to extend the Fibonacci lines and additional features such as using close values, trend drawing, date range display, and more.
Technical Insights:
The script identifies high and low values within the selected time frame, assessing the market's trend direction.
Within the specified date range, this script effortlessly plots the Fibonacci levels automatically, bringing clarity and precision to your market analysis as it unfolds.
The tool's adaptability makes it suitable for various trading styles and chart preferences.
Intended Use:
This script is particularly valuable for technical analysts and traders who use Fibonacci retracements to identify potential support and resistance areas and understand the depth of market corrections or rallies.
Disclaimer:
This Pine Script™ is offered 'as is', without any guarantees or warranties. It is intended for informational purposes and should not be taken as investment advice. Atilla Yurtseven, the creator of this script, assumes no responsibility for any financial losses or gains that may result from its usage. Users should perform their own due diligence and consult with professional advisors before making any investment decisions.
Remember to follow and comment!
Trade smart, stay safe
Atilla Yurtseven

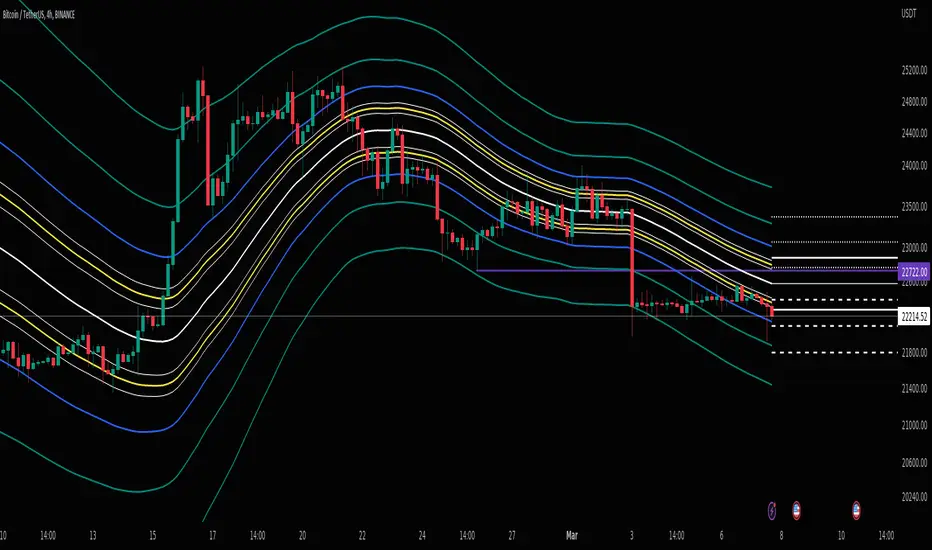
Day Open,High,Low Fib LevelsDay Open,High,Low Fibonacci Levels indicator depicts Fibonacci levels from Highest to lowest price levels vis-à-vis Day Open Price. The indicator is structured based on default Intraday number of bars. Hence the indicator and Gray Zone concept is effective in lower time frames .The indicator has also “Regular” Check in Box option under “Input” with default 14 bars under “Regular Length” to switch over from default Intraday Length.
Green Zone represent area above Day Open Price when close is above Day Open Price.
Red Zone represent area below Day Open Price when close is below Day Open Price.
Gray Zone represent band within the Maximum and Minimum of Moving Averages of MA24,MA38,MA50,MA62,MA79 drawn with relevance to Fibonacci levels. The movement within this band is expected to be resistant prone on either direction.
Fibonacci levels between Highest and Lowest points during Green Zone and Red Zone are derived and reflected at 78.6,61.8,50.0,38.2 and 23.6 levels for users guidance.
Trades above Gray Zone are favored for Buy trades and below Gray Zone are favored for Sell trades. Trades within Gray Zone are resistant prone from either direction.
If number of bars in Gray Zone during Intraday are more than the combined number of bars above Green Zone and number of bras below Gray Zone then market may be assumed to be in Range bound state.
MA20 and MA200 are in default in display state. Position of MA 20 above and below Gray Zone and vis-à-vis MA Mid (Mid point in Gray Zone ) reflects the prevailing trend .MA 200 reflects the general Up trend or Down trend .
The Indicator reflects the Green Zone, Gray Zone ,Red Zone in the Table below the Chart depending on the position of Day Open Price below or above the Last Price .If the number of bars in the Gray Zone are more than the combined number of bars above and below Gray Zone the table reflect Range Bound Market.
Supplementing with other monitoring tools and Price Action dynamics the indicator assist the user to plan his entry and exit of trade based on the position of the market whether it is in Green Zone or Red Zone by taking into account the Fibonacci Levels.
DISCLAIMER : For educational and entertainment purpose only .Nothing in this content should be interpreted as financial advice or a recommendation to buy or sell any sort of security/ies or investment/s.

ZigZag++ FibonacciAuto Fibonacci tools are powerful ways designed to simplify your technical analysis by automatically drawing Fibonacci retracement and extension levels on your chart. This indicator is built to enhance your trading experience with clearer market moves and informative insights.
You can easily spot your waves and patterns when the percentages are moving with you.
Key Features:
Automated Fibonacci Levels: Plots Fibonacci retracement and extension levels based on recent price movements.
Multi-Timeframe Support: This indicator is your versatile companion, offering multi-timeframe functionality. You can seamlessly track Fibonacci levels across different resolutions, providing a comprehensive view of the market.
Two Types of Fibs: Retracement and Timeframe extension Fibonacci levels. Use retracements to identify potential reversal points and extensions to anticipate price targets, giving you a well-rounded perspective on market movements.
Benefits:
Save Time: No more manual Fibonacci drawing; It does this for you in real-time.
Enhanced Analysis: Gain a deeper understanding of potential support, resistance, and price targets.
User-Friendly: Suitable for traders of all levels, this indicator simplifies complex technical analysis.
For the math lovers
I started creating the ZigZag++ based on the MT4 calculation as I found it better performing than the tradingview inbuilt one. I have revised the calculation couple of times and now the final calculation is simple yet more accurate for my analysis.
First, I observe the market direction for the last Depth setting by comparing the rate at which high values reduce and low values increase. When the number of ticks set by Deviation is crossed and the last cross is more than the Backstep candles, then we have our ZigZag points.
These are the points we use in our Fibonacci calculation.
Checkout ZigLib below to use the same logic in your scripts.
Sample usage
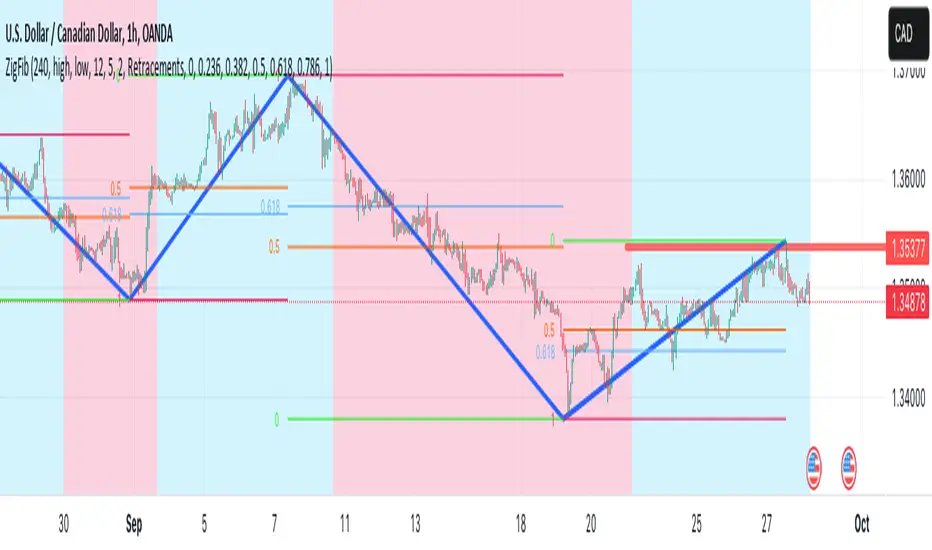
This is a 4 Hour configuration with the default settings.
When the trend reversed, some key points I watch are 0.618 and 0.5. The market retraced back and formed the new point for the next ZigZag line on that level. This market behaviour happens quite often on these Fibonacci points. I would be looking for reversal or a break in this zone to know the next step.
Resources
ZigZag++ Lib by me; for retrieving the line points.
Fibonacci Toolkit by Lux Algo; For drawing the Timeframe Fibs. Very Amazing script.
Clone Pivots. Oct_2023Conceptually very simple.
The all time high or low of the chart (this indicator can be used with non-price sources as well), is used to divide the price pane continuously by 2.
For example the first pivot is (All Time High + All Time Low)/2.
From this point the price chart is further divided by 2.
The user can set the depth of division, and the lines for depth are only shown around the price.
About clone pivots.
- they can be used for ladder trading
- they are based on the range of the stock or instrument price
An alternative is available to use Fib divisions rather than simple divide by 2 method.
Labels may be placed with price or without. And depth of labelling is also an option.
Clone pivots at 50% tend to work very well with price structures - give it a try and see if it helps your trading!
Pine source uses UDTs, Methods, Arrays and Maps.

RSI + Fibonacci HH LL Support Resistance I have integrated my past scripts and brushed them up further.
This tool allows for support/resistance, stop loss, take profit, and trend analysis using RSI and Fibonacci ratios.
For example, the Fibonacci ratio is used as follows
l1 = m - dist * 0.618
l2 = m - dist * 1.618
l3 = m - dist * 2.618
l4 = m - dist * 4.235
l5 = m - dist * 6.857
l6 = m - dist * 11.089
When the Fibonacci ratio reaches 2.618 or higher and the RSI smoothed by the 5-day EMA is oversold/overbought, the bar color is changed by a gradation.
We have tried to make the design as beautiful and good-looking as possible. You can also hide the lines to suit your own preference.
Example usages are here:
BTCUSDT 1Hour Chart
Using Fibonacci numbers
BTCUSDT 15min Chart, for Scalping
Here, to set the highest and lowest prices one hour ago, "4" is substituted as the calculation: 15 minutes x 4 = 60
BTCUSDT 15min Chart, for Scalping
To set the highest and lowest prices 4 hours ago , "4" is substituted as the calculation: 15 minutes x 16 = 240
BTCUSDT 15min Chart, for Scalping
To draw yesterday's high and low as support/resistance lines, I substituted the number "96" as 1440/15=96.
BTCUSDT 1min Chart, for Scalping
Substituted "60" to trail the highest and lowest prices over a 60-minute period on a 1-minute chart, and removed lines to beautify
BTCUSDT 1day Chart, for Long-Term Investers
This is an example of using "90" because it is a 1-day chart and assumes that 3 months = 90 days in order to trail the highest and lowest prices over a 3-month period and no lines.
My past scripts are here:
RSI + FIB HH LL StopLoss Finder/Contrarian Trades
Fibonacci HH LL TRAMA Band

RSI + FIB HH LL StopLoss Finder/Contrarian TradesThis indicator is a multi-timeframe indicator that works in any timeframe.
It takes a price reading of the highest or lowest bar in the past based on Fibonacci numbers and plots it.
In addition, the RSI smoothed by a 5-day moving average can be used to detect signs that previous highs or lows will be reached in advance.
This gives insight into determining stop-loss values or entering the market in a contrarian manner.
This is an example of BTCUSDT 4Hour Chart
Here is BTCUSDT 1Hour Chart
For scalpers BTCUSDT 15min Chart Example
Fibonacci Number is 1, 1, 2, 3, 5, 8, 13, 21, 34, 55, 89, 144, 233, 377, 610, 987, 1597, ...
FIbonacci Ratio is 0.236, 0.382, 0.5, 0.618, 1, 1.618, 2.618, 4.236, ...

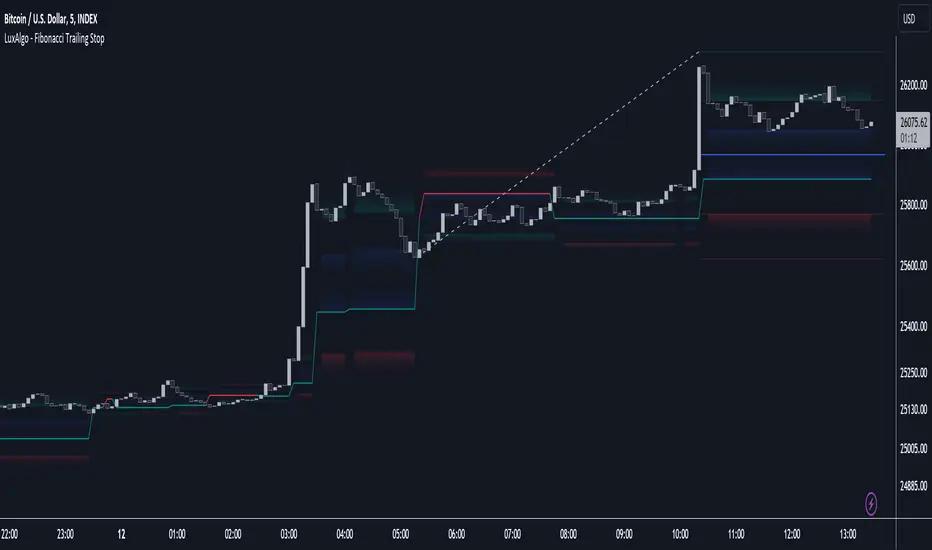
Fibonacci Trailing Stop [LuxAlgo]The Fibonacci Trailing Stop indicator creates a Trailing Stop, based on Fibonacci levels which are retrieved from the latest swing high & low . This provides a Trailing Stop-line .
🔶 USAGE
The Fibonacci Trailing Stop can indicate the current trend direction.
Shadows can also provide potential support/resistance areas.
Users can also display Fibonacci retracements.
🔶 CONCEPTS
🔹 Basic principles
There are 2 basic principles:
Every new swing will create or update a new Fibonacci pattern, potentially changing the Fibonacci Trailing Stop (FTS)
The Trend depends on whether the FTS is crossed/breached, the trigger is a chosen 'level/trigger'
(settings -> Fibonacci Trailing Stop -> Level/Trigger)
In an uptrend, these levels will be placed at the bottom half of the pattern.
In a downtrend, these levels will be placed at the top half of the pattern.
Once a trend is established, the Trailing Stop will only update in the direction of the trend:
Only higher when in an uptrend
Only lower when in a downtrend
If a Trailing Stop line is broken, the trend shifts to the other direction
The FTS line is accompanied by a secondary line (colour-filled), created by smaller swings (half of L/R, rounded to above)
EXAMPLES
• New bullish Trend/pattern
• Updating later on
• Bearish Trend -> breached -> New bullish Trend -> Trend is updated later on, and is breached at the end:
• Trend broken -> new Trend/direction:
• Bearish Trend -> breached -> New bullish Trend -> breached -> New bearish Trend (Here you see the latest cross of the bullish trend)
🔹 Shadows & latest Fibonacci
The indicator contains the option to show:
Latest Fibonacci
Shadows : previous Fibonacci Levels (will only appear after a 1 bar delay)
Shadows can be very useful to provide support/resistance areas, especially from large shadow-blocks .
When shadows are enabled, the color fill of Latest Fibonacci and FTS will be removed, this to provide less clutter:
🔶 SETTINGS
🔹 Swings
L: set left of pivothigh / pivotlow
R: set right of pivothigh / pivotlow
Swing labels: show labels of swings (updated in the same direction)
🔹 Fibonacci Trailing Stop
Level - Toggle - Custom value
• Choose pré-set levels [ -0.5, -0.382, -0.236 , 0, 0.236, 0.382, 0.5, 0.618 ]
• Choose custom level -> Toggle enabled and adjust the number at the right
Trigger: set trigger for breaching the FTS, close or wick (high in downtrend/low in uptrend)
🔹 Fibonacci
Latest Fibonacci: show Latest Fibonacci
Shadows: show Shadows
Max - min - ML - top/bottom GPThis script keeps track of historical max's and min's and calculates the midline and top/bottom GP fibs off that.
The way it calculates max/mins is unique as it's a two-step customizable process. In settings, there are two adjustable parameters; length and lookback.
The length parameter defines how many candles the max/min will be saved for. If the last recorded max/min happened longer than the length variable it will reset.
The lookback parameter comes into play when a max/min is reset. It simply looks back x candles and gets the new max/min from that

Doji TrenderDoji Trender searches multiple timeframes for candles where open and close are less than dojiPercent apart (default 0.025%), and plots the trends between them.
Experiment with dojiPercent to change the number of "dojis" detected. I will add doji sub-type indication if it appears to be meaningful.
By default, it plots the 5m (red), 15m (orange), 1h (yellow), 4h (green), and chart (cyan). If the chart timeframe is any of the configurable ones, the chart copy won't be drawn. (I might reverse that, so that cyan is always drawn.)
Since doji points are somewhat sparse, and the lookback is short (default 10), the EMA's make drastic corrections toward new indecision. (I'm not convinced the EMA's are useful and/or relevant.)
This works on any timeframe, but seems to work best on the 1D. (5m is somewhat irrelevant on the 1D, so there are tweaks to be made.)
Dojis from a timeframe are corrections to a doji trend from a higher timeframe.
Red corrects to orange, corrects to yellow, corrects to green.
If the chart timeframe is > 4h, the others will correct to cyan.
Otherwise, cyan will fit in-between the adjacent timeframes.
Multiple indecision candles within a short timespan forming sharp peaks indicate retests, backtests, rejections, and bounces off of support/resistance.
With a correct larger-timeframe channel, one would expect lower-timeframe indecision at/along typical levels.
Although the doji's have unpredictable wicks, the dots printed by this indicator do not. Matched with volume, they reveal the prices where the most violent battles between bulls and bears took place, and are likely to take place, again.
One could:
1) Put trends on the longest segments, then look for confluence along them, and/or near the intersections.
2) Use lower-timeframe doji trends to estimate the direction of the higher-timeframe doji trends, before they become detectable to Doji Trender. Confirm by looking for confluence where those trends intersect with horizontal support/resistance, this indicator, and/or others.
3) Notice that multiple legs on the same trend line are close to parallel, if not colinear.
4) Notice that many of the doji segments point toward (very-distant) future dojis.
5) Drop horizontal lines on the dots where we previously reversed, and find confluence in VRVP when we revisit them.
6) Create parallel (fib/whatever) channels that more-closely match MM's intent. The segments one uses to set the angle of the channel, and those used to align the channel, vertically, are not always the same:
a) Match the channel slope to as many doji slopes as possible, considering every trend.
b) Figure out where the channel actually belongs, re-considering every trend.

Fibo Levels with Volume Profile and Targets [ChartPrime]The Fib Levels With Volume Profile and Targets (FIVP) is a trading tool designed to provide traders with a unique understanding of price movement and trading volume through the lens of Fibonacci levels. This dynamic indicator merges the concepts of Fibonacci retracement levels with trading volume analytics to offer predictive insights into potential price trajectories.
Features:
1. Fibonacci Levels: The FPI showcases three prominent Fibonacci levels on both sides of the current price, offering an intricate picture of potential support and resistance levels.
2. Support and Resistance Recognition: Harnessing the power of Fibonacci levels, the FPI provides traders with potential areas of support and resistance, aiding in informed decision-making for entries, exits, and stop placements.
3. Customizable Timeframe Settings: In order to cater to different trading strategies and styles, users can manually select their preferred timeframe for the Fibonacci calculations, ensuring optimal relevance and accuracy for their trading approach.
4. Volume Analytics: One of the standout features of the FIVP is its ability to calculate trading volume for every bar that is sandwiched between the top and lower Fibonacci levels. This ensures traders have a clear vision of where the majority of trading activity is occurring, lending weight to the credibility of the displayed support and resistance zones.
5. Volume-Derived Price Targeting: The Possible Target Arrow function is an innovative feature. By analyzing and comparing the trading volume in the bearish and bullish zones, it provides an arrow indicating the potential direction the market might take. If the bull volume surpasses the bear volume, the market is likely skewing bullish and vice versa.
Usage
Ideal for both novice and seasoned traders, the FPI offers a rich tapestry of information. It allows for refined technical analysis, more precise entries and exits, and a holistic view of the interplay between price and trading volume. Whether you're scalping, day trading, or swing trading, the Fibonacci Profile Indicator is designed to enhance your trading strategy, providing a comprehensive perspective of the market's potential movements.

Auto Fibonacci TP Levels [WJ]This script automatically draws Fibonacci levels on a trading chart which are popular tools for traders seeking to identify potential areas of support and resistance.
Here are the features and benefits of this script:
1. Versatility in Sourcing Trade Entries:
Trade source can be customized to either longs (buying trades) or shorts (selling trades). The user has the flexibility to adjust their entry points based on their trading strategy.
Up to 2 sources can be used, expand if you wish.
As it is coded now, the source you have to pick from has to have a 'plot' that sends a (long) or (short) and is equal to 1 and 2 respectively.
Example: In the script you want to use for Long and Shorts, make a plot like this:
plot(LONG ? 1 : SHORT ? 2 : 0, title = "⭐ Outbound signal", display = display.none, editable = false)
The variable name of the LONG and SHORT needs to be the same as the one your code is using to indicate those trades.
2. Flexible Fibonacci Start Points:
The starting points for drawing Fibonacci levels can be customized for both longs and shorts.
3. Configurable Historical Data Length:
Users can adjust the number of historical bars to analyze for calculating higher highs (HH) and lower lows (LL).
4. Informative Labels and Lines:
The script can be configured to show the distance from the entry point to the 0.618 Fibonacci level (the so-called "golden ratio"). This helps traders to visualize the risk-reward ratio of their trades.
It indicates when a Fibonacci level was crossed which could signal a potential reversal.
It allows users to display the golden pocket levels only (0.618 and 0.65) or all the Fibonacci levels.
5. Customizable Fibonacci Levels and Colors:
Users can define their preferred Fibonacci levels and assign specific colors to each of these levels. This helps in identifying different levels quickly and intuitively.
The script also includes functionality for setting stop loss levels for short and long positions, which helps in risk management.
6. Clear Visualization of Crossing Levels:
If a trade crosses a specific Fibonacci level, the script draws lines indicating the crossing. This can help traders to identify potential breakout or reversal points.
7. Calculation of Fibonacci Boxes:
For each Fibonacci level, the script creates a box that indicates the level's range on the chart. This visual aid can help traders to better understand the price movement within these levels.
8. Customizable Labels:
The script provides percentage difference labels at each Fibonacci level, displaying the difference between the price at that level and the price at the 0 Fibonacci level. This can help users quickly understand the price change in terms of percentage at each level.
9. Performance Efficiency:
The script uses arrays to store and manage the Fibonacci levels and their associated colors. This approach enhances the performance of the script, especially when processing a large amount of data.
10. Adaptability:
This script automatically adapts to market movements. When the price crosses a level, it identifies and records this event, aiding the trader's decision-making process.
Overall, this script is highly customizable, adaptable and provides a clear visual representation of important trading data, making it an effective tool for traders using Fibonacci levels in their strategies.
NOTE: If you can't see the fib lines, it is because they have already been triggered/touched by a candle and they are set to not continue after they are touched.
Higher Fibonacci EMAOverall image:
If the closing price is higher than the three Fibonacci EMAs (uptrend):
Thanks to @ZenAndTheArtOfTrading and his indicator "Higher Timeframe EMA", URL =
This is a trend-discriminating indicator that uses 3 EMAs.
The Williams Alligator is the underlying philosophy, and we have applied it to capture the larger trend.
It is set up for the current time frame + 2 higher time frames.
One of the upper time legs has a daily EMA length of 13 Fibonacci numbers.
The top-level time leg has a weekly EMA with a length of 5 Fibonacci.
If the current closing price of the ticker leg is higher than these three EMAs, the bar color will be green. If it is lower, it will be red. If it is neither, it will be gray.
If the bar color is green, it suggests that the trend is upward. If it is red, you can consider entering short. If it is gray, it is best not to enter anything.

Dynamic Trailing Support & ResistanceDynamic Trailing Support & Resistance (DTSR) :
Hello Traders !!
DTSR is an objective dynamic support and resistance zone channel, Unlike subjective technical analysis DTSR finds S&R zones by calculating a range threshold within a given range over a specified lookback. FIB (Fibonacci) 38.2% and 61.8% retracement zones are also plotted for intermediate zones of resistance / support within the main resistance / support zones.
Plots
▾ <=> Close or high >= Trailing Resistance
▴ <=> Close or low <= Trailing Support
HH = The Highest High over the given Lookback period
LL = Lowest Low over the given Lookback period
Proximal Lines = The trailing S&R zones over the given lookback
Distal Lines = The HH or LL over the given lookback
DTSR Formula
note : This idea is not original to me, and was inspired by another creators work

Dual Dynamic Fibonacci Retracement — Long and Short Duration
Title : "The Dual-Dynamic Fibonacci Retracement Script: An Advanced Tool for Comprehensive Market Analysis"
As the author of the "Dual-Dynamic Fibonacci Retracement Script", I am delighted to introduce you to this cutting-edge tool for technical analysis. Unlike conventional Fibonacci scripts, this advanced model incorporates multiple unique features and adjustments that make it a powerful asset for any market analyst. Whether you're dealing with forex, commodities, equities or any other market, this script is versatile enough to enhance your trading strategy.
Uniqueness & Differentiation:
The "Dual-Dynamic Fibonacci Script" stands out by offering two distinct lookback periods. This feature is what separates it from other scripts available in the market. The first lookback period is longer, focusing on capturing broader market trends. The second lookback period is shorter, allowing for a more granular analysis of near-term market fluctuations. This dual perspective provides a more comprehensive view of the market, allowing you to see both the forest and the trees at the same time.
Fibonacci Levels:
While offering the standard Fibonacci retracement levels (0.236, 0.382, 0.5, 0.618, 0.786, and 1.0), the script also gives you the ability to plot 0.114 and 0.886 levels. These additional levels offer an extra layer of depth to your analysis, and can prove crucial in high-volatility markets where they often serve as significant support and resistance points.
Customizable Line Shifts and Extends:
This script provides options for customization of the shift and extension of the plotted lines. This means you can adjust the start and end points of the Fibonacci lines according to your personal trading style and strategy. This level of personalization is not typically available in other scripts, and it allows for a more tailored visual representation.
Flexible Trading Positioning:
Depending on whether the closing price is above or below the midpoint of the pivot high and pivot low, the Fibonacci retracement levels are adjusted accordingly. This ensures the script remains relevant and useful regardless of market conditions.
Clean Visualization:
To prevent clutter and maintain focus on the most relevant price action, the script removes old Fibonacci lines and plots new ones once a new pivot high or low is identified. This clean visualization helps keep your analysis focused and sharp.
How to Use the Script:
To get started, simply adjust the lookback periods according to your trading strategy. If you're a long-term investor or prefer swing trading, a longer lookback period might be appropriate. Conversely, if you're a day trader, a shorter lookback period might be more beneficial.
The "Shift" and "Extend" inputs allow you to control the positioning of the Fibonacci lines on your chart. Positive values shift the lines to the right, while negative values shift them to the left.
You also have the choice to plot the additional Fibonacci levels (0.114 and 0.886) via the "Plot 0.114 and 0.886 levels?" input. Similarly, the "Plot second set of levels?" input lets you decide whether to display the second set of Fibonacci levels derived from the shorter lookback period.
Like any technical analysis tool, this script is most effective when used in conjunction with other indicators and methods of analysis. It is designed to work well in trending markets, where Fibonacci retracements can often indicate potential reversal levels. However, it's always recommended to use a holistic approach to market analysis to maximize the likelihood of successful trades.
Note: the two lines drawn on the chart are there to help the user identify the levels from which the two respective Fib sequences are calculated.
~~~
Input Explanations:
Long Period Pivot High/Low Lookback and Short Period Pivot High/Low Lookback : These settings determine the length of the lookback periods for the long-term and short-term pivot points, respectively. A pivot point is a technical analysis indicator used to determine the overall trend of the market over different time frames. The pivot points are then used to calculate the Fibonacci levels. A longer lookback period will identify pivot points over a broader time frame, capturing major market trends, while a shorter lookback period will identify pivot points over a narrower time frame, capturing more immediate market movements.
Long Period Fibonacci Level Shift and Short Period Fibonacci Level Shift : These inputs control the shift of the Fibonacci levels based on the long and short lookback periods, respectively. If you want to shift the Fibonacci levels to the right, increase the value. If you want to shift the Fibonacci levels to the left, decrease the value. This allows you to adjust the Fibonacci levels to better align with your analysis.
Long Period Fibonacci Level Extend and Short Period Fibonacci Level Extend : These inputs control the extension of the Fibonacci levels based on the long and short lookback periods, respectively. If you want the Fibonacci levels to extend further to the right, increase the value. If you want the Fibonacci levels to extend less to the right, decrease the value. This feature provides the flexibility to adjust the length of the Fibonacci levels according to your personal trading preferences and strategy.
Plot 0.114 and 0.886 levels? : This setting gives you the ability to plot the additional 0.114 and 0.886 Fibonacci levels. These levels provide extra depth to your analysis, particularly in highly volatile markets where they can act as significant support and resistance levels.
Plot second set of levels? : This input allows you to decide whether to plot the second set of Fibonacci levels based on the short lookback period. Displaying this second set of levels can provide a more granular view of market movements and potential reversal points, enhancing your overall analysis.

Volatility Percentile (H-LINES)A simple script that adjusts the Volatility Percentile Indicator visibly in order to better accommodate entries/exits and certain trading setups/strategies.
--------------------------------------------------------------------------------------------------------------------------------------------------------
TL;DR - Remember after a full reset, we are looking for initial crosses UP on the UpperSwingline and crosses DOWN on the LowerSwingline for primary and secondary signal derivation.
Vice versa also works great but the prior method mentioned is a little more consistent in my experience, but you should mess around and optimise this for your own setups and strategies anyway.
--------------------------------------------------------------------------------------------------------------------------------------------------------
ORIGINAL SCRIPT HERE:
^Click image for a redirect to that script.
ALL CREDIT GOES TO: www.tradingview.com
He wrote everything so give credit where it's due, good bit of kit this here script is.
--------------------------------------------------------------------------------------------------------------------------------------------------------
HOW I USE MY VISUALLY ALTERED VERSION OF THIS SCRIPT
First of all, the alterations I've made seem only to be consistently viable with renko charts though if you can get the sought after results using candles or any other chart type then perfect, but be wary. All my back-testing done only with LinReg, HMA and SWMA - ATR type settings exclusively on renko charts. The changes I've made to the original script essentially just turns it visibly into an oscillator and uses a couple horizontal lines to generate signals, very simple - absolutely nothing has changed in the actual code of calculating this indicator.
What I believe my adjustments have achieved is quite simple. A full reset/oscillation on the indicator tries to map the strongest parts of a move or at least the part of the move where volume and the rate of transactions is at its peak to even facilitate said move. *take this statement with a pinch of salt though I do believe it's interacting with accumulation/distribution patterns, which is expected of volatility*
For ease of communication let's refer to the area between the the first UpperSwingline cross to the subsequent LowerSwingline cross, as the primary move. Then afterwards when it crosses the UpperSwingline again to make the full reset, the area in between those two points referred to as the secondary move.
Though more interestingly/practically the indicator ends up giving you two signals. In order for this to work we have to first decide that a spike up in volatility which crosses the UpperSwingline implies a significant level of interest at that price level. Usually that means a reversal is brewing, if price has already moved, trended and is approaching a certain area of value; which causes a spike of new positions to be taken, then you know that this is a level where contrarians are looking to enter. Now here's the tricky part, when volatility crosses the LowerSwingline price action becomes a little more open for interpretation, the way I personally like to look at this secondary signal is the potential for an exhaustion period to prolong itself a little longer. I know that's not the perfect analysis for what's going on, a more in-depth look into what's going on would best be described using Elliott Wave Theory, if a cross on the UpperSwingline near a significant area of value gives us a reversal trade lets just assume for the sake of argument that a new Elliott Wave can begin forming here. Making the move from that initial UpperSwngline cross to the cross on the LowerSwingline, the area that encompasses those two points: the impulse wave. After this point my analogy kind of falls apart and sadly my knowledge just isn't what it needs to be in order for me to properly analyse what's going on here but I must digress. Price after crossing the LowerSwingline up until the point where it makes a full reset by crossing the UpperSwingline again, within this area price seems to do either one of two things:
Situation 1 - Most likely occurs after a major trend reversal from major support/resistance or area of value (price has trended to new territory, maybe spent time a little time consolidating but hasn't broken the key level, momentum shifts, price action breaks current structure and you get the signal that primary move is a reversal) = Exhaustion Period, price will continue in direction of primary move during the secondary move. This here is for our trend-followers, you wanna take a continuation trade? Just wait for the pullback/rally to hit a FiB retracement level and enter - or any other means to find a decent support/resistance to enter.
Situation 2 - Most likely occurs when market enters a range or consolidation (price was previously seen as being at either a discount or premium so Situation 1 could have already played out and now you're looking at a full reset after that, imagine this spot to be the centre line of a linear regression channel or bang in the middle of your range, could even occur if price breaks a key moving average and decides it ought to consolidate around it for a while. Basically at any point where a somewhat prolonged consolidation is expected and not a quick reversal) = Corrective Wave, price will move against the direction of primary move during the secondary move. Now you might be expecting me to say this ones for you reversal traders but not really, if this is occurring then there probably isn't a definitive direction the market has chosen so you can use this opportunity to take range trades in the direction or against the direction of whatever the current trend or latest trend was depending on whatever slight bias you may have. <--- Situation 2 is very useful for finding cleaner entries if you do have a trend bias, say price underwent Situation 1, is now at key moving average but your bias is that it will break and continue up, so you wait and allow the secondary move of Situation 2 to take your entry to a much better R:R before entering a position.
--------------------------------------------------------------------------------------------------------------------------------------------------------

RedK EVEREX - Effort Versus Results ExplorerRedK EVEREX is an experimental indicator that explores "Volume Price Analysis" basic concepts and Wyckoff law "Effort versus Result" - by inspecting the relative volume (effort) and the associated (relative) price action (result) for each bar - showing the analysis as an easy to read "stacked bands" visual. From that analysis, we calculate a "Relative Rate of Flow" - an easy to use +100/-100 oscilator that can be used to trigger a signal when a bullish or bearish mode is detected for a certain user-selected length of bars.
Basic Concepts of VPA
-------------------------------
(The topics of VPA & Wyckoff Effort vs Results law are too comprehensive to cover here - So here's just a very basic summary - please review these topics in detail in various sources available here in TradingView or on the web)
* Volume Price Analysis (VPA) is the examination of the number of shares or contracts of a security that have been traded in a given period, and the associated price movement. By analyzing trends in volume in conjunction with price movements, traders can determine the significance of changes in price and what may unfold in the near future.
* Oftentimes, high volumes of trading can infer a lot about investors’ outlook on a market or security. A significant price increase along with a significant volume increase, for example, could be a credible sign of a continued bullish trend or a bullish reversal. Adversely, a significant price decrease with a significant volume increase can point to a continued bearish trend or a bearish trend reversal.
* Incorporating volume into a trading decision can help an investor to have a more balanced view of all the broad market factors that could be influencing a security’s price, which helps an investor to make a more informed decision.
* Wyckoff's law "Effort versus results" dictates that large effort is expected to be accompanied with big results - which means that we should expect to see a big price move (result) associated with a large relative volume (effort) for a certain trading period (bar).
* The way traders use this concept in chart analysis is to mainly look for imbalances or invalidation. for example, when we observe a large relative volume that is associated with very limited price change - that should trigger an early flag/warning sign that the current price trend is facing challenges and may be an early sign of "reversal" - this applies in both bearish and bullish conditions. on the other hand, when price starts to trend in a certain direction and that's associated with increasing volume, that can act as kind of validation, or a confirmation that the market supports that move.
How does EVEREX work
---------------------------------
* EVEREX inspects each bar and calculates a relative value for volume (effort) and "strength of price movement" (result) compared to a specified lookback period. The results are then visualized as stacked bands - the lower band represents the relative volume, the upper band represents the relative price strength - with clear color coding for easier analysis.
* The scale of the band is initially set to 100 (each band can occupy up to 50) - and that can be changed in the settings to 200 or 400 - mainly to allow a "zoom in" on the bands.
* Reading the resulting stacked bands makes it easier to see "balanced" volume/price action (where both bands are either equally strong, or equally weak), or when there's imbalance between volume and price (for example, a compression bar will show with high volume band and very small/tiny price action band) - another favorite pattern in VPA is the "Ease of Move", which will show as a relatively small volume band associated with a large "price action band" (either bullish or bearish) .. and so on.
* a bit of a techie piece: why the use of a custom "Normalize()" function to calculate "relative" values in EVEREX?
When we evaluate a certain value against an average (for example, volume) we need a mechanism to deal with "super high" values that largely exceed that average - I also needed a mechanism that mimics how a trader looks at a volume bar and decides that this volume value is super low, low, average, above average, high or super high -- the issue with using a stoch() function, which is the usual technique for comparing a data point against a lookback average, is that this function will produce a "zero" for low values, and cause a large distortion of the next few "ratios" when super large values occur in the data series - i researched multiple techniques here and decided to use the custom Normalize() function - and what i found is, as long as we're applying the same formula consistently to the data series, since it's all relative to itself, we can confidently use the result. Please feel free to play around with this part further if you like - the code is commented for those who would like to research this further.
* Overall, the hope is to make the bar-by-bar analysis easier and faster for traders who apply VPA concepts in their trading
What is RROF?
--------------------------
* Once we have the values of relative volume and relative price strength, it's easy from there to combine these values into a moving index that can be used to track overall strength and detect reversals in market direction - if you think about it this a very similar concept to a volume-weighted RSI. I call that index the "Relative Rate of Flow" - or RROF (cause we're not using the direct volume and price values in the calculation, but rather relative values that we calculated with the proprietary "Normalize" function in the script.
* You can show RROF as a single or double-period - and you can customize it in terms of smoothing, and signal line - and also utilize the basic alerts to get notified when a change in strength from one side to the other (bullish vs bearish) is detected
* In the chart above, you can see how the RROF was able to detect change in market condition from Bearsh to Bullish - then from Bullish to Bearish for TSLA with good accuracy.
Other Usage Options in EVEREX
------------------------------------
* I wrote EVEREX with a lot of flexibility and utilization in mind, while focusing on a clean and easy to use visual - EVEREX should work with any time frame and any instrument - in instruments with no volume data, only price data will be used.
* You can completely hide the "EVEREX bands" and use EVEREX as a single or dual period strength indicator (by exposing the Bias/Sentiment plot which is hidden by default) -
here's how this setup would look like - in this mode, you will basically be using EVEREX the same way you're using a volume-weighted RSI
* or you can hide the bias/sentiment, and expose the Bulls & Bears plots (using the indicator's "Style" tab), and trade it like a Bull/Bear Pressure Index like this
* you can choose Moving Average type for most plot elements in EVEREX, including how to deal with the Lookback averaging
* you can set EVEREX to a different time frame than the chart
* did i mention basic alerts in this v1.0 ?? There's room to add more VPA-specific alerts in future version (for example, when Ease-of-Move or Compression bars are detected...etc) - let me know if the comments what you want to see
Final Thoughts
--------------------
* EVEREX can be used for bar-by-bar VPA analysis - There are so much literature out there about VPA and it's highly recommended that traders read more about what VPA is and how it works - as it adds an interesting (and critical) dimension to technical analysis and will improve decision making
* RROF is a "strength indicator" - it does not track price values (levels) or momentum - as you will see when you use it, the price can be moving up, while the RROF signal line starts moving down, reflecting decreasing strength (or otherwise, increasing bear strength) - So if you incorporate EVEREX in your trading you will need to use it alongside other momentum and price value indicators (like MACD, MA's, Trend Channels, Support & Resistance Lines, Fib / Donchian..etc) - to use for trade confirmation

BB Mod + ForecastThis is a combination of two previous indicators; ALMA stdev band with fibs and Vector MACD.
Bollinger Band Mod fits the standard deviation on both sides of the center moving average ( ALMA +/- stdev / 2 ) and calculates Fibonacci ratios from stdev on both sides.
It is more averaging and more responsive at the same time compared to Bollinger Band.
Forecast is calculated from difference between origin ma ( ALMA from hl2 ) and six different period Hull moving averages averaged together and added to the center ma on both sides.
Fibonacci levels for 0.618 1.618 and 2.618 are added.
The dashed lines point towards the trend. Gives you a better idea of the current trend and momentum in the band.
Pin Candle DetectionPin candles are a variation of hammer candles that are useful in technical analysis . In particular, when combined with volume profile studies, they can be a powerful set up for long entries or other decision making.
For example, when looking at volume profiles, a long entry would be a fair value area (i.e. 40%) below the close of a pin candle. When combined with a support level , the set up is stronger.
While most scripts look for hammer candles, pin candles are somewhat different in that the length of the wick is significant.
This script and its parameters was built for ES futures 15 min chart in mind.
This script is unique in that it allows for the below parameters to be adjusted to suit other instruments and timeframes:
1. Fib level: Candle must close within a certain retracement level). My preference is 0.55. Some traders like 0.5, while others prefer 0.33
2. Wick length: Pin candles differ from pure hammers in that the length of the wick must be significant. My preference is 7 points on ES (as in $ and not ticks)
Add this script to your alerts to no longer miss these set ups.

RAhul RAJ Out of Range Trade IndicatorThis indicator is for intraday with the basic logic that any script will always trade in its range.
So , if any script moves away from its range, it will try to come back to its normal range movement.
Suppose average movement of any share is 100 points, and share has moved more than 150 points there is high probability that it will move in opposite direction in order to have average movement of price of 100.
For Stocks please use average period as 15 days for index 30 days.
If share price(YELLOW LINE) moves away from higher or lower blue line, then with the help of volume confirmation a trade can be initiated in opposite direction.
Please note direction needs to be opposite of what has happened in the day.
for eg. upper blue line could be broken , in both situation i.e.. share price is rising or falling,
so if share price is rising and upper blue line is broken:
Bearsish trade can be initiated with the help of price action n volume .
if share price has falledn and upper blue is broken:
Bullish trade can be initiated with the help of volume n price action confirmation.
Release Notes:
Remove dead code
update average period m fib level

Fibonacci Moving Averages Input(FibMAI) Fibonacci Moving Averages Input is a strategy based on moving averages cross-over or cross-under signals. The bullish golden cross appears on a chart when a stock's short-term moving average crosses above its long-term moving average. The bearish death cross appears on a chart when a stock’s short-term moving average, crosses below its long-term moving average. The general market consensus values used are the 50-day moving average and the 200-day moving average.
With the (FibMAI) Fibonacci Moving Averages Input strategy you can use any value you choose for your bullish or bearish cross. For visual display purposes I have a lot of the Fib Moving Averages 1, 2, 3, 5, 8, 13, 21, 34, 55, 89, 144, 233, 377, 610, 987 shown while hiding the chart candlesticks. But to use this indicator I click on only a couple of MA's to see if there's a notable cross-over or cross-under pattern signal. Then, most importantly, I back test those values into the FibMAI strategy Long or Short settings input.
For example, this NQ1! day chart has it's Long or Short settings input as follows:
Bullish =
FibEMA34
cross-over
FibEMA144
Bearish =
FibEMA55
cross-under
FibSMA144
As you can see you can mix or match 4 different MA's values either Exponential or Simple.
Default color settings:
Rising value = green color
Falling value = red color
Default Visual FibMA settings:
FibEMA's 1, 2, 3, 5, 8, 13, 21, 34, 55, 89, 144, 233, 377, 610, 987, 1597, 2584, 4181
Default Visual MA settings:
SMA's 50, 100, 150, 200
Default Long or Short settings:
Bullish =
FibEMA34
cross-over
FibEMA144
Bearish =
FibEMA55
cross-under
FibSMA144

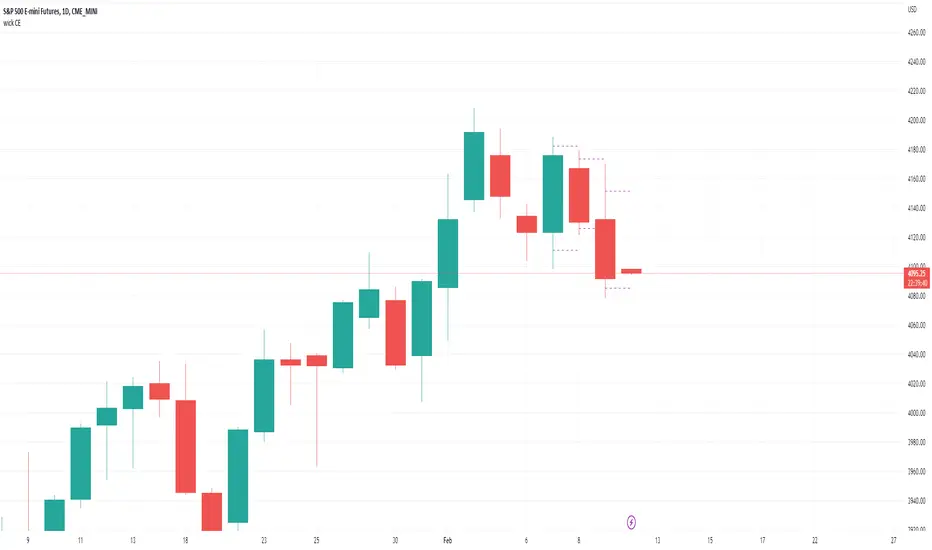
wick CE; plot candle wick and tail midpoint lines-Simple little tool to plot the wick CE: an ICT concept, consequent encroachment i.e. the midpoint line of a wick or tail; it being a potentially sensitive level (depending on context).
-Wrote this to save me time drawing out fib retracement to locate the precise level of the wick CE. Example usage: show indicator, add horizontal ray over favored wick CE level, hide indicator.
~choose how many consecutive bars back to plot wick CE lines.
~choose how many bars forward to extend the wick CE lines.
Fibonacci Breakout Target LevelsFibonacci Extension
Fibonacci Extension is a powerful technical analysis tool that traders use to predict where the market might find support and resistance. It is based on the Fibonacci sequence and uses levels that are found by extending the 23.6%, 38.2%, 50%, 61.8%, and 100% Fibonacci ratios from a swing high or low. These levels can be used to find possible areas of support and resistance, and traders often use them to figure out when to get into or get out of a trade.
What does this indicator do?
This indicator gets five levels of the Fibonacci Extension and uses it for both the low and the high. The default lookback period is 10 days, and it checks for the highest and lowest price in that period. Then it calculates the extension levels and plots them, and it also adds a line that shows you the current breakout target levels.
How to use?
The primary use intended for this indicator is to be used to determine possible breakout target levels. Let's say you are trading a range and a breakout happens. You can use this indicator to determine possible take-profit zones and possible support and resistance zones.
Features:
Change the lookback period for the Fibonacci Extension levels.
Disable the Fibonacci Bands if you just want to see the FIB levels.
You can also change the 5 levels and add different Fibonacci numbers.
In this image, you can see how you can use this indicator to determine take-profit levels. The Fibonacci Extensions will determine potential support and resistance levels, which could be good places to exit your long or short positions.
