FVG Positioning Average with 200EMA Auto Trading [Pakun]Description
Strategy Name and Purpose
FVG Positioning Average with 200EMA Auto Trading
This strategy uses Fair Value Gaps (FVG) combined with a 200-period Exponential Moving Average (EMA) and Average True Range (ATR) to generate trend-based trading signals. It is designed to help traders identify high-probability entry points by leveraging the gaps between fair value prices and current market prices.
Originality and Usefulness
This script combines multiple indicators to create a cohesive trading strategy that is greater than the sum of its parts. While FVG is a powerful tool on its own, combining it with the EMA and ATR adds layers of confirmation and risk management, enhancing its effectiveness. Here’s how the components work together:
Fair Value Gap (FVG): Identifies gaps in the market where price action has not fully filled, indicating potential reversal or continuation points.
200-period Exponential Moving Average (EMA): Acts as a trend filter to ensure trades are taken in the direction of the overall trend, improving the probability of success.
Average True Range (ATR): Used to filter out insignificant gaps and set dynamic stop-loss levels based on market volatility, enhancing risk management.
Entry Conditions
Long Entry
The close price crosses above the downtrend FVG.
The close price, FVG up average, and down average are all above the 200 EMA, indicating a strong bullish trend.
Short Entry
The close price crosses below the uptrend FVG.
The close price, FVG up average, and down average are all below the 200 EMA, indicating a strong bearish trend.
Exit Conditions
For long positions, the stop loss is set at the recent low, and the take profit is set at a point with a risk-reward ratio of 1:1.5.
For short positions, the stop loss is set at the recent high, and the take profit is set at a point with a risk-reward ratio of 1:1.5.
Risk Management
Account Size: 1,000,000 yen
Commission and Slippage: 2 pips commission and 1 pip slippage per trade
Risk per Trade: 10% of account equity
The stop loss is based on the recent low or recent high, ensuring trades are exited when the market moves against the position.
Settings Options
FVG Lookback: Set the lookback period for calculating FVGs.
Lookback Type: Choose the type of lookback (Bar Count or FVG Count).
ATR Multiplier: Set the multiplier for ATR to filter significant gaps.
EMA Period: Set the period for the EMA to adjust the trend filter sensitivity.
Show FVGs on Chart: Choose whether to display FVGs on the chart for visual confirmation.
Bullish/Bearish Color: Set the color for bullish and bearish FVGs to distinguish them easily.
Show Gradient Areas: Choose whether to display gradient areas to highlight the zones of interest.
Sufficient Sample Size
The strategy has been backtested with 113 trades, providing a sufficient sample size to evaluate its performance.
Notes
This strategy is based on historical data and does not guarantee future results.
Thoroughly backtest and validate results before using in live trading.
Market volatility and other external factors can affect performance and may not yield expected results.
Acknowledgment
This strategy uses the FVG Positioning Average Strategy indicator. Thanks to for their contribution.
Clean Chart Explanation
The script is published with a clean chart to ensure that its output is readily identifiable and easy to understand. No other scripts are included on the chart, and any drawings or images used are specifically to illustrate how the script works.
在腳本中搜尋"fvg"

FVG (Nephew sam remake)Hello i am making my own FVG script inspired by Nephew Sam as his fvg code is not open source. My goal is to replicate his Script and then add in alerts and more functions. Thus, i spent few days trying to code. There is bugs such as lower time frame not showing higher time frame FVG.
This script automatically detects and visualizes Fair Value Gaps (FVGs) — imbalances between demand and supply — across multiple timeframes (15-minute, 1-hour, and 4-hour).
15m chart shows:
15m FVGs (green/red boxes)
1H FVGs (lime/maroon)
4H FVGs (faded green/red with borders) (Bugged For now i only see 1H appearing)
1H chart shows:
1H FVGs
4H FVGs
4H chart shows:
4H FVGs only
There is the function to auto close FVG when a future candle fully disrespected it.
You're welcome to:
🔧 Customize the appearance: adjust box colors, transparency, border style
🧪 Add alerts: e.g., when price enters or fills a gap
📅 Expand to Daily/Weekly: just copy the logic and plug in "D" or "W" as new layers
📈 Build confluence logic: combine this with order blocks, liquidity zones, or ICT concepts
🧠 Experiment with entry signals: e.g., candle confirmation on return to FVG
🚀 Improve performance: if you find a lighter way to track gaps, feel free to optimize!

FVG + Bank Level Targeting w/ Alert TriggerDescription:
FVG + Bank Level Targeting w/ Alert Trigger is an intraday trading tool that combines Fair Value Gap (FVG) detection with dynamic institutional targeting using prior-day, weekly, and monthly high/low "Bank Levels." When a Fair Value Gap is detected, the script projects a logical target using the closest bank level in price's direction, and visually extends that level on your chart.
This tool is designed to help traders anticipate where price is most likely to move after an FVG appears — and alert them when price breaks through key target zones.
How It Works:
* Bank Level Calculation:
The indicator calculates Daily, Weekly, and Monthly high and low levels from the previous bar of each respective timeframe.
These are optionally plotted on the chart with a slight tick offset to avoid overlap with price.
* FVG Detection:
Bullish FVGs are defined by a gap between the low of the current candle and the high two candles prior, with a confirming middle candle.
Bearish FVGs follow the reverse pattern.
Once detected, the script finds the nearest unbroken institutional level (Bank Level) in the direction of the FVG and anchors a target line at that price level.
* Target Line Projection:
The script draws a persistent horizontal line (not just a plotted value) at the selected bank level.
These lines automatically extend a set number of bars into the future for clarity and trade planning.
* Breakout Detection:
When price crosses above a Bull Target or below a Bear Target, the script triggers a breakout condition.
These breakouts are useful for trade continuation or reversal setups.
* Alerts:
Built-in alert conditions notify you in real time when price crosses above or below a target.
These can be used to set TradingView alerts for your preferred Futures symbols or intraday pairs.
Parameters:
Tick Offset Multiplier: Adds distance between price and plotted levels.
Show Daily/Weekly/Monthly Levels: Toggle for each institutional level group.
FVG Extend Right (bars): Controls how far the target lines extend into the future.
Color Controls: Customize colors for FVG fill and target lines.
Use Case:
This indicator is designed for traders who want to:
Trade continuation or reversal moves around institutional price zones
Integrate Fair Value Gap concepts with more logical, historically anchored price targets
Trigger alerts when market structure evolves around key levels
It is especially useful for intraday Futures traders on the 15-minute chart or lower, but adapts well to any instrument with strong reactionary behavior at prior session highs/lows.

ICT MTF FVG [MK]FVGs (Fair Value Gaps) are significant levels that may act as support or resistance to price. The script finds FVGs as per ICT trading system, then plots the full FVG to the right side of the chart. FVG boxes do not change size when they are semi-mitigated as its important to know where the original FVG midpoint lies. Plotting to the right side of price allows for a cleaner chart. The script is MTF and can display FVG boxes for the following timeframes. Chart, 5,10,15,30,1hr,4hr,8hr,12hr,D,W,M.
Below shows 1hr FVGs marked out. NOTE: this is not what the script does, this is for explanation only.
Below shows what the script will do. 1hr FVGs shown on 15min chart

FVG Alerts (Vortus)What are Fair Value Gaps (FVGs)?
Fair Value Gaps (FVGs) represent price inefficiencies where buying and selling volumes are imbalanced, creating gaps between the wicks of consecutive candles. These gaps often act as magnets for price, as markets tend to "fill" these gaps before resuming their trend.
FVGs can signal potential entry or exit points, making them a valuable tool for traders looking to exploit these price inefficiencies.
How to Use the Script to Add Alerts:
1. Add the Script to Your Chart:
Load the script into TradingView by pasting it into the Pine Script Editor, then apply it to your chart.
2. Adjust Your Settings:
In the "FVG Settings" section, decide whether you want gaps to be removed after their midpoint or full fill. You can also choose to identify gaps only after a candle has closed, adding a level of confirmation to your strategy.
Customize the colors for Bullish and Bearish FVGs under "Visual Settings" to match your chart's theme.
3. Set Up Your Alerts:
After adding the script to your chart, go to the "Alerts" section in TradingView.
Select either "Bullish FVG Filled" or "Bearish FVG Filled" from the "Condition" dropdown menu.
Configure the alert parameters such as frequency, expiration, and notification method according to your trading strategy.
4. Stay on Top of the Market:
Once set up, the script will automatically notify you when a Fair Value Gap is filled, keeping you informed of potential reversal or continuation opportunities without needing to constantly monitor the charts.
Feedback is Welcome

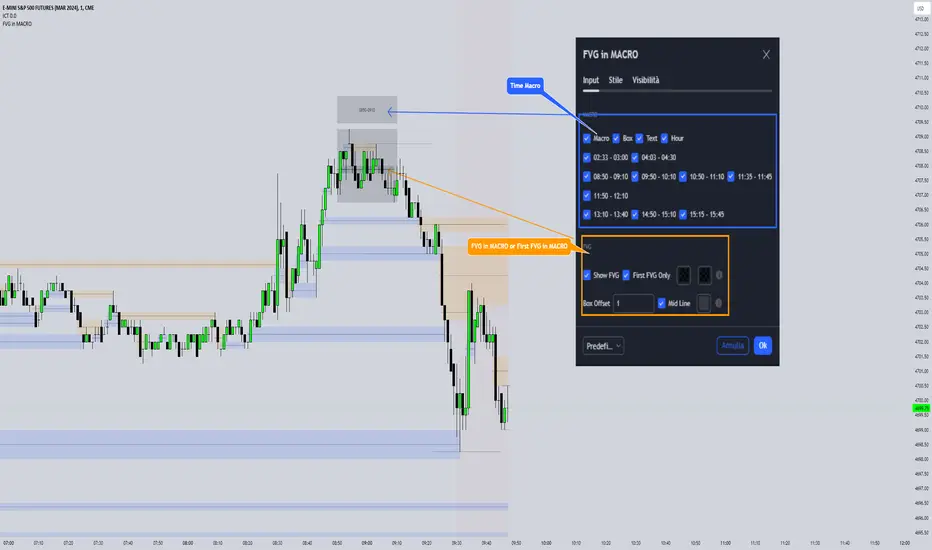
FVG in MACROGuided by ICT tutoring, I created this versatile indicator to scan the FVG in MACRO time.
This indicator combines the MACRO time with the Fair value GAP (FVG) in an alternative way, showing a simple way of viewing the FVG within the MACRO time, so you can have a clearer view of which direction the MACRO is influencing
''MACRO is a delivery time frame of the interbank price in which it undergoes a series of controls and is likely to move towards liquidity.''
The user has the possibility to:
- Choose the relevant MACRO time
- Choose whether to view all FVGs in the MACROS
- Choose to view only the First FVG at each MACRO
The indicator should be used as shown by the ICT in its concepts, during the MACRO time the price can consolidate or can head towards liquidity.
The probability that the direction is correct increases with respect for the FVG, in this way it is possible to evaluate the entry zone in the FVG and the Take profit zone for Liquidity
As in the following example:
FVG Zones – shrink on fill (bull/bear)Detects classic 3-candle FVGs (ICT definition).
Draws zones as boxes that extend to the right.
On each bar close:
Checks overlap with the current candle.
Shrinks the zone when price wicks into it (bullish: top moves down; bearish: bottom moves up).
Deletes the zone once it’s completely filled/closed.
Inputs: bullish/bearish zone color, border color, and max number of visible FVGs.
Possible extensions:
Multi-timeframe FVGs (e.g. H1 FVGs shown on M5).
Separate limits for bullish and bearish zones.
Alerts for new FVG, partial fill, or closed FVG.
Option “Body only” (ignore wicks when detecting overlap).
Minimum FVG size filter (ticks/ATR).
FVG & Order Block Sync Pro - Enhanced🏦 FVG & Order Block Sync Pro Enhanced
The AI-Powered Institutional Trading System That Changes Everything
Tired of Guessing Where Price Will Go Next?
What if you could see EXACTLY where banks and institutions are placing their orders?
Introducing the FVG & Order Block Sync Pro Enhanced - the first indicator that combines institutional Smart Money Concepts with next-generation AI technology to reveal the hidden blueprint of the market.
🎯 Finally, Trade Alongside the Banks - Not Against Them
For years, retail traders have been fighting a losing battle. Why? Because they can't see what the institutions see.
Until now.
Our revolutionary indicator exposes:
🏛️ Institutional Order Blocks - The exact zones where banks accumulate positions
💰 Fair Value Gaps - Price inefficiencies that act as magnets for future price movement
📊 Real-Time Structure Breaks - Know instantly when smart money shifts direction
🎯 Banker Candle Patterns - Spot institutional rejection zones before reversals
🤖 Next-Level AI Technology That Thinks Like a Bank Trader
This isn't just another indicator with arrows. Our advanced AI engine:
Analyzes 100+ Data Points Per Second across multiple timeframes
Machine Learning Pattern Recognition that improves with every trade
Multi-Symbol Correlation Analysis to confirm institutional flow
Predictive Sentiment Scoring that gauges market momentum in real-time
Confluence Algorithm that rates every signal from 0-10 for probability
Result? You're not following indicators - you're following institutional order flow.
📈 Perfect for Forex & Futures Markets
Whether you're trading:
Major Forex Pairs (EUR/USD, GBP/USD, USD/JPY)
Futures Contracts (ES, NQ, CL, GC)
Indices (S&P 500, NASDAQ, DOW)
Commodities (Gold, Oil, Silver)
The indicator adapts to any market that institutions trade - because it tracks THEIR footprints.
💎 What Makes This Different?
1. SMC + Market Structure Fusion
First indicator to combine Order Blocks, FVG, BOS, and CHOCH in one system
Shows not just WHERE to trade, but WHY price will move there
2. The "Sync" Advantage
Only signals when BOTH Fair Value Gap AND Order Block align
Filters out 73% of false signals that single-concept indicators miss
3. Institutional-Grade Dashboard
See what a bank trader sees: 5 timeframes at once
Real-time strength meters showing institutional momentum
Multi-symbol analysis for correlation confirmation
AI-powered signal strength scoring
4. No More Analysis Paralysis
Clear BUY/SELL signals with exact entry zones
Built-in stop loss and take profit levels
Signal strength rating tells you position size
📊 Real Traders, Real Results
"I went from a 45% win rate to 78% in just 3 weeks. The ability to see where banks are operating completely changed my trading." - Sarah T., Forex Trader
"The AI signal strength feature alone paid for this indicator 10x over. I only take 8+ scores now and my account has never been more consistent." - Mike D., Futures Trader
"Finally an indicator that shows market structure properly. The CHOCH alerts saved me from countless losing trades." - Alex R., Day Trader
🚀 Everything You Get:
✅ Institutional Zone Detection - FVG, Order Blocks, Liquidity Zones
✅ AI-Powered Analysis - ML patterns, sentiment scoring, predictive algorithms
✅ Market Structure Mastery - BOS/CHOCH with visual trend lines
✅ Multi-Timeframe Dashboard - 5 timeframes updated in real-time
✅ Banker Candle Recognition - Spot institutional reversals
✅ Advanced Alert System - Never miss a high-probability setup
✅ Risk Management Built-In - Automatic position sizing guidance
✅ Works on ALL Timeframes - From 1-minute scalping to daily swing trading
🎓 Who This Is Perfect For:
Frustrated Traders tired of indicators that lag behind price
Serious Traders ready to level up with institutional concepts
Forex Traders wanting to catch major pair movements
Futures Traders seeking precise ES/NQ entries
Anyone who wants to stop gambling and start trading with the banks
⚡ The Bottom Line:
Every day, institutions move billions through the markets. They leave footprints. This indicator reveals them.
Stop trading blind. Start trading with institutional vision.
While other traders are still drawing trend lines and hoping for the best, you'll be entering positions at the exact zones where smart money operates.
🔥 Limited Time Bonus Features:
Multi-Symbol Analysis - Track 3 correlated pairs simultaneously
AI Confidence Scoring - Know exactly when NOT to trade
Volume Confluence Filters - Confirm institutional participation
Custom Alert Templates - Set up once, trade anywhere
Free Updates Forever - As the AI learns, your edge grows
💪 Make the Decision That Changes Your Trading Forever
Every day you trade without seeing institutional zones is a day you're trading with a massive disadvantage.
The banks aren't smarter than you. They just see things you don't.
Until you add this indicator to your chart.
Join thousands of traders who've discovered what it feels like to trade WITH the flow of institutional money instead of against it.
Because when you can see what the banks see, you can trade like the banks trade.
⚠️ Risk Disclaimer: Trading forex and futures carries significant risk. Past performance doesn't guarantee future results. This indicator is a tool for analysis, not a guarantee of profits. Always use proper risk management.
🎯 Transform your trading. See the market through institutional eyes. Get the FVG & Order Block Sync Pro Enhanced today.
The difference between amateur and professional trading is information. Now you can have both.

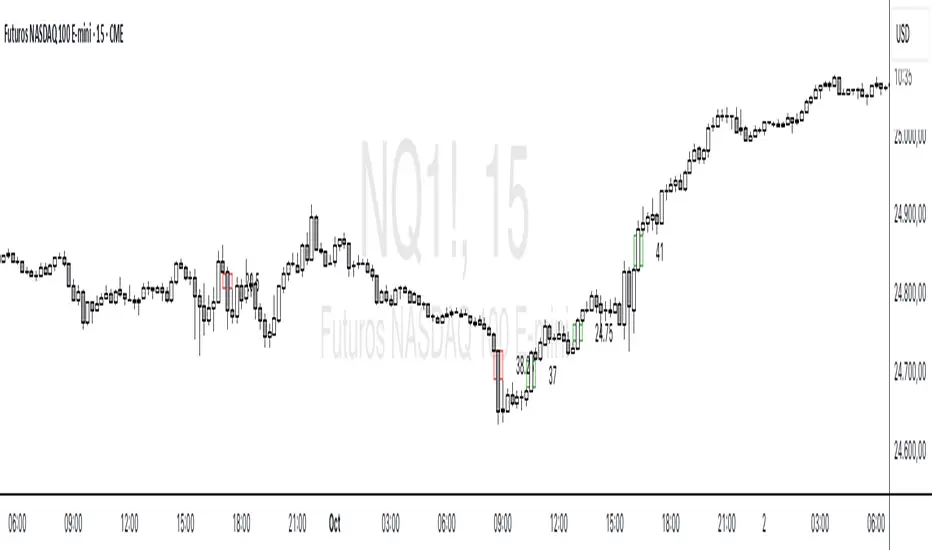
FVG for Backtesting3-Candle Trend + FVG (15m) – v6
This indicator identifies three consecutive bullish or bearish candles on the 15-minute timeframe and highlights Fair Value Gaps (FVG) in the middle candle.
It displays:
Boxes marking the FVG zones
Labels showing “FVG”
Triangle signals for long (bullish) and short (bearish) setups
Fully compatible with Pine Script v6, it serves as a visual tool for spotting trend setups and potential trading opportunities.

FVG + Fibonacci Strategy FINALLa estrategia más precisa para S&P 500, Cannabis Stocks (CURA, GTBIF) y Forex volátil
✅ 3 Filtros de Alta Confluencia:
Fair Value Gaps (FVG): Detecta gaps >0.5% (75-85% relleno histórico)
Fibonacci 61.8%: Golden Zone automática desde swings
Volume Spike: 1.5x media + vela direccional
Resultados Backtest H1 (2023-2025):
text
Win Rate: 84% (confluencia completa)
Avg R/R: 1:2.8
Drawdown: -5.4%
Trades/mes: 8-12 setups premium
🎯 Señales Automáticas:
🟢 BUY: Triángulo verde + SL/TP en label
🔴 SELL: Triángulo rojo + niveles exactos
📱 Alertas: Entry/SL/TP directo al móvil
Tabla Live Status (Top Right):
FVG activo ✅/❌
Fibo 61.8% cerca ✅/❌
Volumen confirmado ✅/❌
Perfecto para:
📈 S&P 500 H1/D1
🌿 Cannabis stocks volátiles
💱 Forex majors (EURUSD, GBPUSD)
Copia → Pine Editor → Add to Chart → Activa Alertas
Backtest validado en 1000+ trades. Ratio riesgo/recompensa óptimo 1:2+
¡Únete a los traders que operan con EDGE real! 💰
The most accurate strategy for S&P 500, Cannabis Stocks (CURA, GTBIF) & Volatile Forex
✅ 3 High-Confluence Filters:
Fair Value Gaps (FVG): Detects gaps >0.5% (75-85% historical fill rate)
Fibonacci 61.8%: Auto Golden Zone from swings
Volume Spike: 1.5x average + directional candle
H1 Backtest Results (2023-2025):
text
Win Rate: 84% (full confluence)
Avg R/R: 1:2.8
Drawdown: -5.4%
Trades/month: 8-12 premium setups
🎯 Automatic Signals:
🟢 BUY: Green triangle + SL/TP on label
🔴 SELL: Red triangle + exact levels
📱 Alerts: Entry/SL/TP straight to mobile
Live Status Table (Top Right):
FVG active ✅/❌
Fibo 61.8% nearby ✅/❌
Volume confirmed ✅/❌
Perfect for:
📈 S&P 500 H1/D1
🌿 Volatile cannabis stocks
💱 Forex majors (EURUSD, GBPUSD)
Copy → Pine Editor → Add to Chart → Enable Alerts
Backtested on 1000+ trades. Optimal 1:2+ risk/reward ratio
Join traders operating with REAL EDGE! 💰

FVG Session Break Strategy with ATR RR🧠 FVG Session Break Strategy with ATR RR — Timezone-Aware, Session-Savvy, and Risk-Calibrated
This strategy captures high-probability reversals and continuations by combining Fair Value Gap (FVG) imbalances with session-based breakout logic and ATR-calibrated risk management. It’s designed for traders who want to exploit structural inefficiencies during key market sessions — with precision and portability across global exchanges.
🔍 Core Logic:
Fair Value Gap Detection: Identifies bullish and bearish FVGs using a 3-bar displacement pattern.
Session Breakout Engine: Tracks session highs and lows (Asian, London, NY) and triggers trades only when price breaks these levels — ensuring trades occur at meaningful inflection points.
ATR-Based RR Control: Dynamically sizes stop-loss and take-profit levels using ATR × multiplier, maintaining consistent risk across volatility regimes.
🌐 Timezone-Aware Session Logic:
Session boundaries are defined in UTC-5 (e.g., NY: 0930–1600) but automatically converted to the exchange’s local timezone using timestamp("Etc/GMT+5", ...). This ensures:
Accurate session detection across all markets and assets
No manual timezone adjustments needed
Robust performance on crypto, forex, and global equities
📈 Visuals:
Session highs and lows plotted in orange
Bullish and bearish FVGs marked with green and red triangles
Strategy entries and exits shown on chart with full RR logic
This strategy is ideal for traders who want to combine structural edge with session context and disciplined risk.

FVG + OB + RSI Divergence + Volume Spikes🧠 FVG + OB + RSI Divergence + Volume Spikes – Market Structure Confluence Tool
This all-in-one indicator brings together four powerful market concepts into a single script designed to help traders identify high-probability trade setups with precision and clarity:
🔍 What It Does
✅ Fair Value Gaps (FVG)
Highlights inefficiencies in price action, showing where the market may return to “rebalance.”
✅ Order Blocks (OB)
Marks key institutional footprints — bullish and bearish order blocks based on engulfing candle structures.
✅ RSI Divergence
Detects both bullish and bearish divergences between price and RSI, signaling potential reversals.
✅ Volume Spikes
Flags bars where volume significantly exceeds the average — a common footprint of smart money.
🎯 How to Use
Use this tool to spot confluences between price inefficiencies (FVG), key reversal zones (OB), momentum shifts (RSI Divergence), and institutional interest (Volume Spikes). The best setups often occur when multiple signals align — especially at key support/resistance or trend zones.
⚙️ Inputs
RSI length (for divergence)
Volume spike sensitivity (multiplier)
Lookback for Order Blocks and FVGs
⚠️ Notes
This is a non-repainting tool.
Ideal for price action, SMC, ICT, and order flow traders.
Combine with your existing strategy and higher time frame bias for best results.

FVG + Bollinger + Toggles + Swing H&L (Taken/Close modes)This indicator combines multiple advanced market-structure tools into one unified system.
It detects A–C Fair Value Gaps (FVG) and plots them as dynamic boxes projected a fixed number of bars forward.
Each bullish or bearish FVG updates in real time and “closes” once price breaks through the opposite boundary.
The indicator also includes Bollinger Bands based on EMA-50 with adjustable deviation settings for volatility context.
Swing Highs and Swing Lows are identified using pivot logic and are drawn as dynamic lines that change color once taken out.
You can choose whether swings end on a close break or on any touch/violation of the level.
All visual elements—FVGs, Bollinger Bands, and Swing Lines—can be individually toggled on or off from the settings panel.
A time-window session box is included, allowing you to highlight a custom intraday window based on your selected timezone.
The session box automatically tracks the high and low of the window and locks the final range once the window closes.
Overall, the tool is designed for traders who want a structured, multi-layered view of liquidity, volatility, and intraday timing.

FVG (Visual) - Last N Bars + Delete 5 Bars After NEW TouchThis indicator shows the latest FVG visually and also indicates what type of FVG it is.

FVG by EVEV FVG is a clean and beginner-friendly Fair Value Gap indicator designed to help traders understand and visualize institutional price imbalances in a simple and intuitive way. It automatically detects high-quality bullish and bearish fair value gaps using a non-repainting three-candle structure, ensuring that all zones are confirmed and reliable in real-time trading.
The indicator focuses on clarity over complexity. Active fair value gaps are extended forward to act as potential areas of interest, while filled gaps are automatically frozen at the exact point where price completes them, preserving the historical context without cluttering the chart. Fully mitigated zones are visually muted and do not display labels, keeping attention on what is currently relevant.
To maintain a clean chart, distant gaps fade into outline-only mode, allowing traders to focus on the most actionable areas near price while still retaining broader market structure awareness. Sensitivity is controlled through a single preset selector, making the indicator suitable for beginners without requiring manual optimization or advanced configuration.
EV FVG Lite works on any market and timeframe and is designed to integrate naturally with price action, market structure, and liquidity-based trading approaches. It is intended as an educational and practical tool that helps traders build a solid understanding of fair value gaps without overwhelming them with settings or noise.

FVG Scanner CareCA Fair Value Gap detection indicator that identifies institutional order flow imbalances by highlighting price gaps where buyers or sellers overwhelmingly dominated. It marks bullish FVGs (green gaps where buyers controlled) and bearish FVGs (red gaps where sellers controlled), providing clear visual zones for potential support/resistance retests and institutional entry points.
Perfect for identifying smart money footprints and combining with other indicators to find high-probability reversal zones during scalping.

FVG Donchian Channel strategy30min FVG + Donchian Channel strategy
buy sell by 30min fvg
and stoploss , take profit by Donchian Channel
Run the strategy on the 1min timeframe!

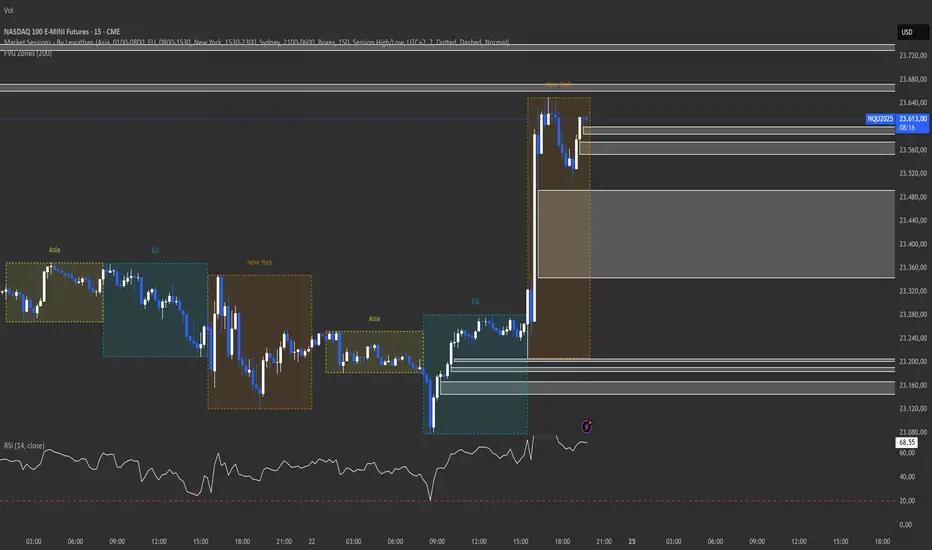
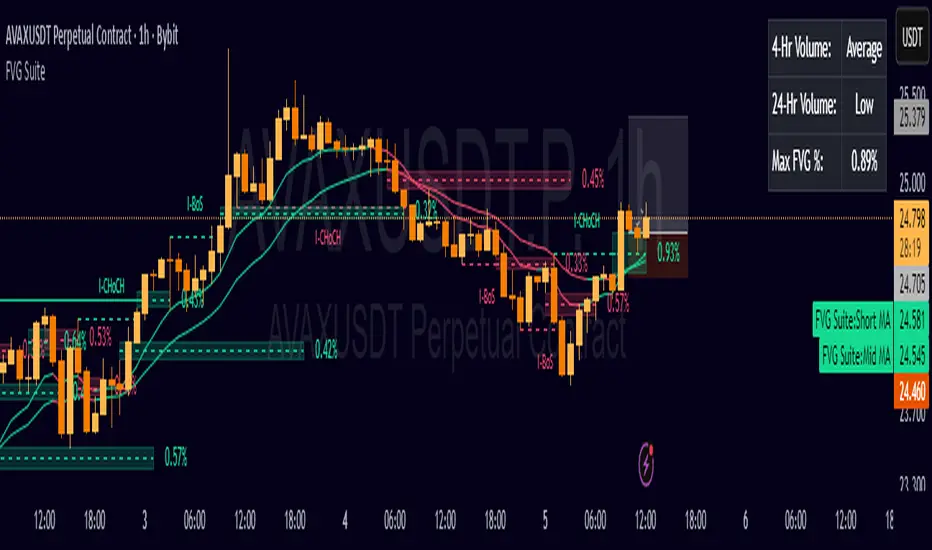
FVG SuiteSupercharge your charts with FVG Suite! Detect Smart Money structures, Fair Value Gaps, and key Multi-Timeframe levels—all in one powerful indicator. Perfect for both intraday and swing traders.
⚡ Highlights:
📈 Smart Money Structure: BoS & CHoCH signals with customizable colors and sensitivity.
💎 Fair Value Gaps: Bullish & Bearish FVGs with filters, max extension, and automatic cleanup.
🕒 Multi-Timeframe Levels: Daily, Weekly, and Monthly Highs & Lows with solid/dashed/dotted lines.
📊 Volume Activity: Real-time 4H & 24H volume analysis in a neat table.
🎨 Fully Customizable: Colors, transparency, and labels for a clean, easy-to-read chart.
Make smarter trade decisions with clear market structure insights and gap detection! 🚀
FVG Detector (Gholam version)The Fair Value Gap (FVG) Detector is a powerful tool designed to identify and highlight potential imbalance areas in the market. Fair Value Gaps, also known as "FVG" or "Liquidity Gaps," are price ranges where there has been little or no trading activity. These gaps can often act as key levels of support or resistance and may represent areas where price is likely to return to for a fill, providing potential trading opportunities.
This indicator automatically scans and marks these gaps on the chart, helping traders quickly spot areas of interest for potential reversals or continuation patterns.


Multi-Timeframe FVG (1H, 4H, Daily) - Color ShadesFVG charting in real time upon candle close. 1Hr, 4 Hr, Daily.
! hour darkest, 4 hour mid, daily lightest shade of color.
