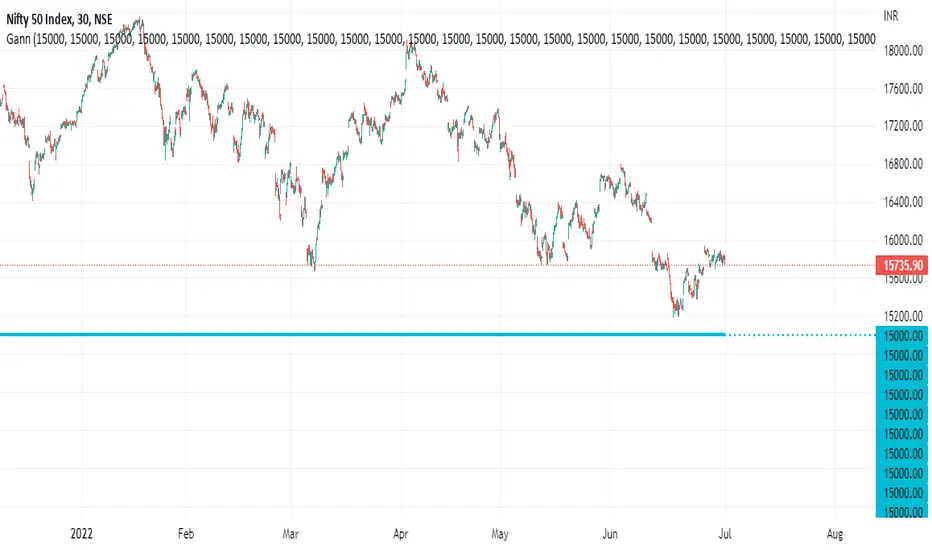
Gann Levels For Nifty Gann Levels for nifty 50 is very important to trade in options. so i create 50 gann levels for intraday trading.
在腳本中搜尋"gann"
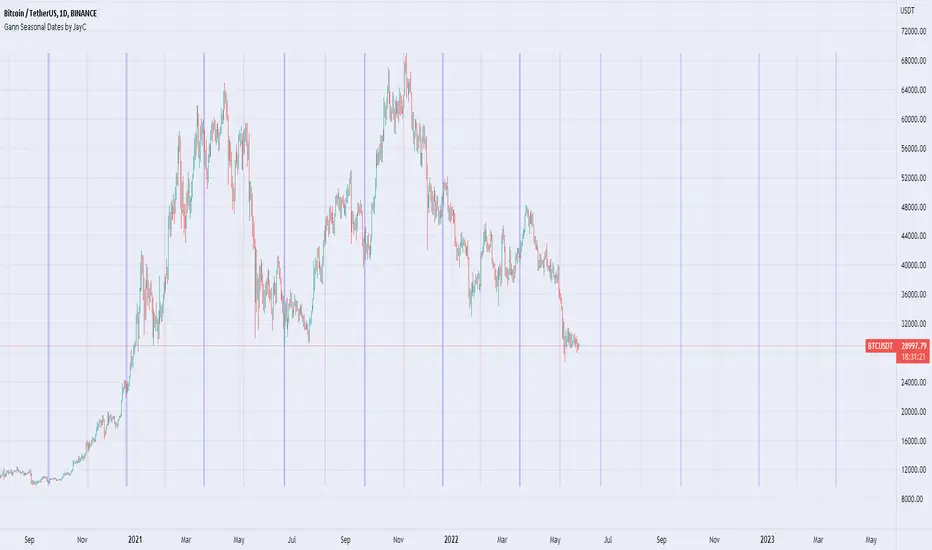
Gann Seasonal Dates by JayCThis script marks important seasonal dates with a vertical line that Gann used to watch for Trend changes.
March 21st
June 22nd
September 23rd
December 22nd
And 50% Levels - Minor seasonal dates.
February 4th
May 6th
August 8th
November 7th
In the settings you can change line colors and toggle the Offset. Offset is the way the script draws lines to show future dates, I offset by 365 so it will show incorrectly at some points in back testing.
WD Gann: Vertical Lines for Predefined Days/Bars AgoThis Pine Script draws vertical lines on the chart at specific time intervals, inspired by WD Gann’s theories of time cycles . WD Gann, a famous trader, believed that market movements were influenced by predictable time cycles. This script enables traders to visualize these key time cycles on the chart by placing vertical lines at predefined intervals (in bars ago), helping to identify potential turning points in the market.
The time intervals used in this script are inspired by Gann’s work, as well as astrological and numerological principles , which many traders believe influence market behavior . You can customize which time intervals (such as 3, 7, 9, 21, etc.) you want to track by enabling or disabling specific vertical lines on the chart.
Key Features:
Time Cycles Based on Gann’s Theory: Draws vertical lines at significant time intervals such as 3, 7, 9, 21, 27 bars ago, which are commonly used by Gann traders.
Astrological & Numerological Significance: The predefined intervals also align with key numerological and astrological values, allowing for a broader perspective on market cycles.
Customizable Intervals: You can choose which time intervals to display by enabling or disabling checkboxes for each cycle, allowing flexibility in chart analysis.
Visual Labels: Each vertical line is labeled with its corresponding "bars ago" value, providing clear reference points for the selected time cycles.
What Users Can Do:
Track and analyze market movements based on time cycles that are significant to Gann’s theory, as well as numerological and astrological influences.
Enable or disable vertical lines for specific cycles, like the 3-bar cycle, 9-bar cycle, or 365-bar cycle, depending on the intervals that align with your trading strategy.
Combine with other technical analysis tools and Gann techniques (e.g., Gann Angles, Gann Fans, or Square of Nine) for a more comprehensive trading approach.
This tool is designed for traders who believe in the power of time cycles to influence market behavior, and is especially useful for predicting turning points or key price movements based on these cycles.

Historical Swing High-Low Gann IndicatorThe Historical Swing High-Low Gann Indicator is a powerful tool designed to track and visualize key market swing points over time. This indicator identifies significant swing highs and lows within a specified time frame and draws connecting lines between these points, allowing traders to observe the natural ebb and flow of the market.
What sets this indicator apart is its ability to maintain all previously drawn swing lines, creating a comprehensive historical view of market movements. Additionally, the indicator projects Gann-style lines from the most recent swing highs and lows, providing traders with potential future support and resistance levels based on the geometric progression of price action.
Features:
Swing Detection: Automatically detects significant swing highs and lows over a user-defined period (default is 3 hours).
Persistent Historical Lines: Keeps all previously drawn lines, offering a complete visual history of the market's swing points.
Gann-Style Projections: Draws forward-looking lines from the latest swing points to help predict possible future market levels.
Customizable Parameters: Allows users to adjust the swing detection period to suit different trading styles and time frames.
This indicator is ideal for traders who rely on price action, support and resistance levels, and Gann theory for their analysis. Whether used in isolation or as part of a broader strategy, the Historical Swing High-Low Gann Indicator provides valuable insights into the market's behavior over time.

Gann Swing Strategy [1 Bar - Multi Layer]Use this Strategy to Fine-tune inputs for your Gann swing strategy.
Strategy allows you to fine-tune the indicator for 1 TimeFrame at a time; cross Timeframe Input fine-tuning is done manually after exporting the chart data.
MEANINGFUL DESCRIPTION:
The Gann Swing Chart using the One-Bar type, also known as the Minor Trend Chart, is designed to follow single-bar movements in the market. It helps identify trends by tracking price movements. When the market makes a higher high than the previous bar from a low price, the One-Bar trend line moves up, indicating a new high and establishing the previous low as a One-Bar bottom. Conversely, when the market makes a lower low than the previous bar from a high price, the One-Bar swing line moves down, marking a new low and setting the previous high as a One-Bar top. The crossing of these swing tops and bottoms indicates a change in trend direction.
HOW TO USE THE INDICATOR / Gann-swing Strategy:
The indicator shows 1, 2, and 3-bar swings. The strategy triggers a buy when the price crosses the previously determined high.
HOW TO USE THE STRATEGY:
Strategy to Fine-Tune Inputs for Your Gann Swing Strategy
This strategy allows for the fine-tuning of indicators for one timeframe at a time. Cross-timeframe input fine-tuning is done manually after exporting the chart data.
Meaningful Description:
The Gann Swing Chart using the One-Bar type, also known as the Minor Trend Chart, is designed to follow single-bar movements in the market. It helps identify trends by tracking price movements. When the market makes a higher high than the previous bar from a low price, the One-Bar trend line moves up, indicating a new high and establishing the previous low as a One-Bar bottom. Conversely, when the market makes a lower low than the previous bar from a high price, the One-Bar swing line moves down, marking a new low and setting the previous high as a One-Bar top. The crossing of these swing tops and bottoms indicates a change in trend direction.
How to Use the Indicator / Gann-Swing Strategy:
The indicator shows 1, 2, and 3-bar swings. The strategy triggers a buy when the price crosses the previously determined high.
How to Use the Strategy:
The strategy initiates a buy if the price breaks 1, 2, or 3-bar highs, or any combination thereof. Use the inputs to determine which highs or lows need to be crossed for the strategy to go long or short.
ORIGINALITY & USEFULNESS:
The One-Bar Swing Chart stands out for its simplicity and effectiveness in capturing minor market trends. Developed by meomeo105, this Gann high and low algorithm forms the basis of the strategy. I used my approach to creating strategy out of Gann swing indicator.
DETAILED DESCRIPTION:
What is a Swing Chart?
Swing charts help traders visualize price movements and identify trends by focusing on price highs and lows. They are instrumental in spotting trend reversals and continuations.
What is the One-Bar Swing Chart?
The One-Bar Swing Chart, also known as the Minor Trend Chart, follows single-bar price movements. It plots upward swings from a low price when a higher high is made, and downward swings from a high price when a lower low is made.
Key Features:
Trend Identification : Highlights minor trends by plotting swing highs and lows based on one-bar movements.
Simple Interpretation : Crossing a swing top indicates an uptrend, while crossing a swing bottom signals a downtrend.
Customizable Periods : Users can adjust the period to fine-tune the sensitivity of the swing chart to market movements.
Practical Application:
Bullish Trend : When the One-Bar Swing line moves above a previous swing top, it indicates a bullish trend.
Bearish Trend : When the One-Bar Swing line moves below a previous swing bottom, it signals a bearish trend.
Trend Reversal : Watch for crossings of swing tops and bottoms to detect potential trend reversals.
The One-Bar Swing Chart is a powerful tool for traders looking to capture and understand market trends. By following the simple rules of swing highs and lows, it provides clear and actionable insights into market direction.
Why the Strategy Uses 100% Allocation of a Portfolio:
This strategy allocates 100% of the portfolio to trading this specific pair, which does not mean 100% of all capital but 100% of the allocated trading capital for this pair. The strategy is swing-based and does not use take profit (TP) or stop losses.

nifty gann & 100 levelsnifty gannlevels with 100 points defference
gann levels with manual entry of cuurent gann level
manual entry of diffeence between two gann levels

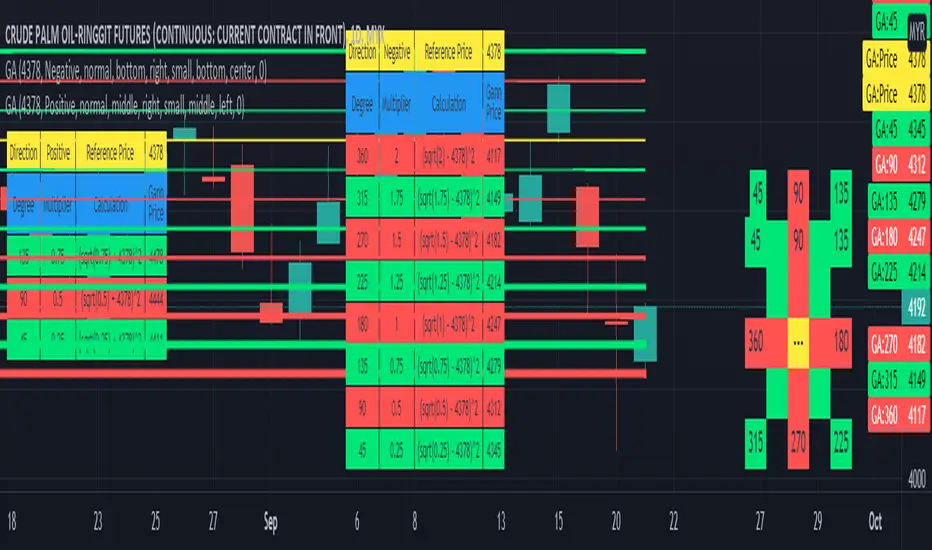
Gann Angle Table Calculator PlotterThis indicator was build upon based on Gann Angle and Gann Multiplier as refered of The Tunnel Thru The Air Or Looking Back From 1940, written by WD Gann .
Credits to FaizHebat for calculation.
Indicator features :
1. Font size from tiny to huge.
2. Table position.
3. Color for cell table and plot can be input or reversed.
4. Plot can be show or hide and also price can be track.
5. Able show currency and decimal price.
6. Gann table and Calculation table can show or hide.
7. Each Gann point can be hide including plot and calculation.
8. For desktop display only, not for mobile.
Pros :
1. Can be used as single or more indicator. (Chart show 2 same indicator with different setup)
Cons :
1. Price must be input before selecting any Gann Point.
FAQ
1. Credits
WD Gann , The Tunnel Thru The Air Or Looking Back From 1940
FaizHebat
2. Code Usage
Free to use for personal usage.
Positive direction with Currency and Decimal
Positive direction with Currency and Decimal
Dynamic Gann Fan & Cycle - Lite FrameworkFree Lite edition of a Gann-inspired structure framework.
Plots pivot-based Gann fan angles to visualize potential support/resistance “rails,” and highlights momentum regimes when price rides key angles (2x1 / 3x1).
This is not a buy/sell signal tool — it’s designed to provide chart context for discretionary traders studying structure.

Gann Square 9 Table Concept Alternate UIThis indicator was intended as educational purpose only for Gann Square 4, specifically to show Cross Cardinal.
This indicator was build upon The Tunnel Thru The Air Or Looking Back From 1940, written by WD Gann .
This build was improved by grouping similar values after selected to save time.
User Interface also was improved.
Indikator ini bertujuan sebagai pendidikan sahaja untuk Gann Square 4, khusus untuk menunjukkan Cross Cardinal.
Indikator ini dibina berdasarkan buku The Tunnel Thru The Air Or Looking Back From 1940, ditulis oleh WD Gann .
Binaan ini telah ditambah baik engan mengumpulkan nilai yang sama setelah dipilih untuk menjimatkan masa.
User Interface juga telah ditambah baik.
Indicator features :
1. Font size from tiny to huge.
2. For desktop display only, not for mobile.
3. All values can be selected by group.
Kemampuan indikator :
1. Saiz font dari paling kecil ke paling besar.
2. Untuk paparan desktop sahaja, bukan untuk mobile.
3. Semua nilai boleh dipilih secara berkumpulan.
FAQ
1. Credits / Kredit
WD Gann , The Tunnel Thru The Air Or Looking Back From 1940
Ganzilla
2. Page involved / Muka Surat terlibat
195 - 198
3. Code Usage / Penggunaan Kod
Free to use for personal usage.
Bebas untuk kegunaan peribadi.
4. Previous build / Binaan sebelum ini
Gann Square 9 Cross Cardinal Table Concept
5. Related build / Binaan berkaitan
Gann Square 4 Cross Cardinal Table Concept
Gann Square 4 Table Concept Alternate UI
Left : Even array number / Kiri : Array nombor genap
Right : Odd array number / Kanan : Array nombor ganjil
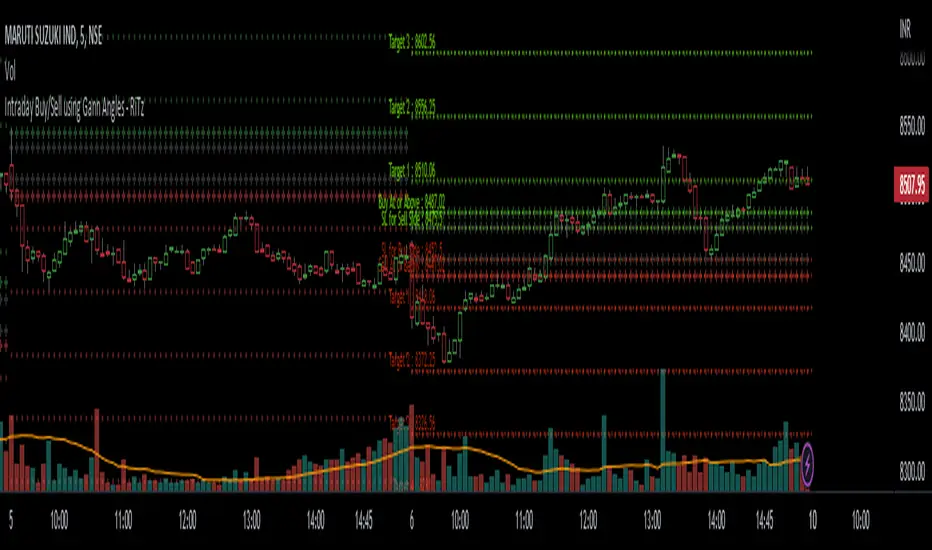
Intraday Buy/Sell using Gann Angles - RiTzIntraday Buy/Sell Levels using Gann Angles based on Todays Open/previous Day High/Low/Close prices
How to use this :
The Buy/Sell levels will be calculated on 1 of 4 things (you can choose any one which you prefer)
1. Todays Open price
2. Previous Day High
3. Previous Day Low
4. Previous Day Close
The Buy/Sell levels will be displayed in these ways
1. In a Table
2. on the Chart
You can turn them on/off according to your preference!
I can't seem to find the original documentation or a link to it.
i have it's excel file, in which we have to enter following data :
1. Todays Open price
2. Previous Day High
3. Previous Day Low
4. Previous Day Close
and the buy/sell levels are calculated by using the above data in following manner :
Based On Today's Opening Price
(lets call it TDO)
Degree's````````````````` Degree Factor```````````````````````` Buy````````````````````````` Sell
11.25```````````````````` =degree/180=11.25/180=0.0625````````` =(sqrt(TDO)-0.0625)^2``````` =(sqrt(TDO)+0.0625)^2````` SL
22.5````````````````````` =degree/180=22.5/180=0.125``````````` =(sqrt(TDO)+0.125)^2```````` =(sqrt(TDO)-0.125)^2`````` Buy/Sell At
45``````````````````````` =degree/180=45/180=0.25`````````````` =(sqrt(TDO)+0.25)^2````````` =(sqrt(TDO)-0.25)^2``````` Target-1
90``````````````````````` =degree/180=90/180=0.5``````````````` =(sqrt(TDO)+0.5)^2`````````` =(sqrt(TDO)-0.5)^2```````` Target-2
135`````````````````````` =degree/180=135/180=0.75````````````` =(sqrt(TDO)+0.75)^2````````` =(sqrt(TDO)-0.75)^2``````` Target-3
180`````````````````````` =degree/180=180/180=1```````````````` =(sqrt(TDO)+1)^2```````````` =(sqrt(TDO)-1)^2`````````` Target-4
225`````````````````````` =degree/180=225/180=1.25````````````` =(sqrt(TDO)+1.25)^2````````` =(sqrt(TDO)-1.25)^2``````` Target-5
270`````````````````````` =degree/180=270/180=1.5`````````````` =(sqrt(TDO)+1.5)^2`````````` =(sqrt(TDO)-1.5)^2```````` Target-6
315`````````````````````` =degree/180=315/180=1.75````````````` =(sqrt(TDO)+1.75)^2````````` =(sqrt(TDO)-1.75)^2``````` Target-7
360`````````````````````` =degree/180=360/180=2```````````````` =(sqrt(TDO)+2)^2```````````` =(sqrt(TDO)-2)^2`````````` Target-8
sqrt = square root
TDO = Today's Opening Price
PDH = Previous Days High
PDL = Previous Days Low
PDC = Previous Days Close
Based On Previous Days High Price
(lets call it PDH)
Degree's````````````````` Degree Factor```````````````````````` Buy````````````````````````` Sell
11.25```````````````````` =degree/180=11.25/180=0.0625````````` =(sqrt(PDH)-0.0625)^2``````` =(sqrt(PDH)+0.0625)^2````` SL
22.5````````````````````` =degree/180=22.5/180=0.125``````````` =(sqrt(PDH)+0.125)^2```````` =(sqrt(PDH)-0.125)^2`````` Buy/Sell At
45``````````````````````` =degree/180=45/180=0.25`````````````` =(sqrt(PDH)+0.25)^2````````` =(sqrt(PDH)-0.25)^2``````` Target-1
90``````````````````````` =degree/180=90/180=0.5``````````````` =(sqrt(PDH)+0.5)^2`````````` =(sqrt(PDH)-0.5)^2```````` Target-2
135`````````````````````` =degree/180=135/180=0.75````````````` =(sqrt(PDH)+0.75)^2````````` =(sqrt(PDH)-0.75)^2``````` Target-3
180`````````````````````` =degree/180=180/180=1```````````````` =(sqrt(PDH)+1)^2```````````` =(sqrt(PDH)-1)^2`````````` Target-4
225`````````````````````` =degree/180=225/180=1.25````````````` =(sqrt(PDH)+1.25)^2````````` =(sqrt(PDH)-1.25)^2``````` Target-5
270`````````````````````` =degree/180=270/180=1.5`````````````` =(sqrt(PDH)+1.5)^2`````````` =(sqrt(PDH)-1.5)^2```````` Target-6
315`````````````````````` =degree/180=315/180=1.75````````````` =(sqrt(PDH)+1.75)^2````````` =(sqrt(PDH)-1.75)^2``````` Target-7
360`````````````````````` =degree/180=360/180=2```````````````` =(sqrt(PDH)+2)^2```````````` =(sqrt(PDH)-2)^2`````````` Target-8
Based On Previous Days Low Price
(lets call it PDL)
Degree's````````````````` Degree Factor```````````````````````` Buy````````````````````````` Sell
11.25```````````````````` =degree/180=11.25/180=0.0625````````` =(sqrt(PDL)-0.0625)^2``````` =(sqrt(PDL)+0.0625)^2````` SL
22.5````````````````````` =degree/180=22.5/180=0.125``````````` =(sqrt(PDL)+0.125)^2```````` =(sqrt(PDL)-0.125)^2`````` Buy/Sell At
45``````````````````````` =degree/180=45/180=0.25`````````````` =(sqrt(PDL)+0.25)^2````````` =(sqrt(PDL)-0.25)^2``````` Target-1
90``````````````````````` =degree/180=90/180=0.5``````````````` =(sqrt(PDL)+0.5)^2`````````` =(sqrt(PDL)-0.5)^2```````` Target-2
135`````````````````````` =degree/180=135/180=0.75````````````` =(sqrt(PDL)+0.75)^2````````` =(sqrt(PDL)-0.75)^2``````` Target-3
180`````````````````````` =degree/180=180/180=1```````````````` =(sqrt(PDL)+1)^2```````````` =(sqrt(PDL)-1)^2`````````` Target-4
225`````````````````````` =degree/180=225/180=1.25````````````` =(sqrt(PDL)+1.25)^2````````` =(sqrt(PDL)-1.25)^2``````` Target-5
270`````````````````````` =degree/180=270/180=1.5`````````````` =(sqrt(PDL)+1.5)^2`````````` =(sqrt(PDL)-1.5)^2```````` Target-6
315`````````````````````` =degree/180=315/180=1.75````````````` =(sqrt(PDL)+1.75)^2````````` =(sqrt(PDL)-1.75)^2``````` Target-7
360`````````````````````` =degree/180=360/180=2```````````````` =(sqrt(PDL)+2)^2```````````` =(sqrt(PDL)-2)^2`````````` Target-8
Based On Previous Days Close Price
(lets call it PDC)
Degree's````````````````` Degree Factor```````````````````````` Buy````````````````````````` Sell
11.25```````````````````` =degree/180=11.25/180=0.0625````````` =(sqrt(PDC)-0.0625)^2``````` =(sqrt(PDC)+0.0625)^2````` SL
22.5````````````````````` =degree/180=22.5/180=0.125``````````` =(sqrt(PDC)+0.125)^2```````` =(sqrt(PDC)-0.125)^2`````` Buy/Sell At
45``````````````````````` =degree/180=45/180=0.25`````````````` =(sqrt(PDC)+0.25)^2````````` =(sqrt(PDC)-0.25)^2``````` Target-1
90``````````````````````` =degree/180=90/180=0.5``````````````` =(sqrt(PDC)+0.5)^2`````````` =(sqrt(PDC)-0.5)^2```````` Target-2
135`````````````````````` =degree/180=135/180=0.75````````````` =(sqrt(PDC)+0.75)^2````````` =(sqrt(PDC)-0.75)^2``````` Target-3
180`````````````````````` =degree/180=180/180=1```````````````` =(sqrt(PDC)+1)^2```````````` =(sqrt(PDC)-1)^2`````````` Target-4
225`````````````````````` =degree/180=225/180=1.25````````````` =(sqrt(PDC)+1.25)^2````````` =(sqrt(PDC)-1.25)^2``````` Target-5
270`````````````````````` =degree/180=270/180=1.5`````````````` =(sqrt(PDC)+1.5)^2`````````` =(sqrt(PDC)-1.5)^2```````` Target-6
315`````````````````````` =degree/180=315/180=1.75````````````` =(sqrt(PDC)+1.75)^2````````` =(sqrt(PDC)-1.75)^2``````` Target-7
360`````````````````````` =degree/180=360/180=2```````````````` =(sqrt(PDC)+2)^2```````````` =(sqrt(PDC)-2)^2`````````` Target-8
example based On Today's Opening Price = 4339
Degree's```````` Degree Factor```````` Buy`````````` Sell
11.25``````````` 0.0625``````````````` 4330.77`````` 4347.24```````` SL
22.5```````````` 0.125```````````````` 4355.48`````` 4322.55```````` Buy/Sell At
45`````````````` 0.25````````````````` 4372.00`````` 4306.13```````` Target-1
90`````````````` 0.5`````````````````` 4405.12`````` 4273.38```````` Target-2
135````````````` 0.75````````````````` 4438.37`````` 4240.76```````` Target-3
180````````````` 1```````````````````` 4471.74`````` 4208.26```````` Target-4
225````````````` 1.25````````````````` 4505.24`````` 4175.88```````` Target-5
270````````````` 1.5`````````````````` 4538.86`````` 4143.64```````` Target-6
315````````````` 1.75````````````````` 4572.61`````` 4111.51```````` Target-7
360````````````` 2```````````````````` 4606.48`````` 4079.52```````` Target-8
Note : ignore the '`' , inserted them to fill up the spaces , it was looking very weird!, tried to fix it as much as I can.
Note :- Please correct me if I'm wrong , as I've already mentioned I don't have it's original documentation.
if anyone can find it or already has it then please feel free to share it.
Jurik-Filtered, Gann HiLo Activator [Loxx]Jurik-Filtered, Gann HiLo Activator is a Gann HiLo activator that has been smoothed using Jurik Filtering to reduce noise and better identify trending markets.
What is Gann HiLo
The HiLo Activator study is a trend-following indicator introduced by Robert Krausz as part of the Gann Swing trading strategy. In addition to indicating the current trend direction, this can be used as both entry signal and trailing stop.
Here is how the HiLo Activator is calculated:
1. The system calculates the moving averages of the high and low prices over the last several candles. By default, the average is calculated using the last three candles.
2. If the close price falls below the average low or rises above the average high, the system plots the opposite moving average. For example, if the price crosses above the average high, the system will plot the average low. If the price crosses below the average low afterward, the system will stop plotting the average low and will start plotting the average high, and so forth.
The plot of the HiLo Activator thus consists of sections on the top and bottom of the price plot. The sections on the bottom signify bullish trending conditions. Vice versa, those on the top signify the bearish conditions.
What is Jurik Volty used in the Juirk Filter?
One of the lesser known qualities of Juirk smoothing is that the Jurik smoothing process is adaptive. "Jurik Volty" (a sort of market volatility ) is what makes Jurik smoothing adaptive. The Jurik Volty calculation can be used as both a standalone indicator and to smooth other indicators that you wish to make adaptive.
What is the Jurik Moving Average?
Have you noticed how moving averages add some lag (delay) to your signals? ... especially when price gaps up or down in a big move, and you are waiting for your moving average to catch up? Wait no more! JMA eliminates this problem forever and gives you the best of both worlds: low lag and smooth lines.
Ideally, you would like a filtered signal to be both smooth and lag-free. Lag causes delays in your trades, and increasing lag in your indicators typically result in lower profits. In other words, late comers get what's left on the table after the feast has already begun.
Included
-Toggle bar color on/off

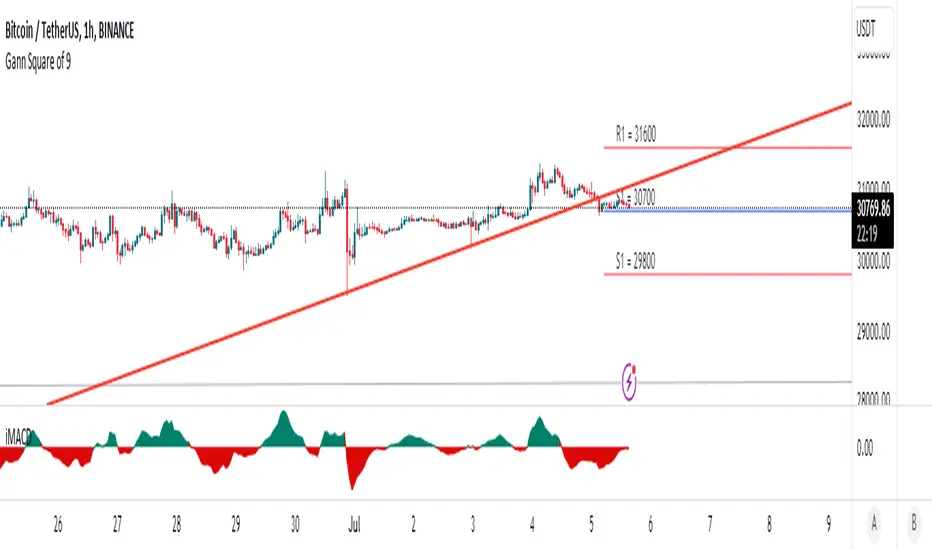
Gann Circle Swing LevelsThis indicator is based on W. D. Gann's Square of 9 Chart and can be interpreted as the Gann Circle / Gann Wheel / 360 Degree Circle Chart or Square of the Circle Chart.
Spiral arrangement of numbers on the Square of 9 chart creates a very unique square root relationship amongst the numbers on the chart. If you take any number on the Square of 9 chart, take the square root of the number, then add 2 to the root and re-square it, resulting in one full 360 degree cycle (i.e. a 360 degree Circle) out from the center of the chart.
For example,
the square root of 121 = 11,
11 + 2 = 13,
and the square of 13 = 169
The number 169 is one full 360 degree cycle out (with reference to 121) from the center of the Square of 9 chart.
Similarly, if you take any number on the Square of 9 chart, take the square root of the number, then subtract 2 from the root and re-square it, resulting in one full 360 degree inward rotation towards the center of the chart.
For example,
the square root of 565 = 23.77,
23.77 - 2 = 21.77,
and the square of 21.77 = 473.93 (approximately equal to 474, which is directly below 565 on the Square of 9 chart)
The number 474 is one full 360 degree inward rotation (with reference to 565) towards the center of the chart.
How to Use this Indicator ?
This indicator is useful for finding coordinate squares on the Gann Circle that are making hard aspects to a previous position (such as a significant top or bottom) on the circle.
Input :
Swing Point (Significant price point, such as a top or a bottom)
Low / High ? (Is it a bottom or a top)
Number of Gann Levels (Number of Gann Cycles to be projected)
Output :
Gann Support or Resistance Levels (color coded as follows) :
Swing High or Swing Low (BLUE)
Support levels calculated with reference to the Swing High (RED)
Resistance levels calculated with reference to the Swing Low (LIME)

Gann High Low Activator AlertsA Gann High Low Activator within a fixed range meant for alerts. A value of 1 means we're in an uptrend, a value of -1 a downtrend, and a value of 0 is neutral.
Thank you and happy trading

Gann Square of 9(For Bursa Malaysia only)
This indicator will display nearest support and resistance from Gann Square of 9 Box.
Red line (Strongest)
Resistance
Support
Blue line (Moderate)
Act as support and resistance
Only workable for price lower than RM18.
Gann Octave Pro - Angles & Time Cycles 🎯 Gann Octave Pro - Angles & Time Cycles
## Complete Gann Trading System - Price, Angles & Time in One Indicator
A professional-grade Gann analysis tool combining **Octave Price Levels**, **Gann Angles (1x1, 2x1, 1x2)**, and **Advanced Time Cycle Projections**. Perfect for traders seeking precision market timing through geometric confluence.
---
## 🌟 Key Features
### 📐 Octave Price Levels
- **5 Key Levels**: 0%, 25%, 50%, 75%, 100%
- **Color-Coded**: Green (support) → Blue (50% pivot) → Red (resistance) → Black (boundaries)
- **Dynamic Updates**: Auto-adjusts to swing structure
- **Trading Edge**: 50% level is the most powerful reversal zone
### 📏 Gann Angles
- **1x1 Angle** (Black) - Natural 45° trend line
- **2x1 Angle** (Red) - Steep acceleration zone
- **1x2 Angle** (Red) - Gradual support/resistance
- **Customizable Extension**: Fixed bars or % of swing length
### ⏰ Advanced Time Cycles
**Three Calculation Methods:**
1. **Angle-Level Confluence** ⭐ (Recommended)
- Calculates intersections of Gann angles with octave levels
- Most sophisticated timing system
- Based on price-time geometry
2. **Swing Duration** - Uses actual swing bar length
3. **Harmonic (Swing/8)** - Classic Gann harmonic division
**Cycle Visualization:**
- **Full Cycles** (Purple, solid) - Major turning points, labeled "◆ FC1 (176 bars) "
- **Sub-Cycles** (Blue, dotted) - Minor pivots, labeled "S1 "
- **Mid-Cycles** (Orange, dashed) - Half-cycle inflection points
- **Past Display**: Shows 4 complete past cycles for validation
- **Future Projection**: Projects 8 future cycles for anticipation
---
## 🎯 How to Use
### Quick Start
1. Apply to chart (works all timeframes/instruments)
2. Select period: Default 44 bars (adjust based on timeframe)
3. Choose cycle method: "Angle-Level Confluence" for best results
4. Observe past cycles to validate timing accuracy
### Trading Strategies
**Triple Confluence Setup** (Highest Probability)
- Price at octave level (especially 50%)
- Price touches Gann angle (1x1 most reliable)
- Time cycle arrives (full cycle preferred)
- **Entry**: On confluence | **Stop**: Below/above octave level | **Target**: Next level
**Cycle Anticipation**
- Enter 1-2 bars before cycle line if price at octave level
- Exit at next cycle or target octave level
- **Edge**: Anticipate cycles instead of reacting
**Angle Breakout + Cycle**
- Price breaks 1x1 angle + next cycle within 20 bars
- Hold through cycle, exit at 2x1 angle or next major level
---
## ⚙️ Customization
### Period Selection (88-Based)
11 harmonic options: 3, 6, 11, 22, **44**, 88, 176, 352, 704, 1408, 2816 bars
- **Intraday** (15m-1h): Period 3-4
- **Swing Trading** (4h-Daily): Period 4-5
- **Position Trading** (Daily-Weekly): Period 5-6
### Visual Controls
- **Colors**: Independent for all elements
- **Line Widths**: Separate controls (1-5) for levels, angles, cycles
- **Label Size**: Tiny/Small/Normal/Large (unified)
- **Label Position**: Top/Middle/Bottom
- **Show/Hide**: Toggle any component
### Alerts
- 50% octave level breakouts
- Customizable messages
---
## 💡 Pro Tips
1. **Validate First**: Observe 2-3 past cycles before trading
2. **Adjust to Volatility**: High volatility = lower period (22-44), Low = higher (88-176)
3. **Multiple Timeframes**: Apply on different timeframes for confirmation
4. **Respect 50% Level**: Most powerful reversal zone in Gann theory
5. **Focus on Full Cycles**: Highest probability setups (◆ FC markers)
6. **Combine with Price Action**: Indicator shows WHERE/WHEN, price action shows HOW
---
## 🚀 What Makes It Unique
✅ **Intelligent Confluence Cycles** - Unique angle-level intersection calculation
✅ **Historical Validation** - See past cycles to trust future projections
✅ **Professional Design** - Color-coded hierarchy, clean labels, no clutter
✅ **Complete Automation** - Everything updates in real-time
✅ **Three-Dimensional Analysis** - Price + Angles + Time = complete picture
---
## 📊 Best Markets
- Stock indices (S&P 500, NASDAQ, Dow)
- Forex majors (EUR/USD, GBP/USD, USD/JPY)
- Commodities (Gold, Silver, Oil)
- Crypto (BTC, ETH)
- Liquid stocks
✅ Complete Gann system (price + angles + time)
✅ 3 time cycle methods
✅ Auto swing detection
✅ 4 past + 8 future cycle projections
✅ Professional visualization
✅ Extensive customization
✅ Real-time alerts
✅ Works all markets/timeframes
---
## ⚠️ Disclaimer
This indicator is for educational purposes and applies W.D. Gann methodology principles. Not financial advice. Always use proper risk management, position sizing, and stop losses. Practice on paper before live trading. Past performance doesn't guarantee future results.
---
**The market moves in patterns of price and time. This indicator helps you see them.**
Trade with geometry. Trade with time. Trade with confidence.

Gann Levels (Auto) by RRR📌 Gann Levels (Auto) — Intraday, Swing & Elliott Wave Precision Tool
Gann Levels (Auto) is a high-accuracy price-reaction indicator designed for intraday scalpers, swing traders, and Elliott Wave traders who want clean, auto-updating support and resistance levels without manually drawing anything.
The indicator automatically detects the latest swing high & swing low and plots the 8 Gann Octave Levels between them. These levels act as a complete price map—showing equilibrium, structure, trend continuation zones, and reversal points with extreme precision.
🔥 Why This Indicator Stands Out
✔ Fully automatic swing detection
Levels update as structure evolves — no manual adjustments.
✔ All Gann Octave levels
Plots 1/8 through 8/8 including the critical 4/8 midpoint.
✔ Intraday-optimized
Exceptional on 1m, 3m, 5m, and 15m charts.
✔ Ultra-clean support & resistance
Levels act as reliable barriers and breakout zones.
⭐ MOST IMPORTANT LEVELS FOR INTRADAY
4/8 – Midpoint (Major Decision Pivot)
Strongest Gann level.
Controls trend or reversal for the session.
Breakout → Trend Day
Rejection → Reversal Day
8/8 & 0/8 – Extreme Structure Edges
Most likely zones for intraday reversals.
Perfect for scalp entries when combined with volume exhaustion.
🎯 How to Trade ELLIOTT WAVE Using Gann Levels
This indicator is exceptionally powerful when combined with Elliott Wave Theory.
Here is how to use it wave-by-wave:
🔵 Wave 2 → Identify Bottom Using 0/8 or 1/8 Levels
Wave 2 typically retraces deep but remains above key structure.
Gann confirmation:
Price stops at 0/8 or 1/8 zone
Rejection wick + low volume breakdown attempt
Bullish intent starts forming
This gives a perfect Wave 3 entry zone.
🔴 Wave 3 → Breakout Above 4/8 Midpoint
Wave 3 is the strongest impulsive wave.
The 4/8 level works like a force-field.
Wave 3 confirmation:
Price breaks and retests 4/8
Strong volume
No deep pullbacks after break
This is one of the most reliable Elliott + Gann trades.
🟡 Wave 4 → Uses 3/8 or 5/8 as Support/Resistance
Wave 4 is corrective and shallow compared to Wave 2.
Gann alignment:
Wave 4 often consolidates between 3/8 and 5/8
Levels act like range boundaries
Avoid trading inside chop; wait for breakout
This gives perfect continuation entries for Wave 5.
🟣 Wave 5 → Ends Near 7/8 or 8/8 Extreme Zone
Wave 5 usually ends in overbought territory.
Gann confirmation:
Price hits 7/8 or 8/8
Momentum weakens
Divergence builds (RSI/MACD optional)
Last push = exhaustion
This is where reversals or major pullbacks begin.
💥 BONUS: Corrective Waves (A-B-C)
Wave A:
Often rejects from 4/8 or 5/8.
Wave B:
Typically trapped between 3/8–5/8.
Wave C:
Usually ends around 0/8 (for bullish trend)
or 8/8 (for bearish trend).
These zones give ultra-high confidence entries.
⚙️ Who This Indicator Is Perfect For
Elliott Wave traders
Intraday scalpers
Swing traders
Price action & structure traders
Traders who want automatic support-resistance levels
Traders who want clean, non-cluttered levels
⚠️ Disclaimer
This indicator is for educational purposes only.
Trading involves risk. Always use proper risk management.

Angled Gann Time-Price Squares with S/RThis is a Pine Script indicator that implements Angled Gann Time-Price Squares based on W.D. Gann's trading theory. Here's what it does:
Core Functionality
Detects pivot highs and lows using a configurable lookback period
Creates angled squares by connecting pivot points to current price action when specific geometric conditions are met
Validates square formation by checking if the price movement follows proper Gann angles (typically 45°, 135°, etc.) within a tolerance range
Key Features
Real-time square tracking: Shows both completed squares and forming squares in progress
Support/Resistance levels: Automatically generates S/R lines from:
Square edge extensions
Diagonal extensions (pivot centers)
Quarter/half levels within squares (25%, 50%, 75%)
Visual feedback: Color-coded squares (green for up, red for down, orange for forming)
Projection lines: Predicts where squares might complete based on Gann angle theory
Gann Theory Application
The indicator follows Gann's principle that time and price move in geometric harmony. It looks for price movements that form perfect squares when plotted on a chart, where the diagonal of the square represents the natural flow of price and time at specific angles.
The generated support/resistance levels are particularly valuable because they're based on completed geometric patterns rather than just horizontal price levels, making them potentially more significant according to Gann methodology.

GL Gann Swing IndicatorIntroduction
The GL Gann Swing Indicator is a versatile tool designed to help traders identify market trends, support and resistance areas, and potential reversals. This indicator applies the principles of Gann Swing Charts, a technique developed by W.D. Gann, which focuses on market swings to determine the overall direction and turning points of price action. Gann Swing Charts are a time-tested method of technical analysis that simplifies price action by focusing on significant highs and lows, thereby eliminating market noise and providing a clearer view of the trend.
By analyzing price action and determining swing directions and turning points, the indicator filters out market noise using four distinct bar types:
Up Bar: Higher High, Higher Low
Down Bar: Lower High, Lower Low
Inside Bar: Lower High, Higher Low
Outside Bar: Higher High, Lower Low
This approach helps traders to:
Identify the primary trend direction.
Determine key support and resistance levels.
Recognize potential reversal points.
Filter out minor price fluctuations that do not affect the overall trend.
Features
Bar Types: Display bar types by checking the Show Bar Type box in the indicator's settings. Up bars appear as green upward-pointing triangles, down bars as red downward-pointing triangles, inside bars as grey circles, and outside bars as blue diamonds. These visual aids help traders quickly identify the type of bar and its significance.
Break Lines: These lines highlight when the price rises above a previous swing high or falls below a prior swing low. Green lines indicate breaks of swing highs, while red lines indicate breaks of swing lows. Break lines are enabled by default but can be turned off in the indicator's settings. Break lines provide visual confirmation of trend continuation or reversal.
Bar Count: Bar counts help determine if a swing is overextended and if a reversal is likely. This feature is off by default but can be enabled in the indicator's settings. Users can set a minimum bar count to focus on significant swings. Analyzing the number of bars in a swing can help traders gauge the strength and potential exhaustion of a trend.
Swing MA (Moving Averages): This feature plots the average of a user-defined number of previous swing highs and lows. Options are available to add two moving averages, allowing for both fast and slow averages. Swing MAs can be enabled in the indicator's settings. These moving averages smooth out the price data, making it easier to identify the underlying trend direction.
Why This Indicator is Useful
The GL Gann Swing Indicator is particularly useful for several reasons:
Trend Identification: By focusing on significant price swings, the indicator helps traders identify the primary trend direction, making it easier to align trades with the overall market movement.
Noise Reduction: The indicator filters out minor price fluctuations, allowing traders to focus on meaningful market movements and avoid being misled by short-term volatility.
Support and Resistance Levels: By highlighting key swing highs and lows, the indicator helps traders identify crucial support and resistance levels, which are essential for making informed trading decisions.
Potential Reversals: The indicator's ability to identify overextended swings and potential reversal points can help traders anticipate market turning points and adjust their strategies accordingly.
Customizability: With options to display bar types, break lines, bar counts, and swing moving averages, traders can customize the indicator to suit their specific trading style and preferences.
By incorporating Gann Swing principles, the GL Gann Swing Indicator offers traders a powerful tool to enhance their technical analysis, improve their trading decisions, and ultimately achieve better trading outcomes.

Gann Square TechniqueThis is the Gann Square Technique that i saw from the YT channel "WD Gann Price & Time Technical Analysis". The horizontal lines can act like Fibonnacci Retracement
This script display Gann Fann/trend lines that u can use like support and resistance.
There can be a problem if u try to display all the squares and lines, this for the limitation of line for part of TradingView but easily u can display:
-Three Gann Squares only with Gann lines
-Three Gann Squares only with 1/8 lines
-Two Gann Squares with 1/4 lines and Gann lines
-Two Gann Squares with 1/6 lines and Gann lines
-One Gann Squares with 1/8 lines and Gann lines
-etc
Probably if u choose some option the Gann Squares will automatically adjust to the last candle, idk how to prevent that

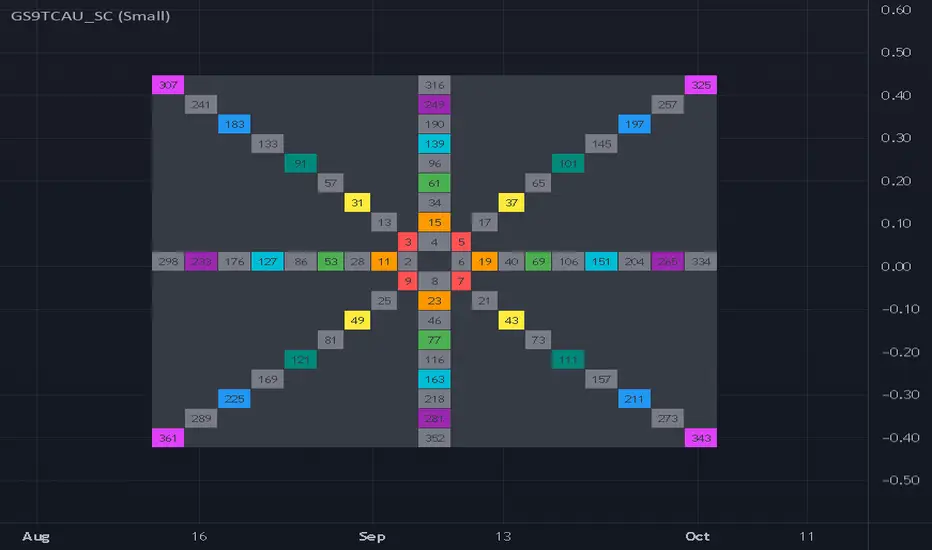
Gann Square of Nine: Planetary Degrees█ Gann Square of Nine: Planetary Degrees maps planetary positions onto Gann's Square of Nine grid, tracking where pivot highs and lows accumulate by planetary degree. Use this indicator to identify recurring degree patterns on the So9, determine whether pivots cluster around cardinal, diagonal, or other significant angles, and project when the planet will return to those degrees.
Powered by the open-source BlueprintResearch Planetary Ephemeris library , which implements truncated VSOP87 (planets) and ELP2000 (Moon) series for high-accuracy celestial calculations entirely within Pine Script.
█ FEATURES
• Anchor Point System — Select any significant price pivot (high or low) as your reference point; all subsequent pivot tracking begins from this timestamp
• All 10 celestial bodies — Sun, Moon, Mercury, Venus, Mars, Jupiter, Saturn, Uranus, Neptune, and Pluto
• Geocentric or Heliocentric views — Toggle between Earth-centered (traditional) and Sun-centered perspectives
• Interactive Square of Nine table — Visual grid displaying the Gann spiral pattern with highlighted pivot degrees
• Automatic pivot detection — Configurable bar sensitivity to identify price pivots (symmetric left/right)
• Pivot degree labeling — Each detected pivot displays the planet's ecliptic longitude (0-360°) at that moment
• Target degree alerts — Define specific So9 degrees to watch; triggers alerts when the planet crosses them
• Preset So9 angles — Quick selection of degrees along major So9 lines (0°, 45°, 90°, 135°, 180°, 225°, 270°, 315°)
• Custom degree input — Enter any degrees as comma-separated or newline-separated values
• Future degree projections — Scans up to 500 bars ahead and shows when the planet will reach each target degree
• Retrograde indicator — Shows ℞ symbol with red text when planets are in apparent retrograde motion
• So9 overlay tools — Plot 90° and 45° angle relationships from any entered degree
█ HOW IT WORKS
The Square of Nine Concept:
Gann's Square of Nine is a spiral grid where numbers flow outward from the center (1) in a square spiral pattern. Key angle relationships (0°, 45°, 90°, etc.) align along specific diagonals and cardinal lines. When planetary degrees land on the same So9 position as significant price pivots, it suggests potential support/resistance levels.
This Indicator:
1. User selects an "anchor" timestamp at a significant price pivot
2. The indicator calculates the selected planet's ecliptic longitude (0-360°) at each bar
3. Price pivots detected after the anchor are labeled with their planetary degrees
4. These degrees accumulate on the So9 grid, revealing patterns
5. Target degrees can be set to receive alerts when crossed
6. Future projections show when the planet will reach those target degrees
█ HOW TO USE
1. Click on the anchor timestamp input and select a significant high or low pivot on your chart
2. Choose "High" or "Low" pivot type based on your anchor point
3. Select your planet from the dropdown
4. Choose Geocentric (traditional) or Heliocentric view
5. The So9 table appears showing accumulated pivot degrees highlighted
6. Set target degrees using presets or custom input to receive crossing alerts
7. Future projections appear as vertical lines with date/time labels
8. Use the So9 overlay tools to visualize angle relationships from specific degrees
█ VISUAL GUIDE
So9 Table Colors:
• Anchor degree: White (⚓ symbol)
• Current planet position: Planet's assigned color with symbol
• Pivot Highs: Green background
• Pivot Lows: Red background
• Equal (both high and low): Orange background
• Diagonal crosses: Blue background
• Cardinal crosses: Red background
• Target degrees: Yellow highlight
Chart Labels:
• Pivot High labels appear above the price with the degree
• Pivot Low labels appear below the price with the degree
• Future projection lines: Yellow (upcoming) or Gray (already crossed since anchor)
█ SETTINGS OVERVIEW
1. Anchor Point — Set the starting pivot timestamp and type (High/Low)
2. Planet Selection — Choose celestial body and coordinate system
3. Target Degree Alerts — Configure which degrees to watch and receive alerts
4. Pivot Detection — Set bar sensitivity for pivot high/low detection and degree rounding precision
5. Visual Style — Customize colors and label sizes
6. So9 Grid Overlay — Enter a degree to visualize its angular relationships
7. So9 Table — Position, sizing, and color options for the grid
8. So9 Diagonals — Toggle and color the diagonal/cardinal cross highlights
█ LIMITATIONS & ACCURACY
This indicator uses optimized VSOP87 and ELP2000 series tailored for Pine Script performance. It delivers excellent accuracy for trading and analytical purposes.
Expected Accuracy:
• Sun, Moon, Mercury, Venus, Mars: Within 1-10 arcseconds
• Jupiter, Saturn: Within 10-30 arcseconds
• Uranus, Neptune: Within 1-2 arcminutes
• Pluto: Simplified Meeus method (valid 1900-2100)
Degree Resolution:
The So9 grid uses integer degrees (1-361). Planetary positions are rounded to the nearest whole degree for grid placement. Precise decimal degrees are retained for crossing calculations and alerts.
Crossing Detection:
Future projection lines and background highlights both point to the confirmation bar—the first bar where the crossing can be verified. Alerts also trigger on this bar. This ensures all visual elements align consistently: when the chart reaches a future projection line, that bar closes with the crossing confirmed and highlighted.
█ CREDITS
• Square of Nine grid visualization adapted from ThiagoSchmitz's "Gann Square of 9" (Feb 2023)
• Ephemeris calculations via BlueprintResearch/lib_ephemeris open-source library

Gann ArchitectThe Gann Architect is a quantitative geometric engine designed to solve the primary limitation of standard Gann tools: Scaling.
Standard Gann Fans use fixed angles (e.g., 45 degrees for 1:1), which often fail when applied to volatile assets or different timeframes because they do not account for the specific price-to-time ratio of the asset. This indicator solves this by calculating a Dynamic Slope. It identifies the initial "Impulse Phase" (Anchor Low → First Major High) and mathematically "squares" the chart to fit that specific market structure.
Key Features
Dynamic Squaring: Automatically calculates the true 1:1 Master Line based on the asset's actual volatility, not an arbitrary angle.
Quantitative Alerts: Includes a built-in alert system. You can set alerts for "Crossed 1:1" (Trend Break), "Structural Fail 1:2" (Support Break), or "Impulse Breakout 2:1".
Real-Time Data Panel: A dashboard displays the exact price targets for the geometric levels, removing the need to eyeball the lines.
Efficiency: Uses a circular buffer memory system to ensure high performance ("100% potential") without slowing down your chart.
How to Use
This tool is designed as a Trend Following & Structure Map, not a reversal signal.
The 1:1 Line (Solid): This represents the "True Trend." In a strong bullish phase, price should respect this line as dynamic support. A confirmed close below this line often signals momentum loss.
The 1:2 Line (Bottom Support): This acts as the "Structural Floor." If price loses the 1:1 but holds the 1:2, it is considered a healthy correction. A break below the 1:2 typically invalidates the geometric structure of the current cycle.
The 2:1 Line (Top Resistance): This marks the "Impulse Zone." A break above this line suggests parabolic or over-extended behaviour.
Settings
Cycle Stiffness: Controls the sensitivity of the pivot detection. Increase this value (e.g., to 4 or 5) to filter out noise and focus on macro trends.
Anchor Pivot #: Allows you to select which historical cycle bottom to anchor the geometry to (1 = most recent confirmed bottom).
Slope Multiplier: Adjusts the aggressiveness of the fan. Default is 1.0 (Geometric Standard).
Technical Disclosure (Repainting & Lag)
This script utilises a Confirmed Pivot Detection system.
Signal Lag: To ensure reliability, the geometric fans anchor to confirmed pivots. A pivot is only confirmed after Right Length bars have passed. Therefore, the fans will appear on the chart with a slight delay relative to the absolute low.
Repainting: Once a pivot is confirmed and the fans are drawn, the lines for that specific cycle do not repaint history. However, if a new, lower low forms that invalidates the previous structure, the script will dynamically shift to the new anchor point to maintain geometric accuracy.
Disclaimer This script is for educational and experimental purposes only. Geometric analysis is a mapping tool, not a guarantee of future price action. Always use proper risk management. Past performance of geometric levels does not guarantee future results.

Gann Trading Strategy📈 Simple & Powerful Gann-Based Trading System
This indicator automatically calculates key Gann support and resistance levels based on W.D. Gann's mathematical principles. Simply input either the highest price (for bearish setups) or lowest price (for bullish setups), and the indicator automatically generates all trading levels.
🎯 Key Features:
Automatic Level Calculation - Just select High/Low price projection basis
Complete Trading Framework - Entry zone, 3 Take Profit levels, and Exit level
Visual Trading Zones - Color-coded zones around each level for better entry/exit timing
Smart Alerts - Get notified when price reaches key levels
Bullish & Bearish Setups - Works for both long and short trading strategies
Customizable Display - Show/hide levels, adjust colors, line styles, and zone widths
🚀 How to Use:
Select "Lowest Price" for bullish setup or "Highest Price" for bearish setup
Input the relevant high or low price from your analysis
The indicator automatically calculates and displays all trading levels
Use the green entry zone for entries, blue levels for take profits, red level for exits
📊 Perfect for:
Swing trading
Position sizing and risk management
Support/resistance analysis
Multi-timeframe analysis
Uses time-tested Gann principles to automatically find key price levels for trading.
