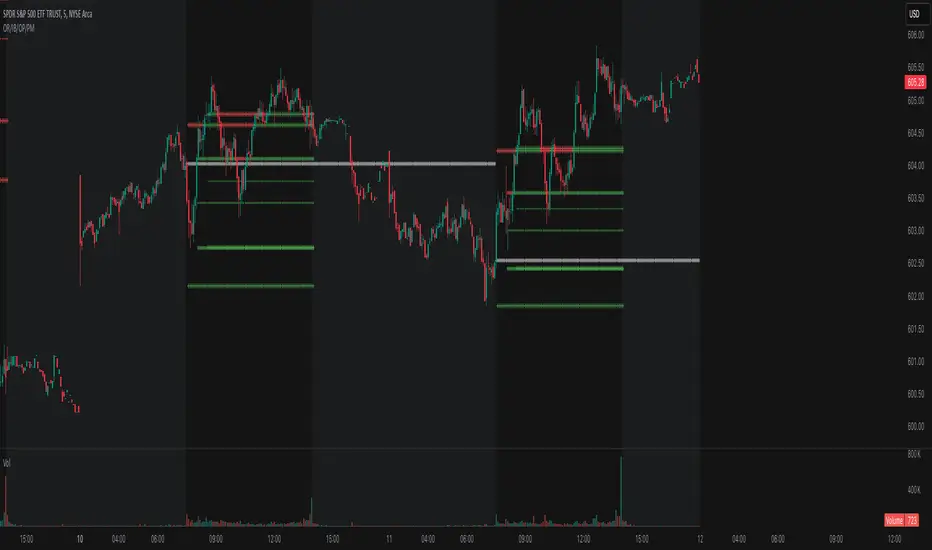
Pivot Point Monthly - bitcoin by Simon-RoseMonthly Version:
I have written 3 Indicators because i couldn't find what i was looking for in the library, so you can turn each one on and off individually for better visibility.
This are Daily, Weekly and Monthly Pivot Points with their Resistance and Support Points
and also on the Daily with the range between them.
I will also publish some Ideas to show you how to use them if you are not familiar with the traditional pivot points strategy already.
Unlike the usually 3 support & resistances i added 4 of them, specifically for trading bitcoin (on traditional markets this level of volatility usually never gets touched)
Here you can see which lines are what for reference, as the Feature to label lines is missing in Pinescript (if you have a workaround pls tell me ;) )
This is the basic calculation used :
PP = (xHigh+xLow+xClose) / 3
R1 = vPP+(vPP-Low)
R2 = vPP + (High - Low)
R3 = xHigh + 2 * (vPP - Low)
R4 = xHigh + 3 * (vPP - Low)
S1 = vPP-(High - vPP)
S2 = vPP - (High - Low)
S3 = xLow - 2 * (High - PP)
S4 = xLow - 3 * (High - PP)
If you have any questions or suggestions pls write me :)
Happy trading
Cheers
Daily Version:
Weekly Version:
在腳本中搜尋"high low"
Pivot Points Weekly - bitcoin by Simon-RoseWeekly Version:
I have written 3 Indicators because i couldn't find what i was looking for in the library, so you can turn each one on and off individually for better visibility.
This are Daily, Weekly and Monthly Pivot Points with their Resistance and Support Points
and also on the Daily with the range between them.
I will also publish some Ideas to show you how to use them if you are not familiar with the traditional pivot points strategy already.
Unlike the usually 3 support & resistances i added 4 of them, specifically for trading bitcoin (on traditional markets this level of volatility usually never gets touched)
Here you can see which lines are what for reference, as the Feature to label lines is missing in Pinescript (if you have a workaround pls tell me ;) )
This is the basic calculation used :
PP = (xHigh+xLow+xClose) / 3
R1 = vPP+(vPP-Low)
R2 = vPP + (High - Low)
R3 = xHigh + 2 * (vPP - Low)
R4 = xHigh + 3 * (vPP - Low)
S1 = vPP-(High - vPP)
S2 = vPP - (High - Low)
S3 = xLow - 2 * (High - PP)
S4 = xLow - 3 * (High - PP)
If you have any questions or suggestions pls write me :)
Happy trading
Cheers
Daily Version:
Monthly Version:
Pivot Points Daily - bitcoin by Simon-RoseDaily Version:
I have written 3 Indicators because i couldn't find what i was looking for in the library, so you can turn each one on and off individually for better visibility.
This are Daily, Weekly and Monthly Pivot Points with their Resistance and Support Points
and also on the Daily with the range between them.
I will also publish some Ideas to show you how to use them if you are not familiar with the traditional pivot points strategy already.
Unlike the usually 3 support & resistances i added 4 of them, specifically for trading bitcoin (on traditional markets this level of volatility usually never gets touched)
Here you can see which lines are what for reference, as the Feature to label lines is missing in Pinescript (if you have a workaround pls tell me ;) )
This is the basic calculation used :
PP = (xHigh+xLow+xClose) / 3
R1 = vPP+(vPP-Low)
R2 = vPP + (High - Low)
R3 = xHigh + 2 * (vPP - Low)
R4 = xHigh + 3 * (vPP - Low)
S1 = vPP-(High - vPP)
S2 = vPP - (High - Low)
S3 = xLow - 2 * (High - PP)
S4 = xLow - 3 * (High - PP)
If you have any questions or suggestions pls write me :)
Happy trading
Cheers
Weekly Version:
Monthly Version:
Binque's Multi-Moving Average Binque's Multi-Moving Average - One indicator with four simple moving average and four exponential moving averages, plus as a bonus a Day High moving average and a Day Low Moving Average.
Simple Moving Average or MA(14), MA(50), MA(100) and MA(200) all in one indicator
Exponential Moving Average or EMA(8), EMA(14), EMA(20) and EMA(33) all in one indicator
Day High Moving Average - Tracks the Daily High versus most moving averages track the daily close.
Day Low Moving Average - Tracks the Daily Low versus most moving average track the daily close.
To Disable moving averages, Set the color to the chart background and then set the length to 1 and uncheck.
I Use the Daily High Moving Average to track upward resistance in a stock movement for Swing Trading.
I Use the Daily Low Moving Average to track my trailing stop in a stock movement for Swing Trading.
Math by Thomas Liquidity PoolDescription
Math by Thomas Liquidity Pool is a TradingView indicator designed to visually identify potential liquidity pools on the chart by detecting areas where price forms clusters of equal highs or equal lows.
Bullish Liquidity Pools (Green Boxes): Marked below price where two adjacent candles have similar lows within a specified difference, indicating potential demand zones or stop loss clusters below support.
Bearish Liquidity Pools (Red Boxes): Marked above price where two adjacent candles have similar highs within the difference threshold, indicating potential supply zones or stop loss clusters above resistance.
This tool helps traders spot areas where smart money might hunt stop losses or where price is likely to react, providing valuable insight for trade entries, exits, and risk management.
Features:
Adjustable box height (vertical range) in points.
Adjustable maximum difference threshold between candle highs/lows to consider them equal.
Boxes automatically extend forward for visibility and delete when price sweeps through or after a defined lifetime.
Separate visual zones for bullish and bearish liquidity with customizable colors.
How to Use
Add the Indicator to your chart (preferably on instruments like Nifty where point-based thresholds are meaningful).
Adjust Inputs:
Box Height: Set the vertical size of the liquidity zones (default 15 points).
Max Difference Between Highs/Lows: Set the max price difference to consider two candle highs or lows as “equal” (default 10 points).
Box Lifetime: How many bars the box stays visible if not swept (default 120 bars).
Interpret Boxes:
Green Boxes (Bullish Liquidity Pools): Areas of potential demand and stop loss clusters below price. Watch for price bounces or accumulation near these zones.
Red Boxes (Bearish Liquidity Pools): Areas of potential supply and stop loss clusters above price. Watch for price rejections or distribution near these zones.
Trading Strategy Tips:
Use these zones to anticipate where stop loss hunting or liquidity sweeps may occur.
Combine with your Order Block, Fair Value Gap, and Market Structure tools for higher probability setups.
Manage risk by avoiding entries into price regions just before large liquidity pools get swept.
Automatic Cleanup:
Boxes delete automatically once price breaks above (for bearish zones) or below (for bullish zones) the zone or after the set lifetime.
Dr Avinash Talele momentum indicaterTrend and Volatility Metrics
EMA10, EMA20, EMA50:
Show the percentage distance of the current price from the 10, 20, and 50-period Exponential Moving Averages.
Positive values indicate the price is above the moving average (bullish momentum).
Negative values indicate the price is below the moving average (bearish or corrective phase).
Use: Helps traders spot if a stock is extended or pulling back to support.
RVol (Relative Volume):
Compares current volume to the 20-day average.
Positive values mean higher-than-average trading activity (potential institutional interest).
Negative values mean lower activity (less conviction).
Use: High RVol often precedes strong moves.
ADR (Average Daily Range):
Shows the average daily price movement as a percentage.
Use: Higher ADR = more volatility = more trading opportunities.
50D Avg. Vol & 50D Avg. Vol ₹:
The 50-day average volume (in millions) and value traded (in crores).
Use: Confirms liquidity and suitability for larger trades.
ROC (Rate of Change) Section
1W, 1M, 3M, 6M, 12M:
Show the percentage price change over the last 1 week, 1 month, 3 months, 6 months, and 12 months.
Positive values (green) = uptrend, Negative values (red) = downtrend.
Use: Quickly see if the stock is gaining or losing momentum over different timeframes.
Momentum Section
1M, 3M, 6M:
Show the percentage gain from the lowest price in the last 1, 3, and 6 months.
Use: Measures how much the stock has bounced from recent lows, helping find strong rebounds or new leaders.
52-Week High/Low Section
From 52WH / From 52WL:
Show how far the current price is from its 52-week high and low, as a percentage.
Closer to 52WH = strong uptrend; Closer to 52WL = possible value or turnaround setup.
Use: Helps traders identify stocks breaking out to new highs or rebounding off lows.
U/D Ratio
U/D Ratio:
The ratio of up-volume to down-volume over the last 50 days.
Above 1 = more buying volume (bullish), Below 1 = more selling volume (bearish).
Use: Confirms accumulation or distribution.
How This Table Helps Analysts and Traders
Instant Trend Assessment:
With EMA distances and ROC, analysts can instantly see if the stock is trending, consolidating, or reversing.
Momentum Confirmation:
ROC and Momentum sections highlight stocks with strong recent moves, ideal for momentum and breakout traders.
Liquidity and Volatility Check:
Volume and ADR ensure the stock is tradable and has enough price movement to justify a trade.
Relative Positioning:
52-week high/low stats show whether the stock is near breakout levels or potential reversal zones.
Volume Confirmation:
RVol and U/D ratio help confirm if moves are backed by real buying/selling interest.
Actionable Insights:
By combining these metrics, traders can filter for stocks with strong trends, robust momentum, and institutional backing—ideal for swing, position, or even intraday trading.
Prev Day High/Low - RTH OnlyThis indicator displays the previous day’s Regular Trading Hours (RTH) high and low levels on your chart, but only during the next day’s RTH session — keeping your charts clean while highlighting the most relevant price zones.
🔧 Features:
RTH Timing: 09:30 to 16:00 (New York time)
Auto-Detection: Automatically tracks the high and low of each RTH session
Next-Day Visibility: Lines are only shown during the following day’s RTH session
Minimal Chart Clutter: Levels disappear after the session ends, keeping focus on what's relevant
Clear Labels: Optional “Prev High” and “Prev Low” markers at market open
📊 Use Case:
Perfect for intraday and 0DTE options traders who rely on prior session key levels for:
Breakout trades
Reversal setups
Support/resistance confluence
These levels are often respected by institutions and algo flows, making them highly actionable when approached in the next RTH session.
🧠 Why This Matters:
Many traders overpopulate their charts with persistent support/resistance lines. This script keeps only what’s essential — the previous day’s RTH range — and only when it matters most: the following day’s active market hours.
TK47 36 ChambersTK47 36 Chambers is a precision-crafted EMA (Exponential Moving Average) tool designed to help traders align with multi-timeframe trends while keeping price action clear and uncluttered. Built around the powerful 36 EMA, this script plots the current timeframe’s high, low, and median EMAs as a visual "chamber" or cloud, giving instant feedback on intrabar dynamics.
Shoutout to Insilico, who introduced the 36 EMA as a core trend-following tool — this indicator wouldn’t exist without that spark.
How It Works
Core EMA:
The central element is the 36-period EMA, applied to close, high, and low prices on your current chart.
These three EMAs form a channel or “chamber” that acts as a dynamic zone of control.
The cloud between the high and low EMA can optionally be filled to help visualize volatility.
Higher Timeframe EMAs (HTF EMAs):
Optionally displays Daily, Weekly, 4H, and 1H EMAs (all using the same configurable EMA length, default: 36).
These are interpolated smoothly between HTF candles, creating elegant transitions and avoiding jumpy plotting.
Helps traders spot broader trend bias directly on lower timeframe charts without switching views.
Customizations
Adjustable colors for each EMA layer (current + HTFs).
Toggle cloud fill on/off.
Toggle visibility of each HTF line.
Option to show labels at the edge of the chart (e.g., “W” for Weekly) for clarity.
Use Cases
Confirming trend direction across multiple timeframes.
Identifying pullback entries or mean reversion zones.
Combining with candlestick patterns, liquidity sweeps, or oscillator divergence for high-probability entries.
Notes
All EMAs use the same configurable length to keep things clean and consistent.
Interpolation ensures the HTF EMAs remain smooth and aligned with the LTF candles.
The fill between high and low EMA gives a visual representation of the market’s breathing room — useful for spotting expansions and contractions.
TTM Scalper AlertTTM Scalper Alert — Real-Time Pivot Detector
Description:
This is a custom implementation of the classic TTM Scalper Alert, adapted to show early pivot detection and trend structure tracking in real-time. The script identifies potential highs and lows before the full pivot confirmation—giving traders an early edge—and removes outdated signals once pivots are confirmed.
It supports two levels of detection:
Fast Alert Pivots : Identified after Alert Period candles confirm a local reversal.
Confirmed Pivots : Validated only after Pivot Period candles on both sides ensure a true swing high/low.
How It Works:
Fast Detection (Early Pivots):
Detected after Alert Period (AP) candles. These are provisional signals, shown as triangle labels (▲▼) near current price. Only the latest signal is shown; previous fast pivots are deleted to avoid clutter.
Confirmed Pivots:
Detected with a full lookback of Pivot Period (PP) on both sides of the candle. Shown using plotshape with triangle markers (▲▼). Serve as anchors for price structure analysis (HH-HL or LL-LH tracking).
Custom Source Option:
Users can choose to base pivots on High/Low or Close/Open range. Helps adjust sensitivity depending on volatility or bar structure.
How to Interpret:
Trend & Market Structure:
Use Confirmed Pivots (plotshapes) to analyze market structure:
HH → HL: Uptrend
LL → LH: Downtrend
Watch for breaks in structure for possible reversals
Early Alerts:
The floating labels (▲▼) represent early warnings of a potential pivot. Use them to anticipate:
Short-term exhaustion
Quick scalping entries
Divergence setups
Inputs:
Source : Choose from High/Low or Close/Open — affects how pivots are calculated
Alert Period : How fast the script detects an early reversal pattern (used for entry timing)
Pivot Period : How many candles before/after to confirm a full pivot (used for structural analysis)
Best For:
Traders who follow price action and structure
Scalpers and intraday traders who want early signals
Anyone using pivot highs/lows for confluence with other tools (like RSI divergence, Bollinger Bands, VWAP, etc.)
Pro Tips:
Combine this with:
Trend Magic or Supertrend for directional bias
Volume spike filters to confirm reversal intent
RSI/CCI divergence to strengthen reversal pivots
Adjust Alert Period to tune early signal sensitivity (lower = faster but noisier)
Overnight Bias: Net Long/Short with PercentOvernight bias can assist with NY session gap fades or gap and go trading once the NY session is open.
Some general gap rules are:
1. Gap Direction Aligned with Overnight Bias
Rule: If the NY session gaps up and the overnight bias is Net Long (e.g., >60% of bars above the overnight open), favor longs.
Confirmation: Look for price to hold above overnight open or VWAP.
Invalidation: If price re-enters the overnight range, reassess.
2. Gap Opposing Overnight Bias (Contrarian Setup)
Rule: If the NY opens opposite the overnight bias, expect potential gap fill or reversal.
Trade Bias: Look for retracement back toward the overnight open or VWAP.
Example: Overnight was Net Long, but NY gaps down → wait for reclaim of VWAP to go long, else fade strength.
3. Gap Into Prior Day Value Area (VAH to VAL)
Rule: If the NY session gaps into the prior day value area:
It implies mean reversion behavior.
Expect price to rotate toward the POC (point of control).
Trade Bias: Fade toward POC if overnight bias is balanced or opposite the gap direction.
4. Gap Outside Prior Day Value Area
Rule: A gap above VAH or below VAL suggests potential breakout or new trend day.
Trade Bias: If overnight bias aligns (e.g., gap above VAH + Net Long overnight), consider trend continuation.
Invalidation: If price breaks back inside the prior day value area, watch for failed breakout → fade trade possible.
5. Gap Above Prior Day High / Below Prior Day Low
Rule: This is a true breakout gap.
Above Prior High + Net Long Bias: Look for continuation.
Below Prior Low + Net Short Bias: Look for sell pressure continuation.
Trade Bias: Use pullbacks to the prior high/low or overnight open for continuation setups.
6. Gap Within Prior Day Range
Rule: If the NY open is within the prior day’s high and low, expect chop or balanced conditions.
Trade Bias: Use overnight VWAP and prior POC as decision zones. Be cautious unless a breakout occurs.
7. Failed Gap and Re-entry into Prior Day Range
Rule: If price gaps above prior high but re-enters the prior range, it's a failed breakout.
Trade Bias: Look for a fade back to VAH or POC.
Confirmation: Watch for breakdown below overnight VWAP or failure to hold overnight open.
8. Gap + Overnight VWAP Divergence
Rule: If price gaps opposite the direction of VWAP (e.g., VWAP rising, gap down), wait for confirmation.
Trade Bias: Be cautious with early trades. Bias may flip if VWAP is reclaimed.
9. Gap + Overnight Open Test
Rule: If price opens with a gap and then retests the overnight open, that level becomes a decision zone.
Trade Bias:
Hold above = trend continuation.
Rejection = gap fill or reversal.
10. Unfilled Gap = Trend Bias
Rule: If the gap remains unfilled for the first 30–60 minutes, it increases the odds of a trend day.
Trade Bias: Trade pullbacks in the direction of the gap and overnight bias.
Should anyone have suggestion to add please do so.
Really Key Levels█ OVERVIEW
This indicator shows the most useful and universally used key trading levels (and only those) in a visually appealing way. Its originality lies in the fact that it was developed due to being unable to find an indicator that wasn't cluttered with other features or far less relevant levels, or one that would indicate the bar causing the level (i.e., not just using a horizontal line over the whole chart), or one that was well-programmed and didn’t frequently refresh for many seconds for no obvious reason, taking far too long to do so for such a seemingly simple indicator.
█ FEATURES
Shows the most frequently used key levels in a visually appealing way
Indicates the bar that causes the level, with the line starting at that bar
Works correctly and consistently on both RTH and ETH charts
Lines can be optionally extended both left and right, if the user prefers
Works with US/European stocks and US futures (at least)
Configurable futures regular session (default time is for CME futures, e.g., ES/NQ, etc.)
Users can configure line colour, style, and thickness
Adjustable label locations to prevent overlap with other indicator labels
Nice defaults that look good, and a well-contrasting label text colour
Well-documented, high-quality, open-source code for those who are interested
█ CONCEPTS
The indicator shows the following levels by a line starting at the bar that causes them:
Current Day RTH High/Low (visible and updated only during RTH; visible with no further updates in the post-market)
Current Day RTH Open (only after the RTH open)
Pre-Market High/Low (as it develops in the pre-market and fixed after RTH open)
Previous Day RTH Close
Previous Day RTH High/Low
Previous Day Pre-Market High-Low
Two Days Ago RTH Close
Other levels may be added in future versions, if requested and if they are Really Key Levels.
Regarding futures: despite being a 23-hour market (for CME futures, 5 p.m. the previous day to 4 p.m. the current day), most trading activity takes place together with the RTH on stock exchanges in New York, 08:30 to 3 p.m. Central (Chicago) time. Therefore, a user-configurable regular market is defined at those times, with times before this (from 5 p.m. the previous day) being considered pre-market, and times after this (until 4 p.m.) being considered post-market.
Care was taken so that the code uses no hard-coded time zones, exchanges, or session times. For this reason, it can in principle work globally. However, it very much depends on the information provided by the exchange, which is reflected in built-in Pine Script variables (see Limitations below).
█ LIMITATIONS
Pre-market levels are not shown when viewing an RTH chart.
The indicator was developed and tested on US/European stocks and US futures. It may or may not work for stocks and futures in other countries (depending on their pre- and post-market definitions and what information the exchange provides to TradingView via the relevant built-in Pine Script variable). It does not work on other security types, especially those with a 24-hour market that don't have a uniquely defined daily close, implicit H/L time window, or a pre-market.
ORB Advanced Cloud Indicator & FIB's by TenAMTraderSummary: ORB Advanced Cloud Indicator with Alerts and Fibonacci Retracement Targets by TenAMTrader
This TradingView script is an advanced version of the Opening Range Breakout (ORB) indicator, enhanced with visual clouds and Fibonacci retracement/extension levels. It is designed to help traders identify key price levels and track price movements relative to those levels throughout the trading day. The script includes alert functionalities to notify traders when price crosses key levels and when Fibonacci levels are reached, which can serve as potential entry and exit targets.
Key Features:
Primary and Secondary Range Calculation:
The indicator calculates the primary range (defined by a start and end time) and optionally, a secondary range.
The primary range includes the highest and lowest prices during the designated time period, as well as the midpoint of this range.
The secondary range (if enabled) tracks another price range during a second time period, with its own high, low, and midpoint.
Visual Clouds:
The script draws colored clouds between the high, midpoint, and low of the opening range.
The upper cloud spans between the Opening High and Midpoint, while the lower cloud spans between the Midpoint and Opening Low.
Similarly, a second set of clouds can be drawn for the secondary range (if enabled).
Fibonacci Levels:
The script calculates Fibonacci retracement and extension levels based on the primary range (the difference between the Opening High and Opening Low).
Fibonacci levels can be used as entry and exit targets in a trading strategy, as these levels often act as potential support/resistance zones.
Fibonacci levels include standard values like -0.236, -0.382, -0.618, and positive extensions like 1.236, 1.618, etc.
Customizable Alerts:
Alerts can be set to trigger when:
The price crosses above the Opening High.
The price crosses below the Opening Low.
The price crosses the Opening Midpoint.
These alerts can help traders act quickly on important price movements relative to the opening range.
Customization Options:
The indicator allows users to adjust the time settings for both the primary and secondary ranges.
Custom colors can be set for the lines, clouds, and Fibonacci levels.
The visibility of each line and cloud can be toggled on or off, giving users flexibility in how the chart is displayed.
Fibonacci Levels Overview:
The script includes several Fibonacci retracement and extension levels:
Negative Retracements (e.g., -0.236, -0.382, -0.50, -0.618, etc.) are plotted below the Opening Low, and can act as potential support levels in a downtrend.
Positive Extensions (e.g., 1.236, 1.382, 1.618, 2.0, etc.) are plotted above the Opening High, and can act as potential resistance levels in an uptrend.
Fib levels can be used as entry and exit targets to capitalize on price reversals or breakouts.
Safety Warning:
This script is for educational and informational purposes only and is not intended as financial advice. While it provides valuable technical information about price ranges and Fibonacci levels, trading always involves risk. Users are encouraged to:
Paper trade or use a demo account before applying this indicator with real capital.
Use proper risk management strategies, including stop-loss orders, to protect against unexpected market movements.
Understand that no trading strategy, indicator, or tool can guarantee profits, and losses can occur.
Important: The creator, TenAMTrader, and TradingView are not responsible for any financial losses resulting from the use of this script. Always trade responsibly, and ensure you fully understand the risks involved in any trading strategy.
London/NY Sessions + SMC Levels📜 Indicator Description: London/NY Sessions + SMC Levels
Overview: This indicator highlights the key trading sessions — London, New York, NY Lunch, and Asian Range — providing structured visual guides based on Smart Money Concepts (SMC) and ICT principles.
It dynamically plots:
Session Backgrounds and Boxes for London, NY, Lunch, and Asian sessions
Reference Levels for the High, Low, and Close from today, previous day, or weekly data
Midnight Open line for ICT-style power of three setups
Real-time alerts for session starts, session closes, and important price level crossings
Features:
🕰️ Session Visualization:
Toggle London, NY, Lunch, and Asian session ranges individually, with customizable colors and transparent backgrounds.
🔔 Built-in Alerts:
Alerts for:
Price crossing the previous day's high/low
Price crossing the Midnight Open
Start and end of major sessions (London, NY, Lunch, Asian)
🟩 Reference Levels:
Plot selectable session reference levels:
Today’s intraday High/Low/Close
Previous Day’s High/Low/Close
This Week’s or Previous Week’s levels for broader context.
🌙 Midnight Open:
Track the Midnight New York Open as a reference point for daily bias shifts.
🎯 Customizable Settings:
Choose your session time zones (UTC, New York, London, etc.)
Customize all border colors, background colors, and session hours.
Use Cases:
Identify killzones and optimal trade entry windows for Smart Money Concepts (SMC) and ICT strategies.
Monitor liquidity pool sweeps and session transitions.
Confirm or refine your intraday or swing trading setups by referencing session highs/lows.
Recommended For:
ICT traders
Smart Money Concepts (SMC) practitioners
Forex, indices, crypto, and futures traders focusing on session-based volatility patterns
Anyone wanting a clean, professional session mapping tool
📈
Designed to help you trade with session precision and Smart Money accuracy.
Integrates seamlessly into any ICT, Wyckoff, or Liquidity-based trading approach.
[blackcat] L1 Dynamic EdgeOVERVIEW
📈 The L1 Dynamic Edge is a sophisticated trend-following indicator designed to empower traders with a comprehensive view of market dynamics and precise buy/sell signals. By leveraging multiple Exponential Moving Averages (EMAs) and advanced signal processing, this indicator aims to capture the essence of price momentum and provide actionable insights across various financial instruments and timeframes.
🔑 Key Features:
Fully customizable EMA settings
Multi-dimensional trend analysis using high, low, and midpoint EMAs
Intuitive color-coded trend visualization
Accurate buy/sell signals with visual confirmation
Flexible alert system for real-time notifications
Seamless integration with TradingView's charting tools
FEATURES
📉 Advanced Trend Detection:
Utilizes three distinct EMAs (high, low, and midpoint) for a holistic view of market trends
Employs sophisticated logic to determine rising and falling trends
🌟 Dynamic Visualization:
Automatically adjusts the color of EMA plots based on detected trend direction
Fills the area between high and low EMAs for enhanced visual clarity
📈 Precision Signal Generation:
Identifies potential trend reversals using a combination of price action and EMA behavior
Generates clear buy/sell signals based on trend changes
📊 Comprehensive Chart Integration:
Displays buy/sell signals as easily identifiable shapes on the chart
Adds descriptive labels to signal bars for quick reference
🔔 Customizable Alert System:
Provides alert conditions for both buy and sell signals
Allows users to stay informed about potential trading opportunities even when away from the chart
🛠️ User-Friendly Interface:
Simple input parameters for easy customization
Clean and uncluttered chart appearance without overwhelming the user
🌐 Versatile Application:
Adaptable to various financial instruments, including stocks, forex, commodities, and cryptocurrencies
Effective across different timeframes, from short-term scalping to long-term investing
HOW TO USE
✨ Adding the Indicator:
Open your TradingView chart
Click on "Add Indicator" at the top of the screen
Search for " L1 Dynamic Edge" and add it to your chart
🔧 Customizing Settings:
Adjust the EMA length in the input panel to suit your trading style and preferences
Experiment with different values to find what works best for your specific strategy
🕵️♂️ Analyzing Trends:
Observe the color of the EMA bands to quickly assess the overall market sentiment
Note how the filling between the high and low EMAs responds to price movements
📈 Identifying Opportunities:
Watch for buy/sell signals indicated by triangles and labels on the chart
Consider these signals as potential entry/exit points for your trades
🎯 Implementing Strategies:
Combine the indicator's signals with your own analysis and risk management techniques
Use the provided alerts to stay informed about new trading opportunities
🚨 Setting Up Alerts:
Configure alert conditions for buy and sell signals
Choose your preferred notification method (email, SMS, push notifications, etc. )
📊 Fine-Tuning Your Approach:
Regularly review and analyze the indicator's performance
Adjust the EMA length and other parameters as needed to adapt to changing market conditions
LIMITATIONS
Like any technical indicator, the L1 Dynamic Edge should not be used as a standalone trading system
Its effectiveness may be limited during periods of extreme volatility or in highly ranging markets
The indicator's performance will vary depending on the specific instrument and timeframe being analyzed
New traders might need some time to fully understand and effectively utilize all features of the indicator
NOTES
This script utilizes Pine Script version 5 for optimal performance and compatibility with TradingView's latest features
The default EMA length is set to 3, which provides a balance between responsiveness and noise reduction
The indicator's color scheme has been carefully chosen to ensure maximum visibility while maintaining a clean chart appearance
For best results, consider combining this indicator with other forms of technical and fundamental analysis
Regular backtesting and forward testing are crucial to optimize the indicator's settings for your specific trading style and market conditions
THANKS
We extend our deepest gratitude to the vibrant TradingView community for their invaluable feedback, suggestions, and support throughout the development process of the L1 Dynamic Edge indicator. Special thanks to all the dedicated traders who took the time to test and refine this tool, helping us create a more robust and user-friendly experience for everyone.
PumpC Opening Range Breakout (ORB) 5min Range📄 PumpC ORB 5-Minute Opening Range Breakout Indicator
✨ Overview
The PumpC ORB 5-Minute Opening Range Breakout indicator captures early session price action by tracking the high, low, and open of a defined 5-minute window at market open (customized for Futures or Stocks).
It plots breakout levels, extension targets, average range calculations, volume tracking, and provides visual and table-based data summaries.
This indicator is designed for traders seeking a complete, clean visualization of Opening Range Breakouts (ORB) with flexible customization.
⚙️ Main Features
Opening Range Box (ORB Box) Draws a box around the high and low of the first 5-minute session (8:30–8:35 ET for Futures, 9:30–9:35 ET for Stocks). Box extends from the session open to the session close (4:00 PM ET). Option to enable/disable historical boxes. Box color and opacity are customizable. Core ORB Levels Open Level: Plots the open price of the 5-minute ORB window. ORB Levels: Plots breakout levels at multiples: +0.5x the range +1.5x the range (customizable factor) Each level has independent color settings and visibility toggles. Option to show or hide historic extension levels. Table Display Compact table in the top-right corner showing: ORB ATR (average range) ORB ATR in ticks Today's ORB range ORB Volume ATR (average volume during ORB) Today's ORB Volume Volume is formatted automatically into "K" (thousands) or "M" (millions) for readability. Background Highlights After the ORB window closes: Blue highlight if today's ORB range is greater than the 10-day ATR average. Orange highlight if today's ORB range is smaller than the 10-day ATR average. Helps quickly assess relative strength or weakness compared to historical behavior. Alerts Breakout Confirmations: Fires when price closes above ORB High or below ORB Low. Fallout Traps: Alerts when price wick crosses ORB High/Low but closes back inside the range. Alerts use clean titles and simple messages for easy identification.
🔧 Inputs and Customization
Mode Toggle: Choose between Futures (8:30 ET open) or Stocks (9:30 ET open). Show/Hide Labels: Control label visibility for ORB and extension levels. Line Width Control: Customize thickness for ORB lines and extension levels. ORB Level Level Visibility: Independently enable or disable each extension line. Table Appearance: Customize table background color, font color, and padding. ORB Box Settings: Customize box color and control whether historical boxes are drawn.
📚 How to Use
Select Mode: Choose Futures or Stocks depending on your instrument. Observe the Opening Range: Focus on the ORB High and ORB Low during the first 5 minutes after the open. Monitor Breakouts: Breakout alerts will fire when price closes outside the ORB range, signaling potential continuation. Watch for Fallout Traps: Fallout alerts signal when price briefly wicks above/below but closes back inside the ORB range. Use Table Metrics: Instantly compare today's ORB range and volume versus historical averages to assess session strength or weakness.
🛡️ Notes
Best used on the 1-minute or 5-minute chart for intraday trading. Ensure your TradingView chart time zone is set to New York for correct functioning. Alerts must be manually configured after adding the indicator to your chart.
RSI Divergence Strategy - AliferCryptoStrategy Overview
The RSI Divergence Strategy is designed to identify potential reversals by detecting regular bullish and bearish divergences between price action and the Relative Strength Index (RSI). It automatically enters positions when a divergence is confirmed and manages risk with configurable stop-loss and take-profit levels.
Key Features
Automatic Divergence Detection: Scans for RSI pivot lows/highs vs. price pivots using user-defined lookback windows and bar ranges.
Dual SL/TP Methods:
- Swing-based: Stops placed a configurable percentage beyond the most recent swing high/low.
- ATR-based: Stops placed at a multiple of Average True Range, with a separate risk/reward multiplier.
Long and Short Entries: Buys on bullish divergences; sells short on bearish divergences.
Fully Customizable: Input groups for RSI, divergence, swing, ATR, and general SL/TP settings.
Visual Plotting: Marks divergences on chart and plots stop-loss (red) and take-profit (green) lines for active trades.
Alerts: Built-in alert conditions for both bullish and bearish RSI divergences.
Detailed Logic
RSI Calculation: Computes RSI of chosen source over a specified period.
Pivot Detection:
- Identifies RSI pivot lows/highs by scanning a lookback window to the left and right.
- Uses ta.barssince to ensure pivots are separated by a minimum/maximum number of bars.
Divergence Confirmation:
- Bullish: Price makes a lower low while RSI makes a higher low.
- Bearish: Price makes a higher high while RSI makes a lower high.
Entry:
- Opens a Long position when bullish divergence is true.
- Opens a Short position when bearish divergence is true.
Stop-Loss & Take-Profit:
- Swing Method: Computes the recent swing high/low then adjusts by a percentage margin.
- ATR Method: Uses the current ATR × multiplier applied to the entry price.
- Take-Profit: Calculated as entry price ± (risk × R/R ratio).
Exit Orders: Uses strategy.exit to place bracket orders (stop + limit) for both long and short positions.
Inputs and Configuration
RSI Settings: Length & price source for the RSI.
Divergence Settings: Pivot lookback parameters and valid bar ranges.
SL/TP Settings: Choice between Swing or ATR method.
Swing Settings: Swing lookback length, margin (%), and risk/reward ratio.
ATR Settings: ATR length, stop multiplier, and risk/reward ratio.
Usage Notes
Adjust the Pivot Lookback and Range values to suit the volatility and timeframe of your market.
Use higher ATR multipliers for wider stops in choppy conditions, or tighten swing margins in trending markets.
Backtest different R/R ratios to find the balance between win rate and reward.
Disclaimer
This script is for educational purposes only and does not constitute financial advice. Trading carries significant risk and you may lose more than your initial investment. Always conduct your own research and consider consulting a professional before making any trading decisions.
ICT Turtle Soup Ultimate V2📜 ICT Turtle Soup Ultimate V2 — Advanced Liquidity Reversal System
Overview:
The ICT Turtle Soup Ultimate V2 is a next-generation liquidity reversal indicator built on the principles of smart money concepts (SMC) and the classic ICT Turtle Soup setup. It is designed to detect false breakouts (liquidity grabs) at key swing points, enhanced by proprietary logic that filters out low-quality signals using a combination of trend context, kill zone timing, candle wick behavior, and multi-timeframe imbalance zones.
This tool is ideal for intraday traders seeking high-probability entry signals near liquidity pools and imbalance zones — where smart money makes its move.
🔍 What This Script Does
🧠 Liquidity Grab Detection (Turtle Soup Core Logic)
The script scans for recent swing highs/lows using a user-defined lookback.
A signal is generated when price breaks above/below a previous swing level but closes back inside — indicating a liquidity run and likely reversal.
A special Wick Trap Mode enhances this logic by detecting long-wick fakeouts — where the wick grabs stops but the candle body closes opposite the breakout direction.
📉 Trend Filter with ATR Buffer
Optional trend filter uses a simple moving average (SMA) to gauge market direction.
Instead of hard filtering, it applies an ATR-based buffer to allow for entries near the trend line, reducing signal suppression from micro-fluctuations.
🕰️ Kill Zone Session Filtering
Only show signals during institutional trading hours:
London Session
New York AM
Or any custom user-defined session
Helps traders avoid low-volume hours and focus on where stop hunts and price expansions typically occur.
🧱 Multi-Timeframe FVG Confluence (Optional)
Signal validation is strengthened by checking if price is within a higher timeframe Fair Value Gap — commonly used to identify imbalances or inefficiencies.
Filters out setups that lack underlying displacement or order flow justification.
🎨 Visual Feedback
Plots 🔺 bullish and 🔻 bearish markers at signal candles.
Optionally displays:
Swing High/Low Labels (SH / SL)
Reversal distance labels
Background color shading on valid signals
Includes built-in alerts for automated trade notification.
🔑 Unique Benefits
Wick Trap Detection: A proprietary approach to detecting stop hunts via wick behavior, not just candle closes.
ATR-based trend filtering: Avoids unnecessary filtering while still maintaining directional bias.
All-in-one system: No need to stack multiple indicators — swing detection, reversal logic, session filtering, and imbalance confirmation are all integrated.
💡 How to Use
Enable Wick Trap Mode to detect stealthy liquidity grabs with strong wicks.
Use Kill Zone filters to trade only when institutions are active.
Optionally enable FVG confluence to improve confidence in reversal zones.
Watch for Bullish signals near SL levels and Bearish signals near SH levels.
Combine with your own execution strategy or other SMC tools for optimal results.
🔗 Best Used With:
Maximize your edge by combining this script with complementary SMC-based tools:
✅ First FVG — Opening Range Fair Value Gap Detector
✅ ICT SMC Liquidity Grabs + OB + Fibonacci OTE Levels
✅ Liquidity Levels — Smart Swing Highs and Lows with horizontal line projections
Smarter Money Concepts - OBs [PhenLabs]📊 Smarter Money Concepts - OBs
Version: PineScript™ v6
📌 Description
Smarter Money Concepts - OBs (Order Blocks) is an advanced technical analysis tool designed to identify and visualize institutional order zones on your charts. Order blocks represent significant areas of liquidity where smart money has entered positions before major moves. By tracking these zones, traders can anticipate potential reversals, continuations, and key reaction points in price action.
This indicator incorporates volume filtering technology to identify only the most significant order blocks, eliminating low-quality signals and focusing on areas where institutional participation is likely present. The combination of price structure analysis and volume confirmation provides traders with high-probability zones that may attract future price action for tests, rejections, or breakouts.
🚀 Points of Innovation
Volume-Filtered Block Detection : Identifies only order blocks formed with significant volume, focusing on areas with institutional participation
Advanced Break of Structure Logic : Uses sophisticated price action analysis to detect legitimate market structure breaks preceding order blocks
Dynamic Block Management : Intelligently tracks, extends, and removes order blocks based on price interaction and time-based expiration
Structure Recognition System : Employs technical analysis algorithms to find significant swing points for accurate order block identification
Dual Directional Tracking : Simultaneously monitors both bullish and bearish order blocks for comprehensive market structure analysis
🔧 Core Components
Order Block Detection : Identifies institutional entry zones by analyzing price action before significant breaks of structure, capturing where smart money has likely positioned before moves.
Volume Filtering Algorithm : Calculates relative volume compared to a moving average to qualify only order blocks formed with significant market participation, eliminating noise.
Structure Break Recognition : Uses price action analysis to detect legitimate breaks of market structure, ensuring order blocks are identified only at significant market turning points.
Dynamic Block Management : Continuously monitors price interaction with existing blocks, extending, maintaining, or removing them based on current market behavior.
🔥 Key Features
Volume-Based Filtering : Filter out insignificant blocks by requiring a minimum volume threshold, focusing only on zones with likely institutional activity
Visual Block Highlighting : Color-coded boxes clearly mark bullish and bearish order blocks with customizable appearance
Flexible Mitigation Options : Choose between “Wick” or “Close” methods for determining when a block has been tested or mitigated
Scan Range Adjustment : Customize how far back the indicator looks for structure points to adapt to different market conditions and timeframes
Break Source Selection : Configure which price component (close, open, high, low) is used to determine structure breaks for precise block identification
🎨 Visualization
Bullish Order Blocks : Blue-colored rectangles highlighting zones where bullish institutional orders were likely placed before upward moves, representing potential support areas.
Bearish Order Blocks : Red-colored rectangles highlighting zones where bearish institutional orders were likely placed before downward moves, representing potential resistance areas.
Block Extension : Order blocks extend to the right of the chart, providing clear visualization of these significant zones as price continues to develop.
📖 Usage Guidelines
Order Block Settings
Scan Range : Default: 25. Defines how many bars the indicator scans to determine significant structure points for order block identification.
Bull Break Price Source : Default: Close. Determines which price component is used to detect bullish breaks of structure.
Bear Break Price Source : Default: Close. Determines which price component is used to detect bearish breaks of structure.
Visual Settings
Bullish Blocks Color : Default: Blue with 85% transparency. Controls the appearance of bullish order blocks.
Bearish Blocks Color : Default: Red with 85% transparency. Controls the appearance of bearish order blocks.
General Options
Block Mitigation Method : Default: Wick, Options: Wick, Close. Determines how block mitigation is calculated - “Wick” uses high/low values while “Close” uses close values for more conservative mitigation criteria.
Remove Filled Blocks : Default: Disabled. When enabled, order blocks are removed once they’ve been mitigated by price action.
Volume Filter
Volume Filter Enabled : Default: Enabled. When activated, only shows order blocks formed with significant volume relative to recent average.
Volume SMA Period : Default: 15, Range: 1-50. Number of periods used to calculate the average volume baseline.
Min. Volume Ratio : Default: 1.5, Range: 0.5-10.0. Minimum volume ratio compared to average required to display an order block; higher values filter out more blocks.
✅ Best Use Cases
Identifying high-probability support and resistance zones for trade entries and exits
Finding optimal stop-loss placement behind significant order blocks
Detecting potential reversal areas where price may react after extended moves
Confirming breakout trades when price clears major order blocks
Building a comprehensive market structure map for medium to long-term trading decisions
Pinpointing areas where smart money may have positioned before major market moves
⚠️ Limitations
Most effective on higher timeframes (1H and above) where institutional activity is more clearly defined
Can generate multiple signals in choppy market conditions, requiring additional filtering
Volume filtering relies on accurate volume data, which may be less reliable for some securities
Recent market structure changes may invalidate older order blocks not yet automatically removed
Block identification is based on historical price action and may not predict future behavior with certainty
💡 What Makes This Unique
Volume Intelligence : Unlike basic order block indicators, this script incorporates volume analysis to identify only the most significant institutional zones, focusing on quality over quantity.
Structural Precision : Uses sophisticated break of structure algorithms to identify true market turning points, going beyond simple price pattern recognition.
Dynamic Block Management : Implements automatic block tracking, extension, and cleanup to maintain a clean and relevant chart display without manual intervention.
Institutional Focus : Designed specifically to highlight areas where smart money has likely positioned, helping retail traders align with institutional perspectives rather than retail noise.
🔬 How It Works
1. Structure Identification Process :
The indicator continuously scans price action to identify significant swing points and structure levels within the specified range, establishing a foundation for order block recognition.
2. Break Detection :
When price breaks an established structure level (crossing below a significant low for bearish breaks or above a significant high for bullish breaks), the indicator marks this as a potential zone for order block formation.
3. Volume Qualification :
For each potential order block, the algorithm calculates the relative volume compared to the configured period average. Only blocks formed with volume exceeding the minimum ratio threshold are displayed.
4. Block Creation and Management :
Valid order blocks are created, tracked, and managed as price continues to develop. Blocks extend to the right of the chart until they are either mitigated by price action or expire after the designated timeframe.
5. Continuous Monitoring :
The indicator constantly evaluates price interaction with existing blocks, determining when blocks have been tested, mitigated, or invalidated, and updates the visual representation accordingly.
💡 Note:
Order Blocks represent areas where institutional traders have likely established positions and may defend these zones during future price visits. For optimal results, use this indicator in conjunction with other confluent factors such as key support/resistance levels, trendlines, or additional confirmation indicators. The most reliable signals typically occur on higher timeframes where institutional activity is most prominent. Start with the default settings and adjust parameters gradually to match your specific trading instrument and style.
Statistical OHLC Projections [neo|]█ OVERVIEW
Statistical OHLC Projections is an indicator designed to offer users a customizable deep-dive on measuring historical price levels for any timeframe. The indicator separates price into two distinct levels, "Manipulation" and "Distribution", where the idea is that for higher timeframe candles, e.g. an up-close candle, the distance from the open to the bottom of the wick would constitute the Manipulation, and the rest would be considered the Distribution. By measuring out these levels, we can gain insight on how far the market may move from higher timeframe opens to their manipulations and distributions, and apply this knowledge to our analysis.
IMPORTANT: Since levels are based on the lookback available on your chart, if the levels aren't being displayed this likely means you don't have enough lookback for your selected timeframe. To check this, enable the stat table to see how many values are available for your timeframe, and either reduce the lookback or increase your chart timeframe.
█ CONCEPTS
The core concept revolves around understanding market behavior through the lens of historical candle structure. The indicator dissects OHLC data to provide statistical boundaries of expected price movement.
- Manipulation Levels: These represent the areas typically seen as liquidity grabs or false moves where price extends in one direction before reversing.
- Distribution Levels: These highlight where the bulk of directional movement tends to occur, often following the manipulation move.
The tool aggregates this data across your selected timeframe to inform you of potential levels associated with it.
█ FEATURES
Multiple Display Types: Display statistical data through two sleek styles, areas or lines. Where areas represent the area between two customizable lookback values, and lines represent one average value.
Adjustable Timeframe Selection: Whether you want to see data based on the 1D chart, or the 1W chart, anything is possible. Simply change the timeframe on the dropdown menu and if there is sufficient lookback the indicator will adjust to your requested timeframe.
Customizable Historical Lookback: By default, the indicator will measure the average 60 values of your requested timeframe, however this may be adjusted to be higher or lower based on your preference. If you want to measure recent moves, 10-20 lookback may be better for you, or if you want more data for less volatile instruments, a value of 100 may be better.
Historical Display: Prevent historical levels from being removed by unchecking the "Remove Previous Drawings" option, this will allow you to examine how the levels previously interacted with price.
NY Midnight Anchoring: By checking the "Use NY Midnight" option, you may see the projection anchored to the New York midnight open time, which is often a significant level on indices.
Alerts: You may enable alerts for any of the indicator's provided levels to stay informed, even when off the charts.
█ How to use
To use the indicator, simply apply it to your chart and modify any of your desired inputs.
By default, the indicator will provide levels for the "1D" timeframe, with a desired lookback of 60, on most instruments and plans this can be gotten when you are on the 30 minute timeframe or above.
When price reaches or extends beyond a manipulation level, observe how it reacts and whether it rejects from that level, if it does this may be an indication that the candle for the timeframe you selected may be reversing.
█ SETTINGS AND OPTIONS
Customize the indicator’s behavior, timeframe sources, and visual appearance to fit your analysis style. Each setting has been designed with flexibility in mind, whether you're working on lower or higher timeframes.
Display Mode: Switch between different display styles for levels: - Default: Shows all statistical levels as individual lines.
- Areas: Plots filled zones between two customizable lookbacks to represent the range between them.
This is ideal for visually mapping high-probability zones of price activity.
Timeframe Settings:
- Show First/Second Timeframe: Choose to show one or both timeframe projections simultaneously.
- First Timeframe / Second Timeframe: Define the higher timeframe candle you want to base calculations on (e.g., 1D, 1W).
- Use NY Midnight: When enabled and using the daily timeframe, the levels will be anchored to the New York Midnight Open (00:00 EST), a key institutional timing reference, especially useful for indices and forex.
Calculation Settings:
- Main Lookback Period: The number of historical candles used in the statistical calculations. A lower number focuses on recent price action, while a higher number smooths results across broader history.
- First Lookback / Second Lookback: Used when “Areas” mode is selected to define the range of the shaded zone. For example, an area from 20 to 60 candles creates a band between short- and long-term price behavior averages.
Visual Settings:
- Line Style: Set your preferred visual style: Solid, Dashed, or Dotted.
- Remove Previous Drawings: When enabled, only the most recent projection is shown on the chart. Disable to retain previous levels and visually backtest their reactions over time.
Color Settings:
Customize each level independently to match your chart theme:
- Manipulation High/Low
- Distribution High/Low
- Open Level
- Label Text Color
Premium/Discount Zones:
- Enable Premium/Discount Zones: Overlay price zones above and below equilibrium to visualize potential overbought (premium) and oversold (discount) areas.
- Premium/Discount Colors: Fully customizable zone colors for clarity and emphasis.
Table Settings:
- Show Statistics Table: Adds an on-chart table summarizing key levels from your active timeframe(s).
- Table Cell Color: Set the background color of the table cells for visibility.
- Table Position: Choose from preset chart locations to position the table where it works best for your layout.
Alerts:
Stay on top of price interactions with key levels even when you're away from the charts.
- Manipulation Hits (High)
- Manipulation Hits (Low)
- Distribution Hits (High)
- Distribution Hits (Low)
ICT Breakers (BOS / MSS - Market Structure) [ICTProTools]The Breakers (Market Structure) indicator is designed to help traders identify true breaker structures , a key concept in Inner Circle Trader (ICT) methodology. In market structure, Breakers represent powerful shifts where a key high or low is broken, leading to a reversal in market direction. Most tools misinterpret structure shifts, using internal structure , leading to fake breakouts. This tool solves that problem by filtering out false signals , providing clear & structured insights , all with multi-timeframe compatibility.
💎 Key Features
⚡️ Breakers in action
The indicator shows the structure following ICT instructions. A breaker is defined by two lines:
The first line confirms the previous trend (it could be interpreted as a BOS).
The second line highlights the moment price breaks structure (with candle body or wick based on your chosen settings), signaling a shift in trend direction (like an MSS).
Furthermore, it’s important to note that a breaker not only shows the structure, but also defines a potential Point of Interest (POI), an area where price may retrace before continuing its trend.
Here, we can observe two clear structure shifts.
On the far left, the market was in a bearish trend, illustrated by the first visible (dotted and red) line. Shortly after, the second (solid and green) line appears, showing a break that initiates a new bullish trend.
This upward movement continues, with the last confirmation marked by a top structure line. And finally, the structure is broken once again indicating a transition back into a bearish trend.
💪 Real Structure with True Highs / Lows
Unlike many indicators that detect internal breakouts , this tool follows ICT’s true market structure rules .
In a bearish trend , a bullish breaker is only confirmed when the high that created the low is broken , and conversely for a bullish scenario.
Fake breakouts are ignored, preventing misleading signals.
In the image above, the white breakout is correctly ignored by the indicator, as it doesn't align with ICT’s structural rules. That white high is simply part of the internal structure, not the true swing point. Instead, the green line highlights the key level that truly matters, the one whose rupture would have confirmed a real change in market structure.
🔔 Smart Alerts for Structure Updates
Stay one step ahead with customizable alerts designed to notify you instantly when market structure changes occur.
Get notified for BOS (Continuation) and / or MSS (Breaker) events.
Set alerts for bullish , bearish , or both directions.
Choose between once or repeated alerts , based on your strategy.
This feature allows traders to remain focused and reactive , even when monitoring multiple markets.
In the alert settings, select which structure shifts you want to be notified of. Whether you're a scalper or a swing trader, the alerts keep you connected to key moments without needing to constantly monitor the chart.
⏳ Multi-Timeframe Structure
All features of the indicator are fully compatible with higher timeframes .
Get a broader view of market structure without switching timeframes.
Monitor higher timeframe structures and receive alerts, all without leaving your analysis chart .
In this example, the market structure of the 30m timeframe is displayed while on a 5m chart, providing a clearer perspective.
✨ Customization & User Control
Make it yours! The indicator allows full customization:
Swing bars (to confirm high / low)
Select your mode for Breakers (MSS) , using the candle body only or body / wick
Line style (type, width, color)
Choice of displayed timeframe
Activate any alert , with the frequency you want
🎯 Conclusion
✅ Avoid false signals by focusing on true ICT Breakers
✅ Smart alerts to never miss a structural shift
✅ Multi-timeframe support for enhanced analysis
✅ Clean & professional design for an optimal trading experience
Market Trend Levels Detector [BigBeluga]Market Trend Levels Detector is an trend-following tool that utilizes moving average crossovers to identify key market trend levels. By detecting local highs and lows after EMA crossovers, the indicator helps traders track significant price zones and trend strength.
🔵 Key Features:
EMA Crossover-Based Trend Levels Detection:
Uses a fast and slow EMA to detect market flow shifts.
When the fast EMA crosses under the slow EMA, the indicator searches for the most recent local top and marks it with a label and horizontal level.
When the fast EMA crosses over the slow EMA, it searches for the most recent local low and marks it accordingly.
Dynamic Zone Levels:
Each detected high or low is plotted as a horizontal level, highlighting important price zones.
Traders can extend these levels to observe how price interacts with them over time.
If price crosses a level, its extension stops. Uncrossed levels continue expanding.
Gradient Trend Band Visualization:
The trend band is formed by shading the area between the two EMAs.
Color intensity varies based on volatility and trend strength.
Strong trends and high volatility areas appear with more intense colors, making trend shifts visually distinct.
🔵 Usage:
Trend Identification: Use EMA crossovers and trend bands to confirm bullish or bearish momentum.
Key Zone Mapping: Observe local high/low levels to track historical reaction points.
Breakout & Rejection Signals: Monitor price interactions with extended levels to assess potential breakouts or reversals.
Volatility Strength Analysis: Use color intensity in the trend band to gauge trend power and possible exhaustion points.
Scalping & Swing Trading: Ideal for both short-term scalping strategies and larger swing trade setups.
Market Trend Levels Detector is a must-have tool for traders looking to track market flow, key price levels, and trend momentum with dynamic visual cues. It provides a comprehensive approach to identifying high-probability trade setups using EMA-based flow detection and trend analysis.
Fib Speed Resistance Fan"Fib Speed Resistance Fan," automatically draws Fibonacci Speed Resistance Fan lines based on the first and third candles of the trading session. Here’s a breakdown of its functionality:
Functionality
Session Start Time Identification
The script identifies the first candle at 9:15 AM using timestamp(), which ensures it captures the market's opening candle.
Candle Indexing
It determines the index of the first candle (firstCandleIndex) using ta.barssince(time >= sessionStart).
The third candle is found by adding two bars to the first candle's index (thirdCandleIndex = firstCandleIndex + 2).
Ensuring Single Execution
A boolean flag hasDrawn ensures that the lines are drawn only once and do not update on future candles.
Validating Data
It checks if the firstCandleIndex and thirdCandleIndex are valid (validSession).
If conditions are met, it extracts the highs and lows of the first and third candles.
Fibonacci Calculation
The script calculates a 0.75 level price between the first candle high/low and third candle low/high.
This level helps in drawing intermediate Fibonacci fan lines.
Drawing the Fibonacci Speed Resistance Fan
If conditions are valid and hasDrawn is false, the script draws:
Main fan lines from:
First candle high → Third candle low (Blue line)
First candle low → Third candle high (Blue line)
Prev Day & Curr Day H/L + Opening Range (9:30, 5min)Script Description:
This TradingView Pine Script is designed for use on a 5‑minute chart and plots key price levels for daily trading analysis. It automatically draws:
• Previous Day High/Low Lines:
These lines mark the previous day’s regular trading hours (RTH) high and low levels, with labels (“PDH” and “PDL”) for easy identification.
• Current Day High/Low Lines:
As the trading day progresses, the script updates and displays the current day’s RTH high and low levels, labeled as “CDH” and “CDL”.
• Opening Range for 9:30 AM:
The script specifically identifies the first 5‑minute candle at 9:30 AM (using the “America/New_York” time zone) and draws two additional lines at its high and low. These lines are labeled “HighOpen” and “LowOpen” to indicate the opening range.
All lines are drawn with a width of 5 and have configurable colors, styles, and extension lengths. The script automatically resets at the start of each new day, ensuring that the plotted levels are current and relevant for daily trading decisions.