ICT 00:00, 08:30, 09:30 & 13:30 Opens (NY) — Prior-Day HistoryICT 00:00, 08:30, 09:30 & 13:30 Opens (NY)
This is a derivative of ALPHAICTRADER’s open-source script, republished under the MPL-2.0 with clear attribution and documented changes. It plots four New-York–anchored intraday reference levels—0000, 0830, 0930, 1330—as short, right-padded stubs with clean side labels. Use these time anchors (ICT-style midnight + key US windows) to frame bias, volatility pockets, and intraday trade locations.
What’s original in this version (changes)
Right-padded stubs instead of chart-wide rays — each level ends N bars past the latest candle (configurable).
Side labels at the line tip — text-only labels (0000, 0830, 0930, 1330) that sit at the right end of each stub and update every bar.
Optional prior-day history — show Today only or Today + Prior Day; older lines/labels auto-pruned.
Per-anchor controls — Display, Style, Color, Width, and Show Label for each time.
What it plots (and why)
0000 (NY Midnight): daily session anchor for bias/liquidity context.
0830 (NY): macro data window (CPI/NFP/claims) where volatility often concentrates.
0930 (NY): US cash equity market open; opening-drive structure/acceptance tests.
1330 (NY): early-afternoon anchor for continuation vs. fade.
How it works (under the hood)
Session detection: time("1", session, "America/New_York"); first bar flagged via not na(ts) and na(ts ).
Anchor price: open of that first bar per session/day.
Rendering: lines drawn with xloc=bar_index from start bar to bar_index + Right Pad; x2 updates every bar (no extend.right).
Labels: placed at line.get_x2(line) + Label Pad, soft color variant; updated per bar to stay on the tip.
History: arrays keep either today only or today + yesterday and delete anything older immediately.
How to use
Add to any intraday chart (futures/FX/indices). Anchors are always NY-time; TradingView handles DST.
Inputs
00:00 / 08:30 / 09:30 / 13:30 (NY): Display, Line Style, Color, Width, Show Label
Right Edge: Right Pad (bars) · Label Pad (bars)
History: Show Prior Day (History) — off = today only; on = today + yesterday
Suggested pads: Right Pad 2–5 bars; Label Pad 0–2.
These are context anchors, not signals. Combine with your execution model (market structure, liquidity, FVG/OBs, etc.).
Attribution & License (MPL-2.0)
Original work: “ICT NEW YORK MIDNIGHT OPEN AND 8.30 AM OPEN” by ALPHAICTRADER (MPL-2.0).
This derivative: modifications listed above; source published and kept under MPL-2.0 per license terms.
If you distribute a modified version of this Pine file, you must keep MPL-2.0, retain the copyright/licensing header, publish your modified source, and document your changes.
Notes: Pine v5. Minimalist (no day dividers). Educational tool; not financial advice.
Copyright: © ALPHAICTRADER 2022 · © Funk 2025
License: MPL-2.0
在腳本中搜尋"ict"

SMT Divergence ICT 02 [TradingFinder] Smart Money Technique SMC🔵 Introduction
SMT Divergence (Smart Money Technique Divergence) is a price action-based trading concept that detects discrepancies in market behavior between two assets that are generally expected to move in the same direction. Rooted in ICT (Inner Circle Trader) methodology, this approach helps traders recognize subtle signs of market manipulation or imbalance, often ahead of traditional indicators.
The core idea behind SMT divergence is simple: when two correlated instruments—such as currency pairs, indices, or assets from the same sector—start forming different swing points (highs or lows), this can reveal a lack of confirmation in the trend. Such divergence is often a precursor to a price reversal or pause in momentum.
This technique works effectively across various markets including Forex, stocks, and cryptocurrencies. It’s particularly valuable when used alongside concepts like liquidity sweeps, market structure breaks (MSBs), or order block identification.
In advanced use cases, Sequential SMT helps uncover patterns of alternating divergences across sessions, often signaling engineered liquidity traps before price reacts.
When combined with the Quarterly Theory—which segments market behavior into Accumulation, Manipulation, Distribution, and Continuation/Reversal phases—traders gain insight not only into where divergence happens, but when it's most likely to be significant within the market cycle.
Bullish SMT :
Bullish SMT Divergence occurs when one asset prints a higher low while the correlated asset forms a lower low. This asymmetry often suggests that the downside move is losing strength, hinting at a potential bullish shift.
Bearish SMT :
Bearish SMT Divergence is formed when one asset creates a higher high, while the second asset fails to confirm by printing a lower high. This typically signals weakening bullish pressure and the possibility of a reversal to the downside.
🔵 How to Use
The SMT Divergence indicator is designed to detect imbalances between two positively correlated assets—such as major currency pairs, indices, or commodities. These divergences often indicate early signs of market inefficiency or smart money manipulation and can help traders anticipate trend shifts with higher precision.
Unlike traditional divergence indicators or earlier versions of this script, this upgraded version does not rely solely on consecutive pivot comparisons. Instead, it dynamically scans all available pivots within the chart to identify divergences at any structural level—major or minor—across the price action. This broader detection method increases the reliability and frequency of meaningful SMT signals.
Moreover, when integrated with Sequential SMT logic, the indicator is capable of identifying multiple divergence sequences across sessions. These sequences often signal engineered liquidity traps and can be mapped within the Quarterly Theory framework, allowing traders to pinpoint not just the presence of divergence but also the phase of the market cycle it appears in (Accumulation, Manipulation, Distribution, or Continuation).
🟣 Bullish SMT Divergence
This signal occurs when the primary asset forms a higher low, while the correlated asset forms a lower low. This pattern implies weakening bearish momentum and a potential shift to the upside.
If the correlated asset breaks its previous low but the primary asset does not, this divergence suggests absorption of selling pressure and possible accumulation by smart money—making it a strong bullish signal, especially when aligned with a favorable market phase (e.g., the end of a manipulation phase in Q2).
🟣 Bearish SMT Divergence
This signal occurs when the primary asset creates a higher high, while the correlated asset forms a lower high. This mismatch indicates fading bullish momentum and a potential reversal to the downside.
If the correlated asset fails to confirm a breakout made by the main asset, the divergence may point to distribution or exhaustion. When seen within Q3 or Q4 phases of the Quarterly Theory, this pattern often precedes sharp declines or fake-outs engineered by smart money
🔵 Settings
⚙️ Logical Settings
Symbol : Choose the secondary asset to compare with the main chart asset (e.g., XAUUSD, US100, GBPUSD).
Pivot Period : Sets the sensitivity of the pivot detection algorithm. A smaller value increases responsiveness to price swings.
Activate Max Pivot Back : When enabled, limits the maximum number of past pivots to be considered for divergence detection.
Max Pivot Back Length : Defines how many past pivots can be used (if the above toggle is active).
Pivot Sync Threshold : The maximum allowed difference (in bars) between pivots of the two assets for them to be compared.
Validity Pivot Length : Defines the time window (in bars) during which a divergence remains valid before it's considered outdated.
🎨 Display Settings
Show Bullish SMT Line : Draws a line connecting the bullish divergence points.
Show Bullish SMT Label : Displays a label on the chart when a bullish divergence is detected.
Bullish Color : Sets the color for bullish SMT markers (label, shape, and line).
Show Bearish SMT Line : Draws a line for bearish divergence.
Show Bearish SMT Label : Displays a label when a bearish SMT divergence is found.
Bearish Color : Sets the color for bearish SMT visual elements.
🔔 Alert Settings
Alert Name : Custom name for the alert messages (used in TradingView’s alert system).
Message Frequency :
All : Every signal triggers an alert.
Once Per Bar : Alerts once per bar regardless of how many signals occur.
Per Bar Close : Only triggers when the bar closes and the signal still exists.
Time Zone Display : Choose the time zone in which alert timestamps are displayed (e.g., UTC).
Bullish SMT Divergence Alert : Enable/disable alerts specifically for bullish signals.
Bearish SMT Divergence Alert : Enable/disable alerts specifically for bearish signals
🔵Conclusion
The SMT Plus indicator offers a refined and powerful approach to detecting smart money behavior through divergence analysis between correlated assets. By removing the limitations of consecutive pivot comparisons and allowing for broader structural detection, it captures more accurate and timely signals that often precede major market moves.
When paired with frameworks like Sequential SMT and the Quarterly Theory, the indicator not only highlights where divergence occurs, but also when in the market cycle it's most likely to matter. Its flexible settings, customizable visuals, and integrated alert system make it suitable for intraday scalpers, swing traders, and even long-term macro analysts.
Whether you're using it as a standalone decision-making tool or combining it with other ICT concepts, SMT Plus gives you an edge in recognizing manipulation, timing reversals, and staying in sync with the real market narrative—not just the chart.

ICT & RTM Price Action IndicatorICT & RTM Price Action Indicator
Unlock the power of precision trading with this cutting-edge indicator blending ICT (Inner Circle Trader) concepts and RTM (Reversal Trend Momentum) strategies. Designed for traders who demand clarity in chaotic markets, this tool pinpoints high-probability buy and sell signals with surgical accuracy.
What It Offers:
Smart Supply & Demand Zones: Instantly spot key levels where the market is likely to reverse or consolidate, derived from a 50-period high/low analysis.
Filtered Reversal Signals: Say goodbye to fakeouts! Signals are confirmed with volume spikes (1.5x average) and a follow-through candle, ensuring you trade only the strongest moves.
Trend-Aware Logic: Built on a customizable SMA (default 14), it aligns reversals with momentum for trades that stick.
One-Signal Discipline: No clutter—only the first valid signal appears until an opposing setup triggers, keeping your chart clean and your focus sharp.
Combined Power: A unique "TRADE" signal merges ICT zones with RTM reversals for setups with double the conviction.
Why You’ll Love It:
Whether you’re scalping intraday or hunting swing trades, this indicator adapts to your style. It’s not just another tool—it’s your edge in decoding price action like a pro. Test it, tweak it, and watch your trading transform.

ICT Concepts [SB]ICT Market Structure Shift (MSS) Alert Indicator
This indicator identifies Market Structure Shifts (MSS) based on ICT concepts, helping traders spot key reversal or continuation points in price action.
Features:
✅ Detects bullish and bearish MSS using swing highs and swing lows.
✅ Customizable lookback period to fine-tune structure identification.
✅ Alerts for confirmed MSS when price breaks structure with momentum.
✅ Option to filter MSS by higher timeframe bias for confluence.
✅ Highlights liquidity sweeps before a shift to confirm smart money activity.
✅ Works on all timeframes and asset classes, including Forex, Stocks, Crypto, and Futures.
How It Works:
Bullish MSS: Occurs when price breaks above a recent swing high after taking out a previous swing low (liquidity grab).
Bearish MSS: Occurs when price breaks below a recent swing low after taking out a previous swing high.
Can be used standalone or combined with FVGs, Order Blocks, and Premium/Discount zones for high-probability setups.
Best Usage:
Scalping: 1m–5m timeframe for intraday reversals.
Intraday Trading: 15m–1H for session-based structure shifts.
Swing Trading: 4H–Daily for macro trend reversals.
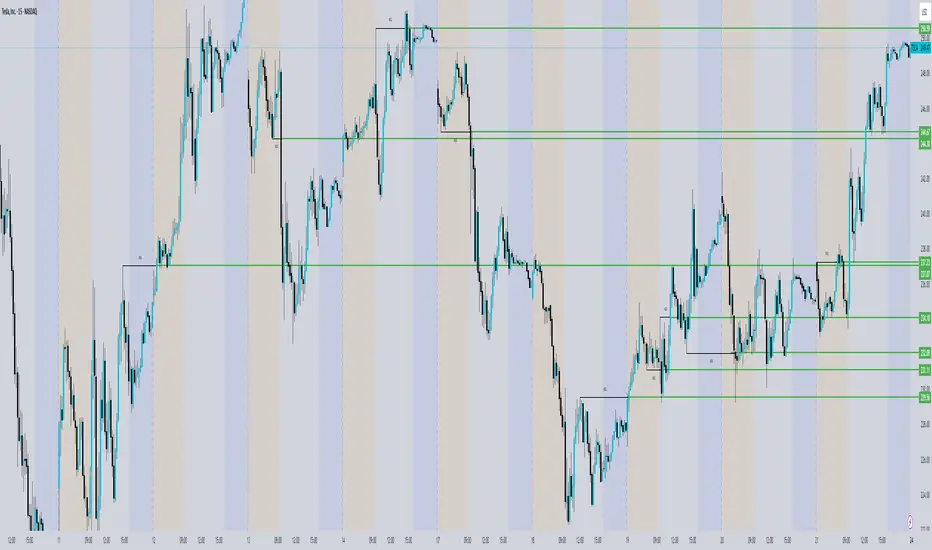
Look for retest of MSS for entries after they fail as appears in chart highlighted by green horizontal lines or FVG to support after shifts.
Perfect for traders who use ICT, Smart Money Concepts (SMC), and Market Structure-based strategies.
[TehThomas] - ICT VI / FVG / IFVG / Liquidity📌 Overview
This TradingView indicator is designed to help traders spot key price inefficiencies and liquidity events based on ICT (Inner Circle Trader) concepts. The script automatically highlights important areas on the chart, such as Volume Imbalances (VI), Fair Value Gaps (FVG), Inverted Fair Value Gaps (IFVG), and Liquidity Sweeps, giving traders a clear view of where price might react.
By marking these zones visually, the indicator serves as a liquidity map, showing where smart money could be targeting orders or rebalancing price action.
🔑 How the Script Works
The indicator detects four major market inefficiencies and liquidity patterns, each offering valuable insights into how price might behave:
1️⃣ Volume Imbalance (VI)
Bullish VI: When the current candle has higher volume than the previous candle in an upward move, this suggests demand is pushing the price up, creating potential buying opportunities.
Bearish VI: When the current candle has higher volume than the previous candle in a downward move, this suggests supply is pushing the price down, highlighting potential selling opportunities.
How to take trades:
Buy: Enter a long position when a bullish VI appears and the price is near a support zone or key level (such as the previous swing low or FVG).
Sell: Enter a short position when a bearish VI appears and the price is near a resistance zone or key level (such as the previous swing high or FVG).
2️⃣ Fair Value Gap (FVG)
Bullish FVG: A gap in price action where the low of the second candle is higher than the high of the first candle. Price tends to return to fill these gaps before continuing upward.
Bearish FVG: A gap in price action where the high of the second candle is lower than the low of the first candle. Price tends to return to fill these gaps before continuing downward.
How to take trades:
Buy: Enter long after a pullback into a bullish FVG zone and if price action shows signs of rejection (such as bullish candlestick patterns or strong momentum).
Sell: Enter short after a pullback into a bearish FVG zone and if price action shows signs of rejection (such as bearish candlestick patterns or strong downward momentum).
3️⃣ Inverted Fair Value Gap (IFVG)
An Inverted Fair Value Gap (IFVG) refers to a Fair Value Gap (FVG) that has already been filled or broken through by price action. Essentially, it is a gap that has been revisited by price and has now been mitigated or broken.
Example:
For Continuation: After price fills the gap, it may continue in the same direction. If price breaks through a bullish FVG and shows continuation, it may signal that the market is still in a strong uptrend.
For Reversal: If the price returns to an inverted FVG after breaching it, and then starts showing signs of reversal (e.g., reversal candlestick patterns, or a shift in momentum), this could signal an entry point in the opposite direction.
How to take trades:
Buy: Consider entering long when price returns to an IFVG zone that aligns with other bullish confluences, such as a bullish VI or liquidity sweep.
Sell: Consider entering short when price returns to a bearish IFVG zone that aligns with other bearish confluences, such as a bearish VI or liquidity sweep.
4️⃣ Liquidity Sweeps
Liquidity sweeps occur when the market temporarily breaks a key high or low to trigger stop-loss orders or lure traders into the wrong direction before reversing.
How to take trades:
Buy: If a liquidity sweep breaks a key resistance or swing high but fails to close above it, enter long when price begins to reverse in the opposite direction, ideally near a previous support or FVG zone.
Sell: If a liquidity sweep breaks a key support or swing low but fails to close below it, enter short when price begins to reverse in the opposite direction, ideally near a previous resistance or FVG zone.
🎯 Trade Setup and Confirmation Strategy
Here’s how to combine these concepts for high-probability trade setups:
Liquidity Sweeps + Volume Imbalances:
If a liquidity sweep occurs in conjunction with a volume imbalance (especially on a higher timeframe), this can act as a confirmation signal to enter the trade.
Example: A liquidity sweep breaks a previous high, but the price fails to close above it. If this happens alongside a break of a Volume imbalance (VI) , it could be a strong signal to sell.
FVG/IFVG Mitigation + Liquidity Sweeps:
Price often returns to mitigate imbalances, and when a liquidity sweep occurs near an unfilled gap, it could trigger a reversal.
Example: After an upward trend, a bearish liquidity sweep breaks a previous swing low, and price then revisits a bearish FVG and creates an IFVG, signaling an opportunity to buy.
Directional Bias (Higher Timeframe Analysis):
Always consider the higher timeframe trend to confirm trade direction. A bullish FVG or bullish VI on the lower timeframe aligns with a bullish trend on the higher timeframe.
Confluence with Key Levels:
When these patterns align with important price levels such as support, resistance, or previously identified swing highs/lows, it enhances the probability of a successful trade.
⚙️ How It Helps in Trading Strategy
The indicator assists in several aspects of trading:
Liquidity Hunts: Price often sweeps liquidity before making major moves.
Entry Confirmation: Use imbalances or sweeps as extra confluence for trade entries.
Mitigation Zones: Price frequently returns to fill inefficiencies before reversing.
Directional Bias: Bullish or bearish gaps align with the higher timeframe narrative.
🔍 ICT Concepts Included
✅Volume Imbalance (VI): High-volume inefficiencies.
✅Fair Value Gap (FVG): Standard price gaps.
✅Inverted Fair Value Gap (IFVG): Filtered large price gaps.
✅Liquidity Sweeps: Stop-hunting patterns by smart money.
⚠️ Disclaimer
This indicator is built for educational purposes and should not be considered financial advice. Trading carries risk, and no tool guarantees profits. Always use proper risk management and perform your own analysis before entering any trade.

ICT Dealing RangeICT Dealing Range
This indicator identifies and plots ICT (Inner Circle Trader) Dealing Ranges - key institutional areas where smart money accumulates or distributes positions before significant moves.
What is a Dealing Range?
A Dealing Range is a significant price area where institutional traders accumulate or distribute their positions. These ranges form through a specific sequence of price movements that indicate institutional order flow:
Bullish Dealing Range Sequence:
1. Initial High (H)
2. Initial Low (L)
3. Higher High (HH)
4. Lower Low (LL)
5. Break above HH (confirmation)
Bearish Dealing Range Sequence:
1. Initial Low (L)
2. Initial High (H)
3. Lower Low (LL)
4. Higher High (HH)
5. Break below LL (confirmation)
My Trading Strategy
Entry Methods:
1. Range Extreme Retests:
- After range formation, wait for price to return to either extreme
- Long entries at range bottom with stops below
- Short entries at range top with stops above
2. Mid-Line Strategy:
- Use the mid-line as a pivot point for reversals
- Long entries on mid-line bounce with stops below
- Short entries on mid-line rejection with stops above
Stop Loss Placement:
- When entering at extremes: Place stops beyond the mid
- When entering at mid-line: Place stops beyond the opposing extreme
- Always respect the structure's boundaries
Take Profit Targets:
- Minimum 2:1 Risk-Reward ratio
- For extreme entries: Target the opposite extreme
- For mid-line entries: Target the nearest extreme
Risk Management
- Never enter without a clear invalidation point
- Maintain minimum 2:1 RR ratio
- Consider market structure and higher timeframe context
Indicator Features
- Auto-detection of dealing range patterns
- Color-coded boxes (green for bullish, red for bearish)
- Optional mid-line display
- Customizable colors and styles
- Adjustable pivot lookback periods
Notes
This tool is based on ICT concepts but should be used in conjunction with other forms of analysis. The dealing range provides a framework for understanding institutional order flow, but proper risk management and market context are essential for successful trading.
Remember: The best trades often come from clean retests of these ranges after their initial formation. Patience in waiting for proper setups is key to successful implementation.

ICTProTools | ICT Insight - Market Environment🚀 INTRODUCTION
The Market Environment Indicator provides traders with an essential contextual framework for analyzing price movements. Built on the principles of ICT (Inner Circle Trader) and Smart Money Concepts (SMC), this tool offers a structured view of how institutional players drive markets through liquidity manipulation and price level interactions. By defining the market environment, the indicator helps traders focus on the most relevant price zones, reducing distractions and enhancing decision-making.
At its core, the Interbank Dealing Range (IBDR) creates a clear structure of protected highs/lows and Premium/Discount zones , highlighting key areas for potential price reactions. This framework gives traders a lens to interpret market behavior and concentrate on meaningful liquidity zones and price action. The indicator helps traders navigate the market with precision, spotting significant opportunities while filtering out market noise. Indeed, the IBDR isn't always easily identifiable, and not every move will form a distinct dealing range.
This indicator goes beyond mere price levels… It reveals the larger market context in which prices evolve. By mastering this environment, traders can align their strategies with institutional logic and make well-informed decisions.
💎 FEATURES
The Interbank Dealing Range (IBDR) is a crucial concept within the ICT methodology that helps traders identify the market environment across multiple timeframes, specifically the premium and discount zones. The IBDR delineates areas where traders have the potential to buy low and sell high.
Its extremes are defined by the sweep of both buy-side and sell-side liquidity . These levels indicate the boundaries within which price is expected to evolve . Understanding these boundaries allows traders to determine where it is appropriate to enter or exit trades.
The primary goal of utilizing the IBDR is to capitalize on price movements by buying at discounted levels and selling at premium levels. This strategy aligns with the fundamental principle of trading: to buy at lower prices and sell at higher prices, maximizing profit potential.
By visualizing the IBDR on your charts, you can gain valuable insights into the prevailing market conditions and make informed trading decisions that align with the institutional approach to buying and selling.
This chart illustrates the Interbank Dealing Range (IBDR) applied to the US100 index, displaying two from different timeframes: a 1-hour (1h) IBDR on the left and a 30-minute (30m) IBDR on the right. This multi-timeframe view provides essential context for price action analysis.
The 1h IBDR could here function as the primary reference range, establishing key boundaries (High and Low) for price movement. Within this range, the Equilibrium (midpoint) separates the Premium zone (above) from the Discount zone (below). The 0.25 and 0.75 levels add further precision by subdividing these zones.
Price action then flows between these zones, creating and targeting liquidity at higher and lower levels through Relative Equal Highs and Lows. A strong upward movement into the deeper level of the Premium Zone captures high-side liquidity (with a notable reaction at the FVG on the left), forming a secondary 30m IBDR. After this liquidity sweep, the remaining liquidity is on the low side. Price then reverses downward toward it. Here, the 30m IBDR would suggest a confirmation for a potential sell entry by targeting the IBDR lows.
The relationship between the broader 1h IBDR, the more detailed 30m IBDR, and all related levels creates a powerful analytical framework. The larger timeframe provides context, while the smaller one reveals specific trading opportunities by providing entry confirmations.
✨ SETTINGS
IBDR Metrics: Adjust the timeframe and sensitivity for calculating the IBDR so traders can adapt the indicator to both short-term intraday movements and longer-term trends.
Premium/Discount Zones: Customize the levels such as 0, 0.5, 1, and other levels like 0.25 and 0.75 by default and their displayed colors and associated labels.
Alerts: Configure the alerts for Premium/Discount zones, High/Low breaks, and new IBDR, ensuring traders are kept up to date on key market events.
🎯 CONCLUSION
The Market Environment indicator serves as a powerful tool for analyzing and navigating market structure through liquidity zones. It helps identify optimal buy and sell areas while aligning with the institutional logic of major market players. While its features provide a valuable edge, it’s essential to remember that none should be used on its own, and many more factors go into being a profitable trader.

Immediate Rebalance ICT [TradingFinder] No Imbalances - MTF Gaps🔵 Introduction
The concept of "Immediate Rebalance" in technical analysis is a powerful and advanced strategy within the ICT (Inner Circle Trader) framework, widely used to identify key market levels.
Unlike the "Fair Value Gap," which leaves a price gap requiring a retracement for a fill, an Immediate Rebalance fills the gap immediately, representing an instant balance that strengthens the prevailing market trend. This structure allows traders to quickly spot critical price zones, capitalizing on strong trend continuations without the need for price retracement.
The "Immediate Rebalance ICT" indicator leverages this concept, providing traders with automated identification of critical supply and demand zones, order blocks, liquidity voids, and key buy-side and sell-side liquidity levels.
Through features like crucial liquidity points and immediate rebalancing areas, this tool enables traders to perform precise real-time market analysis and seize profitable opportunities.
🔵 How to Use
The Immediate Rebalance indicator assists traders in identifying reliable trading signals by detecting and analyzing Immediate Rebalance zones. By focusing on supply and demand areas, the indicator pinpoints optimal entry and exit positions.
Here’s how to use the indicator in both bearish (Supply Immediate Rebalance) and bullish (Demand Immediate Rebalance) structures :
🟣 Bullish Structure (Demand Immediate Rebalance)
In a bullish scenario, the indicator detects a Demand Immediate Rebalance formed by two consecutive bullish candles with overlapping wicks. This structure signifies an immediate demand zone, where price instantly balances within the zone, reducing the likelihood of a revisit and indicating potential upside momentum.
Zone Identification : Look for two consecutive bullish candles with overlapping wicks, forming a demand zone. This structure, due to its rapid balance, usually does not require a revisit and supports further upward movement.
Entry and Exit Levels : If price revisits this zone, percentage markers, particularly 50% and 75%, act as supportive levels, creating ideal entry points for long positions.
Example : In the second image, an example of a Demand Immediate Rebalance is shown, where overlapping bullish candle shadows indicate immediate balance, supporting the continuation of the bullish trend.
🟣 Bearish Structure (Supply Immediate Rebalance)
In a bearish setup, the indicator identifies a Supply Immediate Rebalance when two consecutive bearish candles with overlapping wicks appear. This formation signals an immediate supply zone, suggesting a high probability of trend continuation to the downside, with minimal expectation for price to retrace back to this area.
Zone Identificatio n: Look for two consecutive bearish candles with overlapping shadows. This structure forms a supply area where price is expected to continue its downtrend without revisiting the zone.
Entry and Exit Level s: Should price revisit this zone, percentage-based levels (e.g., 50% and 75%) serve as potential resistance points, optimizing entry for short positions, especially if the downtrend is expected to persist.
Example : The attached chart illustrates a Supply Immediate Rebalance, where overlapping candle shadows define this area, reassuring traders of a continued downward trend with a low likelihood of price returning to this zone.
🔵 Settings
ImmR Filter : This filter allows users to adjust the detection of Immediate Rebalance zones in four modes, from "Very Aggressive" to "Very Defensive," based on zone width. The chosen mode controls the sensitivity of Immediate Rebalance detection, allowing users to fine-tune the indicator to their trading style.
Multi Time Frame : Enabling this option allows users to set the indicator to a specific timeframe (1 minute, 5 minutes, 15 minutes, 30 minutes, 1 hour, 4 hours, daily, weekly, or monthly), broadening the perspective for identifying Immediate Rebalance zones across multiple timeframes.
🔵 Conclusion
The Immediate Rebalance indicator, based on rapid balancing zones within supply and demand areas, serves as a powerful tool for market analysis and improving trade decision-making.
By accurately identifying zones where price achieves instant balance without gaps, the indicator highlights areas likely to support strong trend continuations, exempt from common retracements.
The indicator’s use of percentage levels enables traders to pinpoint optimal entry and exit points more effectively, with levels like 50% and 75% acting as support within demand zones and resistance within supply zones. This empowers traders to ride strong trends without the worry of abrupt reversals.
Overall, the Immediate Rebalance is a reliable tool for both professional and beginner traders seeking precise methods to recognize supply and demand zones, capitalizing on consistent trends.
By choosing appropriate settings and focusing on the zones highlighted by this indicator, traders can enter trades with greater confidence and improve their risk management.

[TTM] ICT Key Levels🌟 Overview 🌟
This tool highlights key price levels, such as highs, lows, and session opens, that can influence market moves. Based on ICT concepts, these levels help traders spot potential areas for market reversals or trend continuations.
🌟 Key Levels 🌟
🔹 Week Open (00:00 EST)
Marks the start of the trading week. This level helps track price direction and is useful for framing the Weekly candle formation using ICT’s Power of 3.
🔹 Midnight Open (00:00 EST)
The Midnight Open (MNOP) marks the start of the new trading day. Price often retraces to this level for liquidity grabs, setting up larger moves in the daily trend. It's also key for framing the Daily Power of 3 and spotting possible market manipulation.
🔹 New York Stock Exchange Open (09:30 EST)
The NYSE Open is a major liquidity event, where price seeks liquidity from earlier in the day, like stop hunts or retracements to the London or Midnight Open. This time often brings reversals or trend continuations as volatility increases.
🔹 Previous Day High/Low
These levels show where liquidity rests, often serving as targets for price revisits, ideal for reversals or continuation trades.
🔹 Previous Week High/Low
Similar to daily levels but on a larger scale. They help identify swing trades and track broader market trends.
🔹 Previous Month High/Low
These monthly levels are important for long-term traders, as price often aims to clear them before setting new trends or market cycles.
Happy Trading!
TheTickMagnet

TheRookAlgo ICT DRThe Rook Algo is a powerful indicator that is useful to identify the current state of the market, it give information about the current dealing range created after price takes both sides of the market as ICT teaches. The indicator give buy and sell signals depending of the market sentiment, it works in all timeframes can be used only in one but the real benefits comes when it is used with a Higher timeframe reference.
How it works?
The Algo analyze the current and previous market structure to identify current ranges and dealing ranges, it give information about the market with the table located in the corners. The table will tell if the market is expanding higher or lower, retracing into the range, consolidating, if a move failed. Will tell if we hit discount or premium, if we might be in a turtle soup enviormment and finally If the range is small or big compared to the previous one. All this is helpful to quickly identify current market context and direction. Is important to keep in mind that this works better in trending markets must be avoided during consolidations. The algo will tell information about current range, current dealing range and previous dealing range. Is ideal to take entries when the 3 are in sync.
Once the indicator detect current market state it will plot an arrow right after the current candle close telling the possible
Market sentiment and probable direction. This signals can be tricked during consolidations. But when we are trending they work very good.
The light green arrow is plotted when price hits discount and is in a bullish enviormment and price makes a close above previous candle high. The dark green arrow is plotted when we are bullish and price makes an impulse and break the range.
The light red arrow is plotted when price hits a premium in a bearish enviormment and price makes a close below previous candle low. The dark red arrow is plotted when we are bearish and price makes and impulse breaking the range.
The white arrows are plotted when price makes a break out or change of current market state and this is counter to the current market enviormment meaning if we are bullish and we get a down impulse white arrow will be plotted. Then same if we are bearish and price makes an up impulse will plot a white arrow. This ones are usually traps but can also be a real breakout. It depends of the market context in the higher timeframe.
The Algo have the option to plot current ranges that are the lines with the cross, this lines change color depending of the market sentiment and market structure. Light Green for bullish expansion and light red for bearish expansion. Dark colors appears when the range is closed. The equilibrium price is plotted in gray, it change to black when it detect contraction and to white when detect expansion of the ranges.
ICT dealing ranges are plotted in white lines with the equilibrium point in yellow. This lines only appear while price is respecting the range and is consolidating inside and price is not expanding.
The indicator also draws some label lines to easily identify the current range and dealing range and if you want the previous dealing range. This line also tell you when price make a Break of structure and where is the ideal change or character for the timeframe we are looking for.
Lastly the The Rook have the option to enable colors in the bars this is helpful to quickly identify the market state, when price is aliged with the current market sentiment light green or red colors tell us that price is in a premium or discount. Dark and gray colors means price is already in an impulse. And finally when there is an absent of color means price is change current state similar to the white arrows. By default this colors are disable. You can edit in settings
How to use it?
After understanding how the rook communicates we can use it to follow the market direction, the best way to use it is waiting for the Range and dealing range a to be aligned for increasing probabilities we can wait for the previous dealing range too, one that’s in play we just wait for a premium or discount light green or light red signal to enter targeting first the break of the range and then holding for profits while is expanding until we get an opposite signal. This give us the possibility to hold for really big runs. See the picture below. This can be used in any timeframe so depending of the timeframe those ranges might be different but the key is to be align also with a higher timeframe direction.

FVG (ICT) with Swing LevelsThis indicator, called "Fair Value Gaps (ICT) with Swing Levels", overlays on the main chart and does the following:
Initial Setup:
It defines user-adjustable parameters:
lookback: Lookback period to keep FVGs visible.
swingPeriod: Period for calculating swing highs and lows.
bullColor and bearColor: Colors for bullish and bearish FVGs.
Fair Value Gaps (FVGs) Detection:
Uses a function to identify FVGs by comparing candle high and low prices.
A bullish FVG forms when the low of two candles ago is higher than the high of the current candle.
A bearish FVG forms when the high of two candles ago is lower than the low of the current candle.
Swing Levels Calculation:
Calculates swing highs and lows over the specified period.
These swing levels define the current market range.
Current Range Verification:
Implements a function to check if an FVG is within the range defined by swing levels.
This ensures only the most relevant FVGs for the current market situation are displayed.
FVG Drawing:
When it detects an FVG (bullish or bearish) within the current range, it draws a box on the chart.
Boxes extend from the bar where the FVG formed to the current bar.
Bullish FVGs are drawn in green and bearish in red (colors are customizable).
Old FVGs Management:
On each new bar, the indicator checks all existing FVG boxes.
It removes boxes that are outside the specified lookback period.
It also removes boxes that are no longer within the current range of swing levels.
Swing Levels Visualization:
Draws lines on the chart to show swing highs (in blue) and swing lows (in purple).
These lines help visualize the current market range.
Continuous Update:
The indicator updates on each new candle, constantly refreshing FVGs and swing levels.
In summary, this indicator identifies and visualizes Fair Value Gaps according to the ICT methodology, filtering them based on higher timeframe swing levels. This helps traders focus on the most significant FVGs within the current market context, reducing visual noise and potentially improving trading decision-making.

FVG & IFVG ICT [TradingFinder] Inversion Fair Value Gap Signal🔵 Introduction
🟣 Fair Value Gap (FVG)
To spot a Fair Value Gap (FVG) on a chart, you need to perform a detailed candle-by-candle analysis.
Here’s the process :
Focus on Candles with Large Bodies : Identify a candle with a substantial body and examine it alongside the preceding candle.
Check Surrounding Candles : The candles immediately before and after the central candle should have long shadows.
Ensure No Overlap : The bodies of the candles before and after the central candle should not overlap with the body of the central candle.
Determine the FVG Range : The gap between the shadows of the first and third candles forms the FVG range.
🟣 ICT Inversion Fair Value Gap (IFVG)
An ICT Inversion Fair Value Gap, also known as a reverse FVG, is a failed fair value gap where the price does not respect the gap. An IFVG forms when a fair value gap fails to hold the price and the price moves beyond it, breaking the fair value gap.
This marks the initial shift in price momentum. Typically, when the price moves in one direction, it respects the fair value gaps and continues its trend.
However, if a fair value gap is violated, it acts as an inversion fair value gap, indicating the first change in price momentum, potentially leading to a short-term reversal or a subsequent change in direction.
🟣 Bullish Inversion Fair Value Gap (Bullish IFVG)
🟣 Bearish Inversion Fair Value Gap (Bearish IFVG)
🔵 How to Use
🟣 Identify an Inversion Fair Value Gap
To identify an IFVG, you first need to recognize a fair value gap. Just as fair value gaps come in two types, inversion fair value gaps also fall into two categories:
🟣 Bullish Inversion Fair Value Gap
A bullish IFVG is essentially a bearish fair value gap that is invalidated by the price closing above it.
Here’s how to identify it :
Identify a bearish fair value gap.
When the price closes above this bearish fair value gap, it transforms into a bullish inversion fair value gap.
This gap acts as support for the price and drives it upwards, indicating a reduction in sellers' strength and an initial shift in momentum towards buyers.
🟣 Bearish Inversion Fair Value Gap
A bearish IFVG is primarily a bullish fair value gap that fails to hold the price, with the price closing below it.
Here’s how to identify it :
Identify a bullish fair value gap.
When the price closes below this gap, it becomes a bearish inversion fair value gap.
This gap acts as resistance for the price, pushing it downwards. A bearish inversion fair value gap signifies a decrease in buyers' momentum and an increase in sellers' strength.
🔵 Setting
🟣 Global Setting
Show All FVG : If it is turned off, only the last FVG will be displayed.
S how All Inversion FVG : If it is turned off, only the last FVG will be displayed.
FVG and IFVG Validity Period (Bar) : You can specify the maximum time the FVG and the IFVG remains valid based on the number of candles from the origin.
Switching Colors Theme Mode : Three modes "Off", "Light" and "Dark" are included in this parameter. "Light" mode is for color adjustment for use in "Light Mode".
"Dark" mode is for color adjustment for use in "Dark Mode" and "Off" mode turns off the color adjustment function and the input color to the function is the same as the output color.
🟣 Logic Setting
FVG Filter
When utilizing FVG filtering, the number of identified FVG areas undergoes refinement based on a specified algorithm. This process helps to focus on higher quality signals and eliminate noise.
Here are the types of FVG filters available :
Very Aggressive Filter : Introduces an additional condition to the initial criteria. For an upward FVG, the highest price of the last candle must exceed the highest price of the middle candle. Similarly, for a downward FVG, the lowest price of the last candle should be lower than the lowest price of the middle candle. This mode minimally filters out FVGs.
Aggressive Filter : Builds upon the Very Aggressive mode by considering the size of the middle candle. It ensures the middle candle is not too small, thereby eliminating more FVGs compared to the Very Aggressive mode.
Defensive Filter : In addition to the conditions of the Very Aggressive mode, the Defensive mode incorporates criteria regarding the size and structure of the middle candle. It requires the middle candle to have a substantial body, with specific polarity conditions for the second and third candles relative to the first candle's direction. This mode filters out a significant number of FVGs, focusing on higher-quality signals.
Very Defensive Filter : Further refines filtering by adding conditions that the first and third candles should not be small-bodied doji candles. This stringent mode eliminates the majority of FVGs, retaining only the highest quality signals.
Mitigation Level FVG and IFVG : Its inputs are one of "Proximal", "Distal" or "50 % OB" modes, which you can enter according to your needs. The "50 % OB" line is the middle line between distal and proximal.
🟣 Display Setting
Show Bullish FVG : Enables the display of demand-related boxes, which can be toggled on or off.
Show Bearish FVG : Enables the display of supply-related boxes along the path, which can also be toggled on or off.
Show Bullish IFVG : Enables the display of demand-related boxes, which can be toggled on or off.
Show Bearish IFVG : Enables the display of supply-related boxes along the path, which can also be toggled on or off.
🟣 Alert Setting
Alert FVG Mitigation : If you want to receive the alert about FVG's mitigation after setting the alerts, leave this tick on. Otherwise, turn it off.
Alert Inversion FVG Mitigation : If you want to receive the alert about Inversion FVG's mitigation after setting the alerts, leave this tick on. Otherwise, turn it off.
Message Frequency : This parameter, represented as a string, determines the frequency of announcements. Options include: 'All' (triggers the alert every time the function is called), 'Once Per Bar' (triggers the alert only on the first call within the bar), and 'Once Per Bar Close' (activates the alert only during the final script execution of the real-time bar upon closure). The default setting is 'Once per Bar'.
Show Alert time by Time Zone : The date, hour, and minute displayed in alert messages can be configured to reflect any chosen time zone. For instance, if you prefer London time, you should input 'UTC+1'. By default, this input is configured to the 'UTC' time zone.
Display More Info : The 'Display More Info' option provides details regarding the price range of the order blocks (Zone Price), along with the date, hour, and minute. If you prefer not to include this information in the alert message, you should set it to 'Off'.

Simple ICT Order Blocks and Fair Value Gaps by Gowtham KannakajeThis scripts identifies ICT Order Block and ICT Fair Value Gaps
Fair Value Gap:
- Fair Value Gap toggle is off by default
- Users can choose to color the bars having Fair Value Gaps or can select to define the Fair Value Gap using boxes.
- Bar color and box colors can be customized
Order Blocks:
- Order Block box and candle color toggle is on by default
- Users can choose to color the Order Block candles or can select to define the Order Blocks using boxes.
- Bar color and box colors can be customized for bullish and bearish Order Block separately
Note:
- Order Blocks are considered valid only if the candle forming the Fair Value Gap closes away from the Order Block.
- Since Trading View limits the number of boxes to 500, it is advised to use the Color Candle option to identify the Order Blocks or Fair Value Gaps which are very old.
New concept Definitions:
Naked OB : An order block whose immediate next candle forms a Fair Value Gap. Here, the Order Block high or low contributes to the formation of Fair Value Gap.
Covered OB : An order block whose immediate next candle doesn't form a Fair Value Gap. Here, the Order Block high or low doesn't contribute to the formation of Fair Value Gap. Instead it will have other candles in between the Order Block and Fair Value Gap.
Disclaimer: The usage of this indicator might or might not contribute to your profits and losses and the author is not responsible for the same.
Happy Trading.

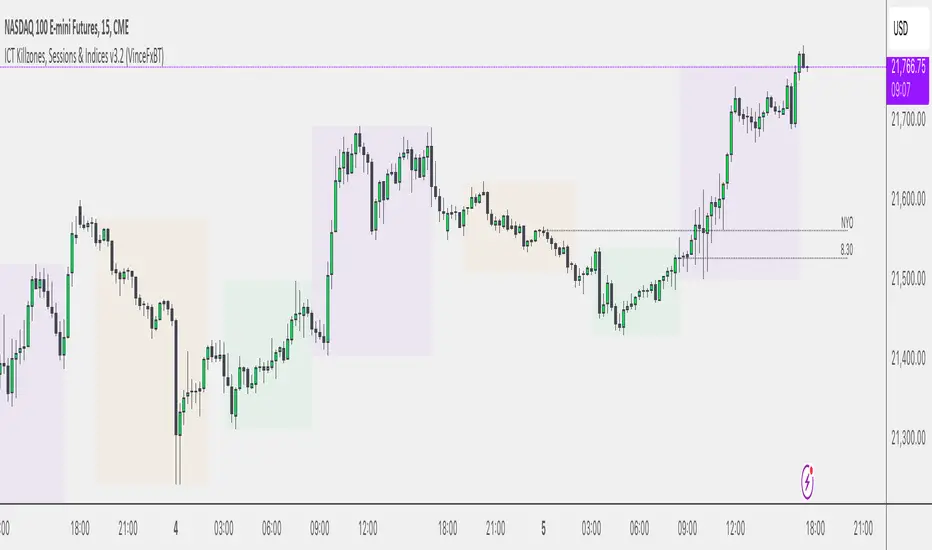
Sessions & ICT Killzones (0xCryptoVince)Sessions and ICT Killzones
All in one session and killzone script for FX or Crypto markets. It includes London, New York and Asia Sessions and Killzones.
Features
Uses UTC timezone so no timezone correction needed
Includes London, New York and Asia sessions
Includes ICT killzones
Optionally include weekends for session or killzone separately
Customize line style, width and color
Customize colors for sessions and killzones
Session highs/lows displayed on chart as a line or a box
Killzones displayed on top or bottom
SMT (ICT Concepts)Overview
Smart Money Technique (SMT) Divergence is a price action analysis method derived from Inner Circle Trader (ICT) methodology. This indicator automatically detects SMT divergences by comparing price movements across correlated financial instruments, identifying moments when assets that typically move together begin to diverge - a phenomenon often associated with potential price reversals.
An SMT divergence occurs when one instrument makes a new swing high or low while a correlated instrument fails to confirm that move. This failure to confirm suggests that the instrument may be positioning for a reversal, as the divergence indicates a lack of conviction in the current price direction across related markets.
Theoretical Foundation
What is SMT Divergence?
In correlated markets, instruments tend to move in tandem. For example, the E-mini S&P 500 (ES) and E-mini Nasdaq 100 (NQ) futures typically make swing highs and lows together due to their shared exposure to U.S. equity markets. When this correlation breaks down at key swing points, it creates an SMT divergence.
Bullish SMT Divergence:
The chart instrument creates a lower low compared to a previous swing low, while the correlated comparison instrument creates a higher low (or fails to make a lower low). This divergence at the lows suggests potential buying pressure and a possible bullish reversal.
Bearish SMT Divergence:
The chart instrument creates a higher high compared to a previous swing high, while the correlated comparison instrument creates a lower high (or fails to make a higher high). This divergence at the highs suggests potential selling pressure and a possible bearish reversal.
Why SMT Divergences Matter
SMT divergences are considered significant because they may indicate:
Accumulation or distribution occurring in one instrument but not the other
Relative strength or weakness between correlated assets
Potential exhaustion of the current trend
Early warning signs before major reversals
Indicator Features
Multi-Timeframe SMT Detection
This indicator provides simultaneous SMT detection on two timeframes:
Current Timeframe (CTF) Detection:
The indicator scans for SMT divergences on the chart's active timeframe using multiple pivot lookback periods (3, 5, 8, 13, 21, and 34 bars). This multi-period approach ensures detection of both short-term and intermediate swing points, reducing the likelihood of missing valid divergences while filtering out noise.
Higher Timeframe (HTF) Detection:
Simultaneously, the indicator monitors a higher timeframe for SMT divergences using pivot periods of 3, 5, 8, 13, and 21 HTF candles. Higher timeframe signals generally carry more significance as they represent larger market structure.
Automatic Timeframe Pairing:
When enabled, the indicator automatically selects an appropriate higher timeframe based on your chart's current timeframe:
Sub-1 minute charts pair with 5-minute
1-2 minute charts pair with 15-minute
3-4 minute charts pair with 30-minute
5 minute charts pair with 1-hour
6-9 minute charts pair with 1-hour
15 minute charts pair with 4-hour
16-59 minute charts pair with Daily
1-4 hour charts pair with Weekly
Daily charts pair with Monthly
Combined Signal Detection:
When an SMT divergence is detected on both the current timeframe and higher timeframe at the same price pivots, the indicator combines these into a single enhanced signal. Combined signals display both timeframes in the label and use the higher timeframe styling to emphasize their increased significance.
Automatic Symbol Correlation
The indicator includes comprehensive automatic symbol selection based on the instrument you are viewing. When Auto SMT is enabled, the indicator intelligently selects correlated comparison symbols.
Index Futures Correlations:
E-mini Contracts:
NQ (Nasdaq 100) compares with ES (S&P 500) and YM (Dow Jones)
ES (S&P 500) compares with NQ (Nasdaq 100) and YM (Dow Jones)
YM (Dow Jones) compares with NQ (Nasdaq 100) and ES (S&P 500)
RTY (Russell 2000) compares with ES (S&P 500) and NQ (Nasdaq 100)
Micro Contracts:
MNQ (Micro Nasdaq) compares with MES (Micro S&P) and MYM (Micro Dow)
MES (Micro S&P) compares with MNQ (Micro Nasdaq) and MYM (Micro Dow)
MYM (Micro Dow) compares with MNQ (Micro Nasdaq) and MES (Micro S&P)
M2K (Micro Russell) compares with MES (Micro S&P) and MNQ (Micro Nasdaq)
Metals Futures Correlations:
Standard Contracts:
GC (Gold) compares with SI (Silver) and PL (Platinum)
SI (Silver) compares with GC (Gold) and PL (Platinum)
PL (Platinum) compares with GC (Gold) and SI (Silver)
Micro Contracts:
MGC (Micro Gold) compares with SIL (Micro Silver) and PL (Platinum)
SIL (Micro Silver) compares with MGC (Micro Gold) and PL (Platinum)
Energy Futures Correlations:
CL (Crude Oil) compares with RB (RBOB Gasoline) and NG (Natural Gas)
RB (RBOB Gasoline) compares with CL (Crude Oil) and NG (Natural Gas)
NG (Natural Gas) compares with CL (Crude Oil) and RB (RBOB Gasoline)
MCL (Micro Crude) compares with RB (RBOB Gasoline) and NG (Natural Gas)
Major ETF Correlations:
SPY (S&P 500 ETF) compares with QQQ, DIA, and IWM
QQQ (Nasdaq 100 ETF) compares with SPY, DIA, and IWM
DIA (Dow Jones ETF) compares with SPY, QQQ, and IWM
IWM (Russell 2000 ETF) compares with SPY, QQQ, and DIA
Stock Sector Mapping:
When viewing individual stocks, the indicator automatically identifies the stock's sector and selects appropriate sector ETFs for comparison:
Technology Sector (AAPL, MSFT, GOOGL, NVDA, AMD, INTC, etc.):
Primary: QQQ (Nasdaq 100 ETF)
Secondary: XLK (Technology Select Sector SPDR)
Tertiary: SPY (S&P 500 ETF)
Financial Sector (JPM, BAC, GS, MS, WFC, etc.):
Primary: XLF (Financial Select Sector SPDR)
Secondary: KBE (SPDR S&P Bank ETF)
Tertiary: SPY (S&P 500 ETF)
Energy Sector (XOM, CVX, COP, SLB, etc.):
Primary: XLE (Energy Select Sector SPDR)
Secondary: USO (United States Oil Fund)
Tertiary: SPY (S&P 500 ETF)
Healthcare Sector (JNJ, UNH, PFE, MRK, LLY, etc.):
Primary: XLV (Health Care Select Sector SPDR)
Secondary: IBB (iShares Biotechnology ETF)
Tertiary: SPY (S&P 500 ETF)
Consumer Discretionary Sector (TSLA, HD, NKE, MCD, etc.):
Primary: XLY (Consumer Discretionary Select Sector SPDR)
Secondary: SPY (S&P 500 ETF)
Tertiary: QQQ (Nasdaq 100 ETF)
Consumer Staples Sector (PG, KO, PEP, WMT, COST, etc.):
Primary: XLP (Consumer Staples Select Sector SPDR)
Secondary: SPY (S&P 500 ETF)
Tertiary: QQQ (Nasdaq 100 ETF)
Industrial Sector (CAT, BA, HON, UPS, etc.):
Primary: XLI (Industrial Select Sector SPDR)
Secondary: SPY (S&P 500 ETF)
Tertiary: QQQ (Nasdaq 100 ETF)
Materials Sector (LIN, APD, SHW, FCX, NEM, etc.):
Primary: XLB (Materials Select Sector SPDR)
Secondary: GLD (SPDR Gold Shares)
Tertiary: SPY (S&P 500 ETF)
Utilities Sector (NEE, DUK, SO, etc.):
Primary: XLU (Utilities Select Sector SPDR)
Secondary: SPY (S&P 500 ETF)
Tertiary: QQQ (Nasdaq 100 ETF)
Real Estate Sector (AMT, PLD, CCI, etc.):
Primary: XLRE (Real Estate Select Sector SPDR)
Secondary: VNQ (Vanguard Real Estate ETF)
Tertiary: SPY (S&P 500 ETF)
Communication Services Sector (NFLX, DIS, CMCSA, VZ, T, etc.):
Primary: XLC (Communication Services Select Sector SPDR)
Secondary: SPY (S&P 500 ETF)
Tertiary: QQQ (Nasdaq 100 ETF)
Forex Correlations:
EURUSD compares with GBPUSD
GBPUSD compares with EURUSD
Cryptocurrency Correlations:
BTCUSD compares with ETHUSD
ETHUSD compares with BTCUSD
Three-Symbol Comparison
The indicator supports comparison against up to three symbols simultaneously. When multiple comparison symbols show divergence at the same pivot point, all diverging symbols are displayed in the label, providing stronger confluence. For example, if NQ shows divergence with both ES and YM at the same swing high, the label will display "ES1! + YM1!" indicating divergence confirmation from multiple correlated instruments.
Invalidation Logic
SMT divergences are not indefinitely valid. The indicator includes automatic invalidation logic based on price action following the divergence signal.
Invalidation Rules:
Bearish SMT: Invalidates when price trades above the high of the confirmation pivot (right side of the divergence)
Bullish SMT: Invalidates when price trades below the low of the confirmation pivot (right side of the divergence)
The invalidation level is set at the confirmation bar (the second pivot that completes the SMT pattern), not the extreme of both pivots. This approach aligns with the concept that once price exceeds the confirmation point, the divergence setup is no longer valid.
Invalidation Display Options:
Users can choose to show or hide invalidated SMT signals separately for current timeframe and higher timeframe divergences. When shown, invalidated signals can be displayed with different line styles and widths to visually distinguish them from active signals. Separate limits prevent excessive invalidated signals from cluttering the chart (maximum 15 invalidated signals per timeframe type).
Input Settings
General Settings
Enable SMT Detection:
Master toggle to enable or disable all SMT divergence detection. When disabled, no SMT signals will be calculated or displayed.
Direction:
Filter which divergence types to display:
Both: Display both bullish and bearish SMT divergences
Bullish: Display only bullish SMT divergences (divergence at lows)
Bearish: Display only bearish SMT divergences (divergence at highs)
Symbol Settings
Enable Auto SMT:
When enabled, the indicator automatically selects correlated comparison symbols based on the chart instrument using the correlation mappings described above. When disabled, manual symbol inputs are used.
Symbol 1 (with enable toggle):
First comparison symbol. Enabled by default. When Auto SMT is disabled, enter the desired symbol manually.
Symbol 2 (with enable toggle):
Second comparison symbol. Enabled by default. When Auto SMT is disabled, enter the desired symbol manually.
Symbol 3 (with enable toggle):
Third comparison symbol. Disabled by default. Enable for additional confirmation from a third correlated instrument.
Current Timeframe SMT Settings
Show Current TF SMTs:
Toggle visibility of SMT divergences detected on the chart's current timeframe.
Bullish Color:
Color for bullish SMT divergence lines and labels on the current timeframe.
Bearish Color:
Color for bearish SMT divergence lines and labels on the current timeframe.
Line Style:
Style for current timeframe SMT lines (solid, dashed, or dotted).
Line Width:
Width of current timeframe SMT lines (1-4 pixels).
Show Labels:
Toggle visibility of labels on current timeframe SMT divergences.
Label Style:
Normal: Displays full information including timeframe and diverging symbol names
+/-: Displays minimal "+" or "-" characters with full information available in hover tooltip
Label Size:
Size of current timeframe SMT labels (Tiny, Small, Normal, or Large).
Show Invalidated:
Toggle visibility of invalidated current timeframe SMT signals.
Invalidated Line Style:
Line style for invalidated current timeframe SMT signals.
Invalidated Line Width:
Line width for invalidated current timeframe SMT signals.
Higher Timeframe SMT Settings
Show Higher TF SMTs:
Toggle visibility of SMT divergences detected on the higher timeframe.
Auto Timeframe:
When enabled, automatically selects an appropriate higher timeframe based on the chart's current timeframe. When disabled, uses the manually specified timeframe.
Manual Timeframe:
When Auto Timeframe is disabled, specify the higher timeframe to scan for SMT divergences.
Bullish Color:
Color for bullish SMT divergence lines and labels on the higher timeframe.
Bearish Color:
Color for bearish SMT divergence lines and labels on the higher timeframe.
Line Style:
Style for higher timeframe SMT lines (solid, dashed, or dotted).
Line Width:
Width of higher timeframe SMT lines (1-4 pixels).
Show Labels:
Toggle visibility of labels on higher timeframe SMT divergences.
Label Style:
Normal: Displays full information including timeframe and diverging symbol names
+/-: Displays minimal "+" or "-" characters with full information available in hover tooltip
Label Size:
Size of higher timeframe SMT labels (Tiny, Small, Normal, or Large).
Show Invalidated:
Toggle visibility of invalidated higher timeframe SMT signals.
Invalidated Line Style:
Line style for invalidated higher timeframe SMT signals.
Invalidated Line Width:
Line width for invalidated higher timeframe SMT signals.
Visual Representation
Line Display
SMT divergences are displayed as lines connecting the two pivot points that form the divergence:
For bearish SMT: A line connects the previous swing high to the current (higher) swing high
For bullish SMT: A line connects the previous swing low to the current (lower) swing low
The line color indicates the divergence type (bullish or bearish) and whether it was detected on the current timeframe or higher timeframe.
Label Display
Labels are positioned at the midpoint of the SMT line and display:
The timeframe on which the divergence was detected
The symbol(s) that showed divergence with the chart instrument
When using the "+/-" label style, labels show only "+" for bullish or "-" for bearish divergences, with full information accessible via hover tooltip.
All labels use monospace font formatting for consistent visual appearance.
Combined Signals
When the same divergence is detected on both current and higher timeframes, the signals are combined into a single display using higher timeframe styling. The label shows both timeframes (e.g., "M2 + M15") and all diverging symbols, indicating strong multi-timeframe confluence.
Practical Application Guidelines
Signal Interpretation
SMT divergences should be interpreted within the broader market context. Consider the following when evaluating signals:
Market Structure: SMT divergences occurring at key structural levels (previous highs/lows, order blocks, fair value gaps) tend to be more significant.
Timeframe Confluence: Signals appearing on multiple timeframes simultaneously suggest stronger institutional involvement.
Symbol Confluence: Divergences confirmed by multiple comparison symbols indicate broader market disagreement with the current price direction.
Time of Day: SMT divergences during high-volume trading sessions may carry more weight than those during low-liquidity periods.
Limitations and Considerations
Correlation Variability: Correlations between instruments can strengthen or weaken over time. The automatic symbol selection is based on typical correlations but may not always reflect current market conditions.
Pivot Detection Lag: Pivots are only confirmed after subsequent price action, meaning SMT signals appear with some delay after the actual swing point forms.
False Signals: Not all SMT divergences result in reversals. Use additional confirmation methods and proper risk management.
Data Requirements: The indicator requires sufficient historical data and may not function properly on instruments with limited price history.
Technical Notes
The indicator uses multiple pivot detection periods to identify swing points across different scales
Higher timeframe candle tracking is performed on the lower timeframe chart for precise pivot bar indexing
A deduplication system prevents the same divergence from being detected multiple times across different pivot periods
Array-based storage manages active and invalidated SMT signals with automatic cleanup to prevent memory issues
Maximum label and line counts are set to 500 each to accommodate extended analysis periods
Disclaimer
This indicator is provided for educational and informational purposes only. It is designed to assist traders in identifying potential SMT divergences based on historical price data and should not be considered as financial advice or a recommendation to buy or sell any financial instrument.
Trading financial markets involves substantial risk of loss and is not suitable for all investors. Past performance of any trading methodology, including concepts discussed in this indicator, does not guarantee future results. Users should conduct their own research and analysis before making any trading decisions.
The automatic symbol correlations and sector mappings are based on general market relationships and may not accurately reflect current or future correlations. Users are encouraged to verify correlations independently and adjust comparison symbols as needed.
Always use appropriate risk management techniques, including but not limited to position sizing and stop-loss orders. Never risk more capital than you can afford to lose.

ICT Daily Wick QuadrantsICT DAILY WICK QUADRANTS
Inspired by ICT's teachings, this indicator allows you to view previous daily wicks (adjustable ratio to body threshold) on any timeframe chart, both at their origin and conveniently ahead of price.
Color coding, day of week labels, and directional arrows allow you to easily identify and visualize any notable daily candles wick in order to anticipate potential price behavior at that qaudrant. Keeping your chart clean and free of clutter is important.
Thanks to a great idea by @fadizeidan aka (fadi), the lines will remain muted to an adjustable degree according to a user adjusted distance of price. This will only highlight levels nearby and relevant to current price action, while fading out more distant levels. Of course this is optional and adjustable.
Each daily candle wick label contains options to show the percentage (0%,25%,50%,75%,100%), the direction of the candle (arrow up for up close, arrow down for down close), the open, close, lower quadrant, mid, upper quadrant, and high/low of that candle, and the day of the week. There is also a set of labels with the same option

NX - ICT PD ArraysThis Pine Script indicator identifies and visualizes Fair Value Gaps (FVGs) and Order Blocks (OBs) based on refined price action logic.
FVGs are highlighted when price leaves an imbalance between candles, while Order Blocks are detected using ICT methodology—marking the last opposing candle before a displacement move.
The script dynamically tracks and updates these zones, halting box extension once price interacts with them. Customizable colors and lookback settings allow traders to tailor the display to their strategy.

NX - ICT LiquidityThis indicator identifies liquidity zones based on ICT concepts, highlighting swing highs (BSL) and swing lows (SSL) with dynamic detection and mitigation logic. It also plots key institutional levels from the previous day, week, and month—including High, Low, Open, and Close—customizable by timeframe.
Designed for precision and clarity, it helps traders visualize potential sweep setups and reaction points with minimal chart clutter.

NX - ICT Kill ZonesThis indicator highlights the three main ICT Kill Zones — Asian, London, and New York — directly on your chart using New York time (UTC‑4 with automatic DST adjustment).
Each zone is color‑coded for quick visual reference and only appears on intraday timeframes of 1 hour or less. The tool helps traders quickly identify high‑probability trading windows aligned with institutional market activity.

ICT OTE Market MakerICT OTE Market Maker
Implementing ICT and automatically identifies OTE zones to minimize drawdowns.
ICT Time CaptureICT 8am High/Low + 9am Capture (NY Time) — Fixed 1H
This indicator marks the High and Low of the 8am candle on the 1-hour timeframe fixed to New York time (America/New_York timezone). It also draws a line for the 9am candle open and indicates if the 9am candle “captured” (broke above or below) the 8am High or Low.
Key Features:
Always uses 1-hour data fixed on New York timezone, regardless of the chart’s current timeframe.
Draws horizontal lines for the 8am High and Low, with configurable colors, styles (solid/dashed), thickness, and extension length.
Draws a horizontal line for the 9am open price with customizable style.
Shows labels with price values explaining the lines.
Shows a capture label when the 9am candle breaks above the 8am high or below the 8am low.
Allows full customization of label text colors, line colors, line styles, thickness, and label distances from line start.
How to use:
Use this indicator to monitor key ICT timeframes (8am and 9am NY time) for intraday price action clues.
The capture labels help identify when price breaks key levels from the 8am candle during the 9am candle.
The configurable style options let you customize the indicator to your chart style.

ICT IRL & ERL ZonesICT IRL & ERL Zones
This indicator visualizes Internal Range Liquidity (IRL) and External Range Liquidity (ERL) levels, based on ICT (Inner Circle Trader) concepts. It's designed to help traders identify key liquidity zones that often act as magnet levels or reversal points in price action.
🔍 How It Works
Lookback Range: The script analyzes the highest high and lowest low over a user-defined number of candles (default: 50).
IRL (Internal Range Liquidity):
Plots the highest high and lowest low within the lookback period.
Represented as orange lines and a shaded zone.
ERL (External Range Liquidity):
Extends the IRL boundaries by a small buffer (50 ticks above/below).
Visualizes zones where price may reach for liquidity beyond the current range.
Plotted as a green (high) and red (low) line.
⚙️ Inputs
Lookback Range: Number of candles to calculate the range (min 5).
Show IRL: Toggle visibility for Internal Range Liquidity zone.
Show ERL: Toggle visibility for External Range Liquidity buffer zone.
📊 Visual Elements
IRL High/Low: Orange lines with fill to mark the main liquidity range.
ERL High/Low: Green and red lines indicating potential liquidity sweep zones.
Zone Fill: Light orange shading to visually emphasize the IRL area.
📈 Use Case
Use this tool to:
Identify areas where price might consolidate or reverse.
Highlight likely zones of liquidity grabs before trend continuations or shifts.
Enhance entry/exit decisions based on smart money concepts.

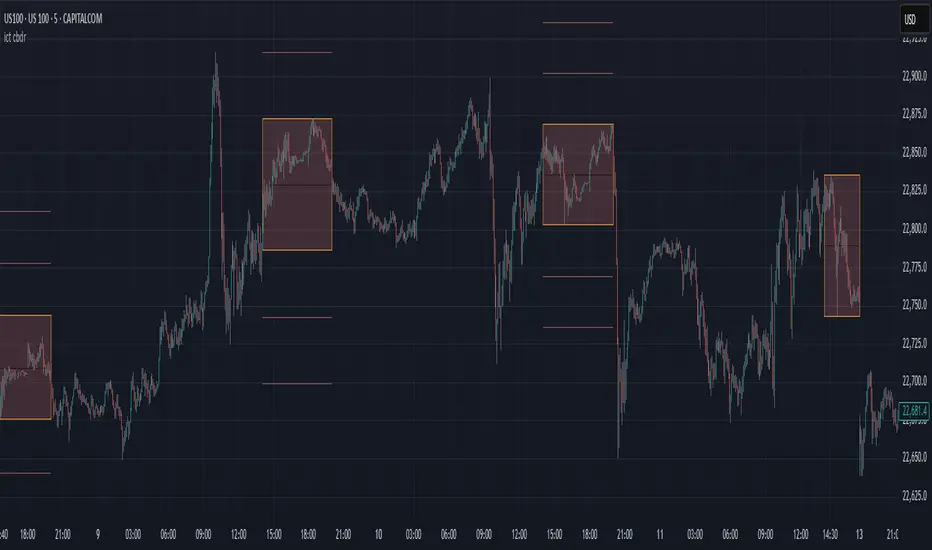
ict cbdr# ICT CBDR - Central Bank Dealers Range
This indicator identifies and displays the Central Bank Dealers Range (CBDR), a concept from Inner Circle Trader (ICT) methodology. The CBDR represents the consolidation period between 2:00 PM and 8:00 PM New York time, during which major financial institutions establish their positions.
## Features
- **Customizable Time Range:** Default setting is the standard 2:00 PM - 8:00 PM NY time, but can be adjusted to any session
- **Timezone Selection:** Choose your preferred timezone while maintaining accurate CBDR tracking
- **Visual Range Box:** Clearly displays the high and low range established during the selected session
- **Equator (EQ) Line:** Shows the 50% mid-point of the range for potential support/resistance
- **Projection Lines:** Automatically projects extensions of the range for potential targets
- **Adjustable Multiplier:** Option for 0.5× or 1× range projections
- **Range Type Selection:** Use price wicks or bodies to establish the range
## How to Use This Indicator
The CBDR forms a consolidation zone that often precedes significant price movements. After this range is established, markets tend to move away from this area with directional bias. Trading strategies commonly involve:
1. **Breakout Trading:** Enter when price breaks above/below the CBDR
2. **Range Trading:** Fade moves from the edges of the range back to the EQ line
3. **EQ Line Support/Resistance:** Use the mid-range as a pivot point
4. **Extension Targets:** Utilize the projection lines as potential take-profit levels
## Settings
- **Show CBDR:** Toggle the visibility of the range box
- **Range Type:** Select whether to use candle wicks or bodies for range calculation
- **Timezone:** Choose your preferred timezone (default is America/New York)
- **Session Time:** Adjust the session time in 24-hour format (default is 1400-2000)
- **EQ Line:** Toggle and customize the equator line
- **Projections:** Toggle and adjust the number and appearance of projection lines
- **Use 0.5 Deviation:** When enabled, uses half-sized projections
- **Hide Above __ Minutes:** Controls on which timeframes the indicator is displayed
## Notes
- The traditional CBDR is specifically the 2:00 PM - 8:00 PM NY time range
- This indicator is most effective on lower timeframes (1-15 minute charts)
- Remember to combine this tool with proper risk management and additional confirmation
- Works best on forex and highly liquid markets
## Disclaimer
This indicator is for informational and educational purposes only. Past performance is not indicative of future results. Always conduct your own analysis and use proper risk management.