PO3-Goldbach Fractal levels [promuckaj]This script is developed on time & price, algorithmic market theory that is well explained in the book "Demystifying ICT" by Hopiplaka.
What is fractals Goldbach levels and why this indicator is different then the other one based on GB levels to.
Well, the whole idea behind this script was born long time a go, when I write the first, well known, indicator for GB levels. This script allow you to set one master/main PO3 GB number, usually the higher one, and then decide what fractal GB levels you want there within 12 partitions of main(higher one) PO3 dealing range.
That means that you can deal with every single partition level from main one, RB, OB, FV, LV, BR and MB, and look them through prism of GB levels reserved for each of them.
Indicator contain all the options to deal with lines, labels, colors etc, including options for non-goldbach and CE levels. All of them could be modify separately for main and fractal levels.
Here is one example, lets set main PO3 GB number for NQ to be 2187.
We can see that we are at the moment in discount MB partition, so now let’s do the magic and activate some of fractals there, for example for MB and BR in discount zone and zoom in the chart.
I hope it is more then clear how this could be used in your analysis and trading plan.
在腳本中搜尋"ict"

FVG & IFVG Box Detector
The "FVG & IFVG Box Detector" is a custom Pine Script v6 indicator for TradingView that identifies and highlights Fair Value Gaps (FVGs) and their subsequent mitigation as Imbalance Fair Value Gaps (IFVGs) on a price chart. Tailored for use on a 5-minute timeframe (though it must be manually set by the user due to script limitations), this indicator provides a visual representation of market imbalances using colored boxes, which automatically disappear when the gaps are filled by price action. The script is designed to be clean and minimalistic, omitting text labels or annotations as per your preference.Key FeaturesFVG Detection:A Bullish FVG is detected when the low of the current candle is higher than the high of the candle two bars ago, indicating a potential upward imbalance, visualized with a green-bordered box filled with a semi-transparent green background.
A Bearish FVG is detected when the high of the current candle is lower than the low of the candle two bars ago, indicating a potential downward imbalance, visualized with a red-bordered box filled with a semi-transparent red background.
A minimum gap size filter (default 0%) can be adjusted to exclude small gaps, ensuring only significant imbalances are highlighted.
IFVG Transition:When a Bearish FVG is filled (price closes below its lower boundary), the red box disappears, and a blue-bordered box with a semi-transparent blue background briefly appears to mark the Bullish IFVG, indicating the zone may now act as support. This box then vanishes.
When a Bullish FVG is filled (price closes above its upper boundary), the green box disappears, and an orange-bordered box with a semi-transparent orange background briefly appears to mark the Bearish IFVG, indicating the zone may now act as resistance. This box then vanishes.
The disappearance of boxes reflects the resolution of the imbalance, keeping the chart uncluttered.
Customization:Users can toggle the display of Bullish FVGs, Bearish FVGs, Bullish IFVGs, and Bearish IFVGs via input settings.
The extendBars parameter (default 50) controls how far to the right the boxes extend, allowing adjustment of their visibility duration.
Colors for Bullish FVG, Bearish FVG, Bullish IFVG, and Bearish IFVG can be customized using TradingView’s color picker, with defaults set to semi-transparent green, red, blue, and orange, respectively.
Performance:The script includes a cleanup mechanism to limit the number of active boxes to 50 per type, preventing performance issues by deleting the oldest boxes when the limit is exceeded.
It uses static variable assignments to ensure compatibility with Pine Script v6’s strict type requirements for drawing functions.
FunctionalityThe indicator scans each bar on the 5-minute chart to detect FVGs based on the defined conditions.
Upon detection, it creates a box extending from the starting bar (two bars ago) to the current bar plus the extendBars value, using the high and low prices to define the box’s vertical range.
When price action fills an FVG, the original box is deleted, and a brief IFVG box is created at the same price levels, which also disappears, signaling the imbalance has been neutralized.
No text or labels are displayed, ensuring a clean visual experience focused solely on the boxes.
Intended UseTraders: This tool is ideal for traders using FVG and IFVG concepts (common in Smart Money or ICT trading strategies) to identify potential support and resistance zones. The blue boxes (Bullish IFVGs) may indicate areas to buy or expect a bounce, while orange boxes (Bearish IFVGs) may indicate areas to sell or expect a pullback.
Chart Analysis: By observing when and where boxes appear and disappear, traders can track market structure shifts without cluttering the chart with annotations.
LimitationsThe script must be applied to a 5-minute chart manually, as the timeframe argument is not supported due to the use of drawing functions.
The brief appearance of IFVG boxes means historical levels must be tracked manually (e.g., via screenshots) or by adjusting the script to retain them if desired.
The minimum gap size filter might need tuning depending on the instrument (e.g., Gold) to capture relevant gaps.
Current Status (as of 08:53 AM EDT, October 23, 2025)The script is fully functional on your 5-minute chart, with the latest version (v5) resolving the timeframe error by removing the invalid argument. Boxes should now appear and disappear as intended, with green for Bullish FVGs, red for Bearish FVGs, blue for Bullish IFVGs, and orange for Bearish IFVGs.

Alerts Killzones + PD/WL/ML Levels (No Labels)This indicator automatically highlights the London and New York killzones and triggers alerts at key price levels — without adding any labels or text clutter to the chart.
Features:
Highlights London (10:00–13:00) and New York (15:00–17:00) sessions (GMT+3, Romania).
Draws and updates key levels automatically:
PDH / PDL – Previous Day High & Low
WH / WL – Previous Week High & Low
MH / ML – Previous Month High & Low
Alerts when price touches any of these levels.
Alerts at session opens and closes for both London and New York.
Clean interface – no labels or extra markers on chart.
Ideal for:
Traders who follow ICT concepts, session-based setups, or liquidity sweeps and want precise alerts without chart noise.

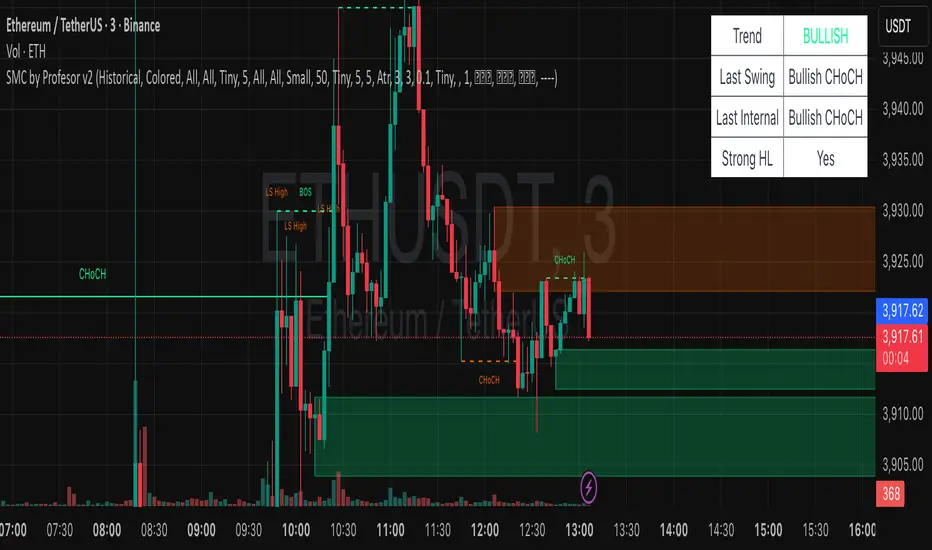
SMC by ProfesorSMC by Profesor
Discover market structure mastery with SMC by Profesor – your ultimate Smart Money Concepts toolkit for TradingView. Identify bullish/bearish BOS & CHoCH breaks, plot internal/swing order blocks, detect EQH/EQL levels, highlight FVGs, and zone premium/discount areas. Visualize swing points, PDH/PDL lines, and trend-colored candles. Receive instant alerts for breakouts, gaps, and more. Perfect for ICT traders seeking precision in any timeframe. Historical or real-time mode – elevate your edge today!
SMC pro trend
The PSK FX Structure Indicator (also known as SMC pro trend) is a complete Smart Money Concepts (SMC) toolkit designed for professional structure traders.
It detects and visualizes key price structure elements such as BoS (Break of Structure), CHoCH (Change of Character), HH/HL/LH/LL, IDM zones, SCOB, sweeps, inside bars, and EMA confluence — all with precise non-repainting logic.
This indicator helps traders read price action like an institution — identifying liquidity shifts, order flow direction, and possible reversal or continuation zones.
⸻
⚙️ Core Features
🧭 Structure Detection
• Automatic detection of major structure points:
• HH – Higher High
• HL – Higher Low
• LH – Lower High
• LL – Lower Low
• Confirms BoS (Break of Structure) and CHoCH (Change of Character) events in both bullish and bearish markets.
• Marks each structure change with labels and connecting lines for clarity.
🔁 BoS / CHoCH Logic
• Solid line = BoS
• Dashed line = CHoCH
• Colored by direction:
• 🟩 Bullish = Green
• 🟥 Bearish = Red
• Option to show live BoS/CHoCH lines extending forward for real-time updates.
🧱 IDM (Internal Displacement Model) Zones
• Detects previous and live IDM zones (premium/discount zones).
• Highlights IDM candles that cause structural displacement.
• Labels each detected IDM level automatically.
⚡ Sweeps (Liquidity Grab Detection)
• Detects when price sweeps previous highs/lows.
• Marks these zones with dotted lines and optional “X” markers.
🧩 SCOB Pattern (Smart Candle Order Block)
• Detects and colors special SMC candle structures:
• Bullish SCOB → Aqua
• Bearish SCOB → Fuchsia
• Option to color all bars by trend direction or only highlight SCOB bars.
🧭 Internal Structure & Pivots
• Marks minor highs/lows (internal structure) for better IDM leg visualization.
• Helps identify early momentum shifts before major structure breaks.
🎯 1.618 Target Projection
• Projects 1.618 Fibonacci targets dynamically after BoS or CHoCH confirmation.
• Displays target price level with text label:
• Bullish → Green Target Line
• Bearish → Red Target Line
🧱 Inside Bar Zones
• Highlights inside bar formations (compression zones).
• Draws colored boxes between high/low of inside bar clusters.
• Marks the first and consecutive inside bars with custom bar colors.
📊 EMA Filter
• Includes a toggleable Exponential Moving Average (EMA) for confluence with trend direction.
• Customizable EMA length (default: 50).
🎨 Monochrome Mode
• Toggle between normal color mode and a clean monochrome theme for minimalistic charting setups.
⸻
🧠 How to Use
1. Identify Market Context:
Wait for a confirmed CHoCH to spot potential reversals or structure shifts.
2. Follow Order Flow:
Confirm trend direction via BoS lines and IDM zones.
3. Entry Planning:
Combine sweep detection, inside bar zones, and IDM levels for sniper entries.
4. Take Profit Zones:
Use the 1.618 target projection line to set high-probability TP levels.
5. Trend Filtering:
Use EMA direction to confirm whether to follow continuation or counter-trend setups.
⸻
🧩 Inputs & Settings
Category
Key Settings
Structure
Equal H/L toggle, HH/LL labeling, internal structure
BoS/CHoCH
Enable/disable labels, custom label size, bull/bear colors
IDM
Show previous/live IDM, label size, color options
Sweeps
Show sweep lines, X-markers, sweep line color
Bar Coloring / SCOB
Toggle bar coloring and SCOB pattern
Inside Bars
Highlight and box compression zones
1.618 Targets
Enable Fibonacci target projection
EMA
Toggle EMA and adjust length
Monochrome Mode
Apply single-color chart theme
⚠️ Notes
• This indicator is built for non-repainting structure confirmation.
• Use it on higher timeframes for swing structure or lower timeframes for IDM entry precision.
• Works best with clean price action charts (no cluttered oscillators or extra visuals).
⸻
💡 Recommended Use Cases
✅ SMC traders
✅ ICT/Order Block strategy users
✅ Liquidity and market structure traders
✅ Scalpers and swing traders using BoS/CHoCH logic
⸻
✍️ Author
Developed by PURNA SAMPATH KALUARACHCHI (PSK FX)
Smart Money Concepts researcher and price structure developer.
⸻

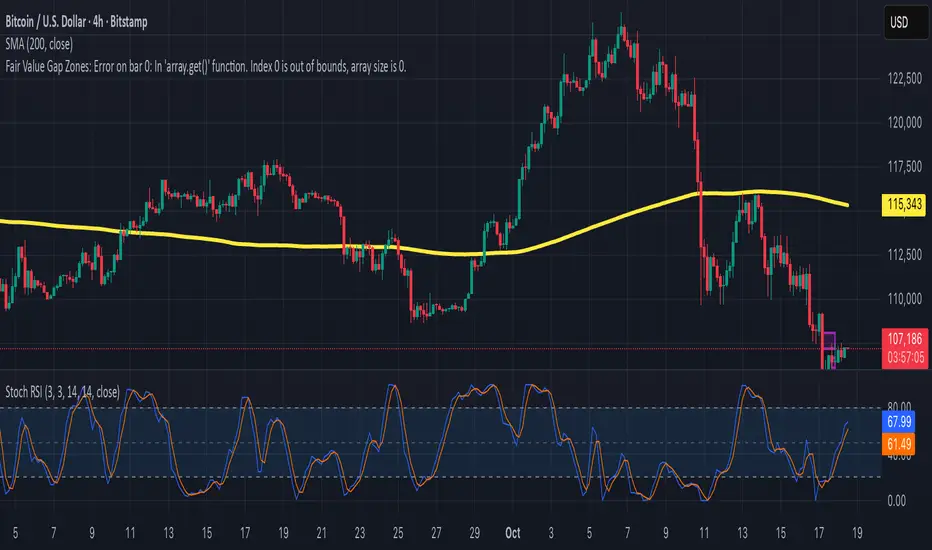
Fair Value Gap ZonesDescription
This script automatically detects and highlights Fair Value Gaps (FVGs) on any chart and timeframe.
It identifies bullish and bearish imbalance zones using candle-to-candle price displacement and shades them visually on the chart for easy reference.
Bullish FVGs are marked with dark green zones, showing areas where price may later return before continuing upward.
Bearish FVGs are shaded in light red, indicating potential retracement zones in downtrends.
All zones extend forward automatically, updating dynamically as new candles form.
Designed for traders who use Smart Money Concepts (SMC) or ICT-style analysis, this tool helps visualize market inefficiencies and potential reaction points with clear, minimal visuals.
Smart Structure Pro - Market Structure & Smart Money Concepts═══════════════════════════════════════════════════════════════════════════════
SMART STRUCTURE PRO
═══════════════════════════════════════════════════════════════════════════════
A comprehensive market structure analysis tool that identifies institutional trading
patterns and smart money concepts for improved trade timing and decision-making.
═══════════════════════════════════════════════════════════════════════════════
📊 WHAT IT DOES
═══════════════════════════════════════════════════════════════════════════════
This indicator automatically detects and visualizes key market structure elements:
🔹 BOS (Break of Structure)
- Identifies trend continuation patterns
- Marks when price breaks above previous highs (bullish) or below previous lows (bearish)
- Confirms trend strength and momentum
🔹 CHoCH (Change of Character)
- Detects potential trend reversals
- Alerts when market structure shifts from bullish to bearish or vice versa
- Helps identify early reversal opportunities
🔹 Order Blocks
- Highlights institutional entry zones
- Identifies the last opposite candle before a structure break
- Shows areas where smart money likely entered positions
🔹 Fair Value Gaps (FVG)
- Detects price imbalances and inefficiencies
- Shows areas where price moved rapidly leaving gaps
- Often act as support/resistance when retested
🔹 Liquidity Zones
- Marks swing high and low levels
- Identifies areas where stop losses likely cluster
- Shows potential stop hunt and liquidity grab zones
═══════════════════════════════════════════════════════════════════════════════
🎯 HOW TO USE
═══════════════════════════════════════════════════════════════════════════════
BULLISH SETUP:
1. Wait for Bullish CHoCH (trend reversal signal) or BOS ↑ (continuation)
2. Look for price to pull back into an Order Block or Fair Value Gap
3. Enter long when price bounces from these zones
4. Place stop loss below the Order Block
5. Target the next liquidity zone or resistance level
BEARISH SETUP:
1. Wait for Bearish CHoCH (trend reversal signal) or BOS ↓ (continuation)
2. Look for price to retrace into an Order Block or Fair Value Gap
3. Enter short when price rejects from these zones
4. Place stop loss above the Order Block
5. Target the next liquidity zone or support level
DASHBOARD INTERPRETATION:
• Trend: Current market direction (Bullish/Bearish)
• Volume: Confirmation strength (High volume = stronger signals)
• Signal: Latest structure break detected
• Key High/Low: Critical levels for the current trend
• Position: Price location (Premium = expensive, Discount = cheap)
═══════════════════════════════════════════════════════════════════════════════
⚙️ SETTINGS GUIDE
═══════════════════════════════════════════════════════════════════════════════
STRUCTURE DETECTION:
• Pivot Length (Default: 10)
- Lower values = More signals but potentially weaker
- Higher values = Fewer signals but stronger/more reliable
- Recommended: 8-12 for intraday, 10-15 for higher timeframes
• Structure Line Extension
- Visual preference for how far lines extend
- Does not affect signal detection
SMART MONEY CONCEPTS:
• Order Block Extension: How long OB boxes remain visible
• FVG Extension: How long gap boxes remain visible
• Min FVG Size: Filter out small gaps (0 = show all)
- Set to 10-20% to reduce noise
- Set to 0 to see all gaps
VOLUME FILTER:
• Volume Confirmation (Recommended: ON)
- Filters weak signals without volume support
- Reduces false breakouts
• Volume Multiplier (Default: 1.5)
- Higher = Stricter filtering (fewer but stronger signals)
- Lower = More signals (but may include weak ones)
DISPLAY:
• Dashboard: Toggle information panel
• Trend Background: Subtle color tint showing current trend
• Dashboard Position: Choose corner placement
═══════════════════════════════════════════════════════════════════════════════
🔔 ALERTS
═══════════════════════════════════════════════════════════════════════════════
Available alert conditions:
✓ Bullish BOS - Uptrend continuation confirmed
✓ Bearish BOS - Downtrend continuation confirmed
✓ Bullish CHoCH - Reversal to uptrend detected
✓ Bearish CHoCH - Reversal to downtrend detected
✓ Structure Break - Any significant market structure change
To set up alerts:
1. Click the "⏰" alert icon
2. Select "Smart Structure Pro"
3. Choose your desired condition
4. Configure notification method
5. Click "Create"
═══════════════════════════════════════════════════════════════════════════════
⚠️ IMPORTANT DISCLOSURES
═══════════════════════════════════════════════════════════════════════════════
REPAINTING BEHAVIOR:
• Pivot points WILL repaint until confirmed (this is by design and unavoidable)
• Structure breaks (BOS/CHoCH) use CLOSED candles and do NOT repaint after confirmation
• Order Blocks and FVGs are drawn on confirmed signals and do NOT repaint
• All signals wait for candle close before triggering
BEST PRACTICES:
• Use on higher timeframes (15min+) for more reliable signals
• Combine with other analysis (support/resistance, volume profile, etc.)
• Wait for candle close confirmation before acting on signals
• Use proper risk management - this is not a standalone trading system
• Backtest on your preferred instrument and timeframe
PERFORMANCE:
• Limited to 100 boxes, 100 lines, 100 labels for optimal performance
• Older objects automatically removed as new ones appear
• Works on all markets (Forex, Crypto, Stocks, Indices, Commodities)
═══════════════════════════════════════════════════════════════════════════════
📚 CONCEPTS EXPLAINED
═══════════════════════════════════════════════════════════════════════════════
MARKET STRUCTURE:
Market structure refers to the pattern of price movements creating swing highs
and lows. Understanding structure helps identify trend direction and potential
reversal points.
SMART MONEY CONCEPTS:
These are trading techniques based on tracking institutional order flow and
understanding where large players (banks, funds, institutions) enter and exit
positions.
ORDER BLOCKS:
The last opposing candle before a strong directional move. Institutions often
leave unfilled orders in these zones, which can act as support/resistance when
price returns.
FAIR VALUE GAPS:
Areas where price moved so quickly that it left an imbalance. These gaps often
get "filled" as price returns to find equilibrium, creating trading opportunities.
═══════════════════════════════════════════════════════════════════════════════
🎓 EDUCATIONAL VALUE
═══════════════════════════════════════════════════════════════════════════════
This indicator helps traders:
✓ Understand market structure mechanics
✓ Identify institutional trading patterns
✓ Improve trade timing and entry precision
✓ Recognize trend continuation vs reversal
✓ Learn smart money concepts through visualization
═══════════════════════════════════════════════════════════════════════════════
📋 TECHNICAL DETAILS
═══════════════════════════════════════════════════════════════════════════════
• Version: 1.0.0
• Pine Script Version: 5
• Indicator Type: Overlay
• No Repainting: Structure breaks use confirmed candles
• Performance Optimized: Limited drawing objects
• Works On: All markets and timeframes
• Alerts: Yes, fully customizable
═══════════════════════════════════════════════════════════════════════════════
👤 AUTHOR
═══════════════════════════════════════════════════════════════════════════════
Created by: Zakaria Safri
Original Work: All code and concepts are original implementations
Based On: ICT (Inner Circle Trader) educational concepts
License: © 2024 Zakaria Safri - Personal Use Only
═══════════════════════════════════════════════════════════════════════════════
⚖️ DISCLAIMER
═══════════════════════════════════════════════════════════════════════════════
This indicator is for educational and informational purposes only. It does not
constitute financial advice. Trading involves substantial risk of loss. Past
performance does not guarantee future results. Always conduct your own research
and consult with a licensed financial advisor before making trading decisions.
The author is not responsible for any losses incurred from using this indicator.
═══════════════════════════════════════════════════════════════════════════════
If you find this indicator helpful, please:
👍 Like and favorite
⭐ Leave a review
📢 Share with other traders
💬 Comment with feedback or suggestions
Happy Trading! 📈

Momentum-Based Fair Value Gaps [BackQuant]Momentum-Based Fair Value Gaps
A precision tool that detects Fair Value Gaps and color-codes each zone by momentum, so you can quickly tell which imbalances matter, which are likely to fill, and which may power continuation.
What is a Fair Value Gap
A Fair Value Gap is a 3-candle price imbalance that forms when the middle candle expands fast enough that it leaves a void between candle 1 and candle 3.
Bullish FVG : low > high . This marks a bullish imbalance left beneath price.
Bearish FVG : high < low . This marks a bearish imbalance left above price.
These zones often act as magnets for mean reversion or as fuel for trend continuation when price respects the gap boundary and runs.
Why add momentum
Not all gaps are equal. This script measures momentum with RSI on your chosen source and paints each FVG with a momentum heatmap. Strong-momentum gaps are more likely to hold or propel continuation. Weak-momentum gaps are more likely to fill.
Core Features
Auto FVG Detection with size filters in percent of price.
Momentum Heatmap per gap using RSI with smoothing. Multiple palettes: Gradient, Discrete, Simple, and scientific schemes like Viridis, Plasma, Inferno, Magma, Cividis, Turbo, Jet, plus Red-Green and Blue-White-Red.
Bull and Bear Modes with independent toggles.
Extend Until Filled : keep drawing live to the right until price fully fills the gap.
Auto Remove Filled for a clean chart.
Optional Labels showing the smoothed RSI value stored at the gap’s birth.
RSI-based Filters : only accept bullish gaps when RSI is oversold and bearish gaps when RSI is overbought.
Performance Controls : cap how many FVGs to keep on chart.
Alerts : new bullish or bearish FVG, filled FVG, and extreme RSI FVGs.
How it works
Source for Momentum : choose Returns, Close, or Volume.
Returns computes percent change over a short lookback to focus on impulse quality.
RSI and Smoothing : RSI length and a small SMA smooth the signal to stabilize the color coding.
Gap Scan : each bar checks for a 3-candle bullish or bearish imbalance that also clears your minimum size filter in percent of price.
Heatmap Color : the gap is painted at creation with a color from your palette based on the smoothed RSI value, preserving the momentum signature that formed it.
Lifecycle : if Extend Unfilled is on, the zone projects forward until price fully trades through the far edge. If Auto Remove is on, a filled gap is deleted immediately.
How to use it
Scan for structure : turn on both bullish and bearish FVGs. Start with a moderate Min FVG Size percent to reduce noise. You will see stacked clusters in trends and scattered singletons in chop.
Read the colors : brighter or stronger palette values imply stronger momentum at gap formation. Weakly colored gaps are lower conviction.
Decide bias : bullish FVGs below price suggest demand footprints. Bearish FVGs above price suggest supply footprints. Use the heatmap and RSI value to rank importance.
Choose your playbook :
Mean reversion : target partial or full fills of opposing FVGs that were created on weak momentum or that sit against higher timeframe context.
Trend continuation : look for price to respect the near edge of a strong-momentum FVG, then break away in the direction of the original impulse.
Manage risk : in continuation ideas, invalidation often sits beyond the opposite edge of the active FVG. In reversion ideas, invalidation sits beyond the gap that should attract price.
Two trade playbooks
Continuation - Buy the hold of a bullish FVG
Context uptrend.
A bullish FVG prints with strong RSI color.
Price revisits the top of the gap, holds, and rotates up. Enter on hold or first higher low inside or just above the gap.
Invalidation: below the gap bottom. Targets: prior swing, measured move, or next LV area.
Reversion - Fade a weak bearish FVG toward fill
Context range or fading trend.
A bearish FVG prints with weak RSI color near a completed move.
Price fails to accelerate lower and rotates back into the gap.
Enter toward mid-gap with confirmation.
Invalidation: above gap top. Target: opposite edge for a full fill, or the gap midline for partials.
Key settings
Max FVG Display : memory cap to keep charts fast. Try 30 to 60 on intraday.
Min FVG Size % : sets a quality floor. Start near 0.20 to 0.50 on liquid markets.
RSI Length and Smooth : 14 and 3 are balanced. Increase length for higher timeframe stability.
RSI Source :
Returns : most sensitive to true momentum bursts
Close : traditional.
Volume : uses raw volume impulses to judge footprint strength.
Filter by RSI Extremes : tighten rules so only the most stretched gaps print as signals.
Heatmap Style and Palette : pick a palette with good contrast for your background. Gradient for continuous feel, Discrete for quick zoning, Simple for binary, Palette for scientific schemes.
Extend Unfilled - Auto Remove : choose live projection and cleanup behavior to match your workflow.
Reading the chart
Bullish zones sit beneath price. Respect and hold of the upper boundary suggests demand. Strong green or warm palette tones indicate impulse quality.
Bearish zones sit above price. Respect and hold of the lower boundary suggests supply. Strong red or cool palette tones indicate impulse quality.
Stacking : multiple same-direction gaps stacked in a trend create ladders. Ladders often act as stepping stones for continuation.
Overlapping : opposing gaps overlapping in a small region usually mark a battle zone. Expect chop until one side is absorbed.
Workflow tips
Map higher timeframe trend first. Use lower timeframe FVGs for entries aligned with the higher timeframe bias.
Increase Min FVG Size percent and RSI length for noisy symbols.
Use labels when learning to correlate the RSI numbers with your palette colors.
Combine with VWAP or moving averages for confluence at FVG edges.
If you see repeated fills and refills of the same zone, treat that area as fair value and avoid chasing.
Alerts included
New Bullish FVG
New Bearish FVG
Bullish FVG Filled
Bearish FVG Filled
Extreme Oversold FVG - bullish
Extreme Overbought FVG - bearish
Practical defaults
RSI Length 14, Smooth 3, Source Returns.
Min FVG Size 0.25 percent on liquid majors.
Heatmap Style Gradient, Palette Viridis or Turbo for contrast.
Extend Unfilled on, Auto Remove on for a clean live map.
Notes
This tool does not predict the future. It maps imbalances and momentum so you can frame trades with clearer context, cleaner invalidation, and better ranking of which gaps matter. Use it with risk control and in combination with your broader process.

Swing Points & Liquidity — ENHANCED PRO (Dark/Light Mode)This indicator — “Swing Points & Liquidity — ENHANCED PRO (Dark/Light Mode)” — automatically detects and visualizes swing highs, swing lows, and liquidity levels on the chart with rich analytics and customizable visuals.
🔍 Core Features
Smart Swing Detection: Identifies pivot highs/lows based on adjustable left/right bar settings.
Liquidity Visualization: Draws dynamic boxes and lines for liquidity pools and swing zones.
Volume & OI Integration: Filters and colors levels using volume and Open Interest Δ (change).
Strength Meter: Highlights strong liquidity levels with color gradients based on OI + volume intensity.
Automatic Trendlines: Connects swing points with selectable style and width.
Fibonacci Mapping: Automatically projects fib retracements (23.6%, 38.2%, 50%, 61.8%, 78.6%) from swing-to-swing for confluence zones.
Statistics Panel: Displays live metrics — total levels, active/filled count, success rate, and average strength.
Alerts System: Alerts for new swing formations and when price touches or breaks a level.
Multi-Timeframe Option: Analyze swing structures from higher timeframes on any chart.
Dual Theme Mode: Fully optimized for both Dark and Light interface preferences.
⚙️ Advanced Options
Adjustable lookback range
Hide or extend filled levels
Configurable volume and OI thresholds
Supports multiple OI data sources (Binance, BitMEX, Kraken)
Fully dynamic text, color, and label alignment settings
💡 Use Case
Perfect for Smart Money Concept (SMC) and ICT-style analysis, liquidity sweeps, and swing-based trading.
Traders can quickly visualize where liquidity sits, track how it gets filled, and monitor structure shifts in real time.

US30 Quarter Levels (125-point grid) by FxMogul🟦 US30 Quarter Levels — Trade the Index Like the Banks
Discover the Dow’s hidden rhythm.
This indicator reveals the institutional quarter levels that govern US30 — spaced every 125 points, e.g. 45125, 45250, 45375, 45500, 45625, 45750, 45875, 46000, and so on.
These are the liquidity magnets and reaction zones where smart money executes — now visualized directly on your chart.
💼 Why You Need It
See institutional precision: The Dow respects 125-point cycles — this tool exposes them.
Catch reversals before retail sees them: Every impulse and retracement begins at one of these zones.
Build confluence instantly: Perfectly aligns with your FVGs, OBs, and session highs/lows.
Trade like a professional: Turn chaos into structure, and randomness into rhythm.
⚙️ Key Features
Automatically plots US30 quarter levels (…125 / …250 / …375 / …500 / …625 / …750 / …875 / …000).
Color-coded hierarchy:
🟨 xx000 / xx500 → major institutional levels
⚪ xx250 / xx750 → medium-impact levels
⚫ xx125 / xx375 / xx625 / xx875 → intraday liquidity pockets
Customizable window size, label spacing, and line extensions.
Works across all timeframes — from 1-minute scalps to 4-hour macro swings.
Optimized for clean visualization with no clutter.
🎯 How to Use It
Identify liquidity sweeps: Smart money hunts stops at these quarter zones.
Align structure: Combine with session opens, order blocks, or FVGs.
Set precision entries & exits: Trade reaction-to-reaction with tight risk.
Plan daily bias: Watch how New York respects these 125-point increments.
🧭 Designed For
Scalpers, day traders, and swing traders who understand that US30 doesn’t move randomly — it moves rhythmically.
Perfect for traders using ICT, SMC, or liquidity-based frameworks.
⚡ Creator’s Note
“Every 125 points, the Dow breathes. Every 1000, it shifts direction.
Once you see the rhythm, you’ll never unsee it.”
— FxMogul

XAUUSD Quater Points by FxMogul🟡 XAUUSD Quarter Levels — The Smart Money Map for Gold Traders
Unlock the hidden grid behind Gold’s movement.
This indicator automatically maps the institutional quarter levels — every 25 points (…00 / …25 / …50 / …75) — showing you exactly where liquidity sits, smart money reacts, and price reverses.
💰 Why You’ll Love It
See what the banks see: Every major algorithm and institutional trader builds around psychological quarters — this script makes them visible.
Trade with precision: Entries, TPs, and liquidity sweeps align naturally with these levels.
Never chase price again: Know the next magnet before it happens — 3425, 3450, 3475, 3500... it’s all mapped.
Clean and customizable: No clutter, no noise — just structure and truth.
⚙️ Key Features
Automatic plotting of all 25-point grid levels around current price.
Color-coded hierarchy:
🟨 xx00 → high-impact institutional zones
⚪ xx50 → secondary liquidity magnets
⚫ xx25 / xx75 → intraday structure pivots
Adjustable window range, label spacing, and line extensions.
Works seamlessly across all timeframes.
🧭 How Traders Use It
Identify liquidity sweeps and reversal zones before they happen.
Align FVGs, order blocks, or fair value gaps with clean 25-point precision.
Build confluence with daily bias, CME gaps, or high-volume nodes.
Perfect for ICT, Smart Money, or Liquidity-Based traders.
🌍 Designed For
Scalpers. Swing Traders. Institutional thinkers.
Anyone who wants to trade Gold with the clarity of a market maker instead of the confusion of the crowd.
⚡ Creator’s Note
“Every 25 points, Gold breathes. Every 100, it shifts direction.
Learn to read its rhythm — and it will pay you for life.”
— FxMogul

MNQ Verse Indicator por Santino_tradingThe MNQ Verse Indicator is a comprehensive tool designed for intraday traders, especially for those who trade indices like (MNQ, MYM Y MES). Its purpose is to consolidate the most crucial price levels that define daily market structure into a single view, allowing traders to make more informed decisions based on price context.
This indicator automatically plots key liquidity levels, opening ranges, and higher timeframe pivots, offering a clear map of potential price reaction zones.
Key Indicator Components
ORG (Opening Range)
Calculates and plots the opening range defined between the 4:14 PM close of the previous day and the 9:30 AM open of the current day (NY time).
Includes key retracement levels within the range: 50% (Equilibrium or CE), 25%, and 75%, which often act as intraday support or resistance.
Opens (Day Open & Midnight)
Day Open: Marks the opening price of the new trading day at 6:00 PM (NY time).
NY Midnight Open: Pinpoints the opening price at midnight in New York, a significant institutional level for the session.
Sessions (Asia & London)
Delineates the highs and lows of the Asia and London sessions. These levels are crucial as they often become liquidity targets during the New York session.
Includes an option to show or hide a colored box that highlights the session's range for better visualization.
Previous Pivots (D/W/M)
Daily (PDH/PDL): Previous Day's High and Low.
Weekly (PWH/PWL): Previous Week's High and Low.
Monthly (PMH/PML): Previous Month's High and Low.
These higher timeframe pivots act as magnets for price and represent major support and resistance levels.
How to Use It
The levels plotted by the MNQ Verse Indicator can be used to:
Identify high-probability zones for support and resistance.
Frame the daily bias by observing how price reacts to these key levels.
Set take-profit targets at the liquidity levels from previous sessions.
Understand the overall market context without needing to switch between multiple charts or indicators.
Full Customization
The indicator is highly customizable. From the settings menu, you can:
Adjust the color, style (solid, dotted, dashed), and text size for each level independently.
Enable or disable each group of levels according to your strategy.
Show or hide the colored boxes for the Asia and London sessions.
DISCLAIMER: This tool is designed for technical analysis and educational purposes. It does not constitute financial advice or a recommendation to buy or sell. All trading decisions are the sole responsibility of the user. Trade with caution.

Khosro XAUUSD Strategy [TradingFinder] Trading Room Hunter Setup🔵 Introduction
The Trading Room Hunter (TRH) strategy is an analytical model based on the Smart Money Concept, developed by Khosro, an Iranian international trader based in Dubai. This approach is built upon a deep understanding of liquidity engineering, market structure shifts, and institutional order flow. Its core objective is to identify the so-called TRH Zone, the area where market liquidity gets trapped and institutional investors begin accumulating positions. Unlike traditional indicator-based methods, the TRH Zone focuses purely on price behavior and supply & demand dynamics to pinpoint the most precise reversal zones in the market.
Within Smart Money logic, every impulsive move in price results from the displacement or absorption of liquidity in a specific range. In the TRH model, the last pivot preceding the impulsive move (Origin Pivot) is defined as the Distal Line, and the Break Candle, which disrupts the market structure, forms the Proximal Line. The area between these two points defines the Trading Room Hunter Zone, a reaction zone where price, after creating a displacement or Break of Structure (BoS), often returns to fill an imbalance and provide a precision entry opportunity.
In essence, the TRH Zone is the region where smart money seeks re-entry after a liquidity sweep and a confirmed CHoCH or BoS. It frequently lies between supply/demand boundaries and fair value gaps (FVGs), forming one of the strongest decision-making frameworks within modern price-action theory. Due to its structural accuracy, the TRH setup can also function as a Set & Forget Setup, where the trader defines the zone, places a limit order, and lets the market naturally react, eliminating emotional decision-making and allowing for automated execution aligned with institutional logic.
🔵 How to Use
In the TRH strategy, entries are taken based on price returning to the area between the last impulsive pivot and the break candle. This range (the TRH Zone) represents the region where liquidity from the previous move remains concentrated. Before continuing its main direction, price often revisits this zone to fill imbalances or mitigate unfilled orders. The logic is simple: every explosive move originates from a point where large orders were executed, and TRH precisely highlights that institutional footprint.
🟣 Bullish Setup
When the market breaks a structural high after a strong bearish leg, liquidity shifts from sellers to buyers. The last bearish candle before the breakout marks the origin of the bullish move, and the zone between that candle and the break candle becomes the smart-money entry area. As price revisits this zone and signs of exhaustion in selling pressure appear, that’s the optimal point for a long position. Stop-loss is placed slightly below the origin pivot, and targets are set at the next supply zone or upper liquidity pool.
🟣 Bearish Setup
Conversely, when the market breaks a structural low after a sharp bullish leg, liquidity transitions from buyers to sellers. The last bullish candle before the drop is identified as the origin pivot, while the bearish break candle defines the lower boundary of the zone. The range between these two points forms the TRH Supply Zone, where late buyers are trapped and fresh institutional selling begins. As price retraces into this zone, short entries can be placed near the upper boundary, with stops above the pivot and targets toward the next liquidity pool below.
Because of its structural precision and clearly defined reaction behavior, TRH is one of the most effective Set & Forget setups in Smart Money trading. Simply mark the zone, place your order, and let the market do the rest.
🔵Setting
🟣 Spike Filter | Movement
Minimum Spike Bars : Defines the minimum number of consecutive candles required for a valid spike.
Movement Power : Enables or disables the momentum-based spike filter.
Movement Power Level : Sets the strength threshold; higher values filter out weaker moves and only detect strong spikes.
Pivot Period : Defines the lookback range used to detect swing highs and swing lows in market structure. A higher value smooths out smaller fluctuations and focuses on major pivots, while a lower value increases sensitivity and identifies minor turning points more frequently.
🟣 Position Management
Stop-Loss Threshold : Enables or disables the stop-loss threshold feature.
Stop-Loss Threshold Value : Defines the value of the stop-loss threshold for risk management.
Risk-Reward Ratio : Sets the desired risk-to-reward ratio (e.g., 1:1 or 1:2).
Wide Zone Filter : Filters out zones that exceed a defined width threshold, preventing detection of overly broad TRH areas.
🟣 Display Settings
Display Mode : Chooses between Setup (showing setups) or Signal (showing trade signals).
Show Entry Levels : Displays entry levels on the chart (buy/sell zones) when enabled
Only Display the Last Position : Displays only the most recent position on the chart when enabled.
Setup Width Drawing : Adjusts the visual width of the setup drawings on the chart for better visibility.
🔵 Conclusion
The TRH strategy is a precise structural model of liquidity flow that identifies zones where smart money is most likely to enter and where price is most likely to react. By combining the Origin Pivot and Break Candle, TRH isolates the key areas that drive institutional order flow. Without relying on indicators, it focuses purely on price structure, making it highly effective for both reactive entries and Set & Forget setups.
Ultimately, TRH creates a balance between market structure and liquidity flow, enabling traders to identify institutional decision zones on the chart with minimal risk and maximum clarity

Prophet Model [TakingProphets]The Prophet Model — context pipeline (HTF PDA → Sweep → CISD → EPE) with dynamic risk
Purpose
Informational overlay for organizing institutional context in real time. It does not issue buy/sell signals and is not financial advice. Use it to structure analysis and checklist-driven execution—not to automate decisions.
What it does (modules at a glance)
Projects HTF PD Arrays (FVGs) onto your current chart and maintains only the nearest active array.
Validates directional bias using Candle Range Theory (CRT) on the same HTF.
Tracks Liquidity Sweeps (BSL/SSL) on HTF-aware pivots.
Confirms Change in State of Delivery (CISD) via displacement after a sweep.
Optionally refines entries with EPE when a local (internal) imbalance forms right after CISD.
Derives dynamic TP/BE/SL from measured displacement and recent extremes (not fixed distances).
Keeps a rules checklist (PDA tap → CRT → Sweep → CISD) and a relationships table (common HTF↔LTF pairings) to enforce process.
How it works (integration, not a mashup)
The modules are sequenced on one HTF time base so each step gates the next:
HTF PD Arrays (context zone). The model identifies valid HTF FVGs, filters tiny/weekend gaps, removes arrays that are invalidated by clean trades-through, and persists only the nearest PDA. This focuses attention on the institutional zone most likely to matter now.
CRT (directional gating). CRT on the same HTF establishes a provisional bias. No entries are implied; CRT simply permits or forbids the following steps. If CRT disagrees with the PDA context, the checklist remains incomplete.
Liquidity Sweep (event). The model tracks HTF-aware BSL/SSL pivots. A sweep only “counts” if it occurs in relation to the active PDA (tap/engagement). This prevents generic swing-high/low tags from triggering downstream logic.
CISD (confirmation). After a qualified sweep, the tool looks for displacement through the sequence open (the open of the impulsive leg beginning at or immediately after the sweep). Crossing that threshold confirms CISD, which marks a structural delivery shift consistent with the CRT bias.
EPE (refinement, optional). Immediately following CISD, the model scans for a fresh internal imbalance. If found quickly, it promotes that price area as the Easiest Point of Entry (EPE) and relabels the reference. If not, the CISD level remains primary.
Dynamic risk levels. TP/BE/SL are derived from the measured displacement around the CISD leg (e.g., BE ≈ 1× leg, TP ≈ 2.25× stretch; SL aligned to nearby structural extremes rather than a fixed pip offset). Levels update with structure and can display prices.
By chaining PDA → CRT → Sweep → CISD → (EPE) → Risk on a single HTF backbone, the tool creates a coherent workflow where later signals simply do not appear without earlier context. That’s why this is not a bundle of independent features: each module’s output is another module’s input.
Concepts & operational rules (high level)
HTF PD Arrays (FVGs)
Uses a standard three-candle gap definition on the chosen HTF, with filters for weekend/tiny gaps.
Inverse mitigation: if price trades cleanly through an array, the box is removed and internal state resets.
Nearest-PDA persistence: when multiple arrays exist, only the closest remains visible to reduce clutter.
Optional right-extension draws lingering influence X bars forward.
Candle Range Theory (CRT)
Bullish CRT: candle 2 wicks below candle 1’s low but closes back inside candle 1’s range, without taking its high.
Bearish CRT: candle 2 wicks above candle 1’s high but closes back inside candle 1’s range, without taking its low.
Role: bias validation paired to CISD when alignments match the active PDA.
Liquidity Sweeps (BSL/SSL)
Tracks candidate HTF pivots as buy-/sell-side liquidity.
A sweep registers when price takes a tracked pivot in the vicinity of the active PDA.
CISD (Change in State of Delivery)
Finds the sequence open for the impulsive leg that begins at/after the sweep.
Bearish path (after BSL sweep): CISD when close < sequence-open.
Bullish path (after SSL sweep): CISD when close > sequence-open.
On confirmation, the model plots a CISD line, checks the box in the Strategy Checklist, and triggers risk calc.
EPE (Easiest Point of Entry)
Within a short window after CISD, scans for a local imbalance; if present, promotes that level as EPE.
If no imbalance forms, CISD remains the operative reference.
Dynamic TP / BE / SL
Built from the measured leg around CISD (not fixed pip steps).
Approximate geometry: BE ≈ 1× leg, TP ≈ 2.25× leg; SL respects nearby structural extremes.
Labels and price markers are optional.
Architecture notes
Maps the current chart to a higher timeframe (e.g., 15s→M5, M1→M15, M5→H1, M15→H4, H1→D, H4→W, D→M).
Retrieves HTF OHLC/time with no lookahead so structures update intrabar until the HTF bar closes.
Periodic cleanup clears obsolete lines/labels/boxes to keep charts responsive.
Inputs (summary)
FVGs/PD Arrays: show/hide, colors, borders, label size, right-extension, nearest-only toggle.
CRT: enable/disable, label style.
Sweeps/CISD/EPE: enable/disable, line/label styles, EPE window.
Risk Levels (TP/BE/SL): enable each, price labels on/off, colors.
Tables/Checklist: strategy checklist on/off; relationships table (common HTF↔LTF pairings); text sizes and header colors.
Alerts (optional)
You may add alertconditions aligned with these events in your own workspace:
HTF PDA tap (bullish/bearish box)
CRT detected (bullish/bearish)
CISD confirmed (bullish/bearish)
EPE set/updated
Example messages:
“Prophet: CISD confirmed on {{ticker}} / {{interval}}”
“Prophet: EPE refined at {{close}} ({{time}})”
Notes & limitations
HTF values are provisional until the HTF bar closes; labels/levels can update while forming.
CISD/EPE are live conditions; they can form and later invalidate within the same HTF bar.
Liquidity relationships vary by market/regime; thin sessions and large gaps can affect clarity.
Educational tool only. No performance claims; no trade signals.
Originality & scope (for protected/invite-only publications)
A single HTF-synchronized engine sequences PDA → CRT → Sweep → CISD → (EPE) and withholds later steps unless prerequisites are met.
Nearest-PDA persistence and inverse-mitigation enforce focus on the most relevant institutional zone.
Displacement-based risk math ties TP/BE/SL to structure instead of static offsets.
Checklist + relationships table promote consistent, rules-first behavior and reduce discretionary drift.
Attribution: Concepts inspired by ICT (PD arrays/FVGs, CRT, sweeps, displacement, refined entries). Design, integration logic, and risk framework by TakingProphets.

Fair Value Gaps by DGTFair Value Gaps
A refined, multi-timeframe Fair Value Gap (FVG) detection tool that brings institutional imbalance zones to life directly on your chart.
Designed for precision, it visualizes how price delivers into inefficiencies across chart, higher, and lower (intrabar) timeframes — offering a fluid, structural view of liquidity displacement and market flow.
The script continuously tracks unfilled, partially repaired, and fully resolved imbalances, revealing where liquidity inefficiencies concentrate and where price may seek rebalancing.
Overlapping zones naturally expose institutional footprints, potential liquidity targets, and key re-pricing regions within the broader market structure.
KEY FEATURES
⯌ Multi-Timeframe Detection
Detect and display FVGs from the current chart, higher timeframes (HTF), or lower timeframes (LTF)
⯌ Smart Fill Tracking
Automatic real-time monitoring of each FVG’s fill progress with live percentage updates
⯌ Custom Fill Logic
Choose your preferred definition of when a gap is considered filled: Any Touch
Midpoint Reached
Wick Sweep
Body Beyond
⯌ Dynamic Labels & Tooltips
Labels can be toggled on/off. Even when hidden, detailed tooltips remain available by hovering over the FVG midpoint.
⯌ Adaptive Lower-Timeframe Mode
When set to “Auto,” the script intelligently selects the optimal lower timeframe based on the chart resolution.
DISCLAIMER
This script is intended for informational and educational purposes only. It does not constitute financial, investment, or trading advice. All trading decisions made based on its output are solely the responsibility of the user.

Orderblocks & BreakersThis indicator identifies potential orderblocks and breakers based on recent swing highs and lows. It is built to offer a structured, customizable, and noise-controlled view of how price interacts with supply and demand levels.
The script applies pivot-based swing detection to identify swing highs and lows.
Bullish Orderblocks: The script Identifies and stores the last down candle before a swing high is breached and confirms and plots the orderblock with a market structure break (close above the swing high).
Bearish Orderblocks: The script Identifies and stores the last up candle before a swing low is breached and confirms and plots the orderblock with a market structure break (close below the swing low).
When price later closes through an existing orderblock, it is reclassified as a Breaker and recolored accordingly. (all colors can be changed in the settings)
What Makes It Different
Unlike most orderblock tools that simply mark every swing-based block, this version introduces:
1. Chop Control – automatically hides breakers that price repeatedly closes through (2 closes after the orderblock becomes a breaker), keeping only relevant zones visible.
2. Recent Block Filtering – limits how many of the recent orderblocks or breakers are displayed, preventing chart clutter.
3. Dynamic Updating – orderblocks automatically convert to breakers when price closes beyond them, with clear color changes.
These features make it easier to study cleaner price structure without manually managing old or invalid zones. The optional Chop Control filter can reduce overlapping or repeatedly invalidated zones to keep the chart clearer.
Customizable Parameters
- Swing detection length (shorter means more aggressive pivot detection, longer means less aggressive so less highs/lows detected)
- Number of recent blocks to display
- Visibility toggles for orderblocks or breakers
- Color and transparency controls for each type
Alerts
Alerts can be set to trigger when price tests any defined zone.
Purpose
This indicator is designed as a price structure visualization and study tool.
It may assist in understanding how price interacts with previously active regions, but it does not produce signals or trade recommendations.
