Candle Colored by Volume Z-score [Morty]This indicator colors the candles according to the z-score of the trading volume. You can easily see the imbalance on the chart. You can use it at any timeframe.
In statistics, the standard score (Z-score) is the number of standard deviations by which the value of a raw score (i.e., an observed value or data point) is above or below the mean value of what is being observed or measured. Raw scores above the mean have positive standard scores, while those below the mean have negative standard scores.
This script uses trading volume as source of z-score by default.
Due to the lack of volume data for some index tickers, you can also choose candle body size as source of z-score.
features:
- custom source of z-score
- volume
- candle body size
- any of above two
- all of above two
- custom threshold of z-score
- custom color chemes
- custom chart type
- alerts
default color schemes:
- green -> excheme bullish imbalance
- blue -> large bullish imbalance
- red -> excheme bearish imbalance
- purple -> large bearish imbalance
- yellow -> low volume bars, indicates "balance", after which volatility usually increases and tends to continue the previous trend
Examples:
* Personally, I use dark theme and changed the candle colors to black/white for down/up.
Volume as Z-score source
Any as Z-score source, more imbalances are showed
在腳本中搜尋"imbalance"

Volume-Time Imbalance (VTI)Volume-Time Imbalance (VTI) – Indicator Description
This indicator measures the imbalance between traded volume and the time elapsed between bars to identify unusual spikes in volume per second (volume per unit of time). Its purpose is to highlight volume movements that may indicate moments of strong interest, acceleration, or reversal in the market.
How it works:
It calculates the traded volume divided by the time (in seconds) elapsed since the previous bar — thus obtaining the volume per second.
An EMA (exponential moving average) of this volume per second is calculated to smooth the data.
The VTI value is the ratio between the current volume per second and this moving average, showing if the current volume is above what is expected for that pace.
The higher the VTI, the greater the imbalance between volume and time, indicating possible bursts of activity.
Settings:
VTI Moving Average Length: The period of the moving average used to smooth the volume per second (default is 20).
Alert Thresholds: Alert levels to identify moderate and high imbalances (defaults are 1.5 and 2.0).
Show VTI Histogram: Displays the VTI histogram in the indicator window.
Color Background: Colors the indicator background based on the strength of the imbalance (orange for moderate, red for high).
Show Alert Arrows: Shows arrows below the chart when a strong volume spike occurs (high alert).
Interpretation:
VTI values above the moderate level (1.5) indicate an unusual increase in volume relative to time.
Values above the high level (2.0) signal strong spikes that may anticipate significant moves or trend changes.
Use the colors and arrows as visual confirmations to quickly identify these moments.

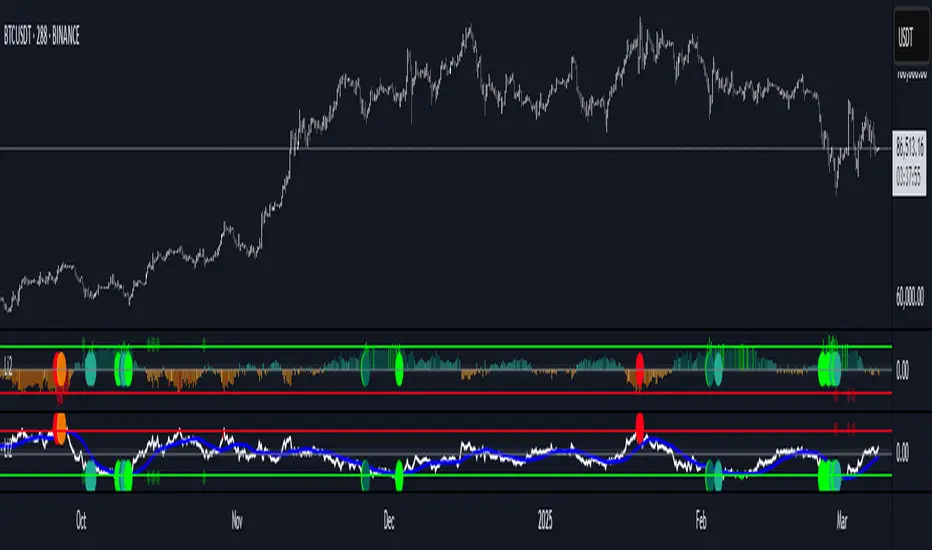
Liquidity Imbalance Index (Li2)How to Use the Liquidity Imbalance Index (Li2)
The Liquidity Imbalance Index (Li2) is designed to track market liquidity and identify significant imbalances between buyers and sellers. Here's how to effectively use this indicator in your trading:
Understanding the Main Components
1. Liquidity Delta Histogram/Line:
- Shows the difference between buy and sell liquidity
- Green bars/line: Buying pressure dominates
- Red bars/line: Selling pressure dominates
- The intensity of color shows the strength of the imbalance
2. Threshold Lines:
- Upper (green) threshold: Marks significant buy pressure
- Lower (red) threshold: Marks significant sell pressure
- Neutral zone: Area between the dotted lines where neither buyers nor sellers dominate
3. Liquidity Zones (circles shown on top/bottom):
- Green circles on upper threshold: Historical bull zones (significant buying interest)
- Red circles on lower threshold: Historical bear zones (significant selling interest)
- These zones require multiple hits, consecutive signals, and optionally volume confirmation
Trading Strategies
For Trend Trading
1. Look for when the Liquidity Delta crosses above the upper threshold for bullish signals
2. Look for when the Liquidity Delta crosses below the lower threshold for bearish signals
3. Especially powerful when crossing occurs with acceleration (darker histogram colors)
For Support and Resistance
1. Identify where the significant bull/bear zones appear (green/red circles)
2. These often align with important price levels where orders cluster
3. Use these zones as potential reversal or confirmation points
For Divergence
1. Watch for price making new highs/lows while liquidity shows the opposite
2. Divergence between price and liquidity can signal potential reversals
Volume Confirmation
1. Pay attention to volume-confirmed signals (small circles at zero line)
2. These indicate stronger conviction behind the liquidity imbalance
Optimal Settings
- For day trading or volatile markets, consider reducing lookback periods and increasing thresholds
- For swing trading, the default settings work well to capture significant zones
- In ranging markets, focus on the zones as they often mark the range boundaries
- In trending markets, follow the overall direction of the liquidity delta
Reading Acceleration Signals
The indicator shows color intensity variations to highlight acceleration in liquidity flows:
- Dark green/red: Strong acceleration (rapid shift in order flow)
- Medium green/red: Medium acceleration
- Light green/red: Weak acceleration
These acceleration signals often precede significant price movements.
Easy FootprintThis script represents a simple footprint system which can currently be applied on time based candles only.
Options:
Display Bid/Ask volumes at price
Display horizontal delta at price
Highlight Buuying/Selling/Both imbalances at price (default, green, red or orange(both) background color)
Highlight the POC of the current candle (yellow cell border)
Display the current candle
Parameters:
Imbalance threshold: Minimal proportion to highlight cells in case of buying/selling imbalances (2=200% , 3=300%, etc...)
Text size: Just a display option to select the size of the text in cells
Price truncation factor: Allows the user to configure the size of each cell (default factor 0 is 1pts, factor 1 is 0.1 pts, factor 2 is 0.01 pts, factor -1 is 10 pts, etc...)
Volume decimals: Select the precision you want to see in volume information
Enable display of bid/ask volume at price
Enable display of horizontal delta at price
Note :
Some cells might be missing within a candle when gaps appear

FVG Matrix - Orderblock, Expansion & Rejection(@JP7FX)FVG Matrix (JP7FX)
FVG Matrix detects and displays multiple types of Fair Value Gaps. It gives traders a clear view of imbalance behaviour without manual marking.
FVG Types
The indicator identifies five categories of FVGs:
• Standard FVGs
Three candle price inefficiencies.
• Orderblock FVGs
Gaps that form near orderblocks.
• Expansion FVGs
Imbalances created during strong impulsive moves.
• Consolidation FVGs
Gaps within tight ranges.
• Rejection FVGs
Gaps that show rejection behaviour when price returns.
Each type can be enabled, disabled or recoloured.
Features
• Multi type FVG detection across all timeframes.
• 50 percent mitigation tracking to show partial fills.
• Alerts for FVG creation and mitigation.
• Control over whether mitigated FVGs remain on the chart.
• Full colour and visibility customisation.
Alerts
The indicator includes alert conditions for new FVG creation and FVG mitigation.
Users can choose which FVG types trigger alerts.
Use Cases
Suitable for traders who track imbalance behaviour or follow Smart Money concepts. The indicator reduces chart work by automating the identification and organisation of Fair Value Gaps.

ICT Killzones Pro Suite — ICT & SMC Indicator with AlertsThe ICT Killzones Pro Suite is a complete ICT and Smart Money Concepts (SMC) indicator that brings together the most important institutional concepts into one single tool.
Instead of manually drawing sessions, structure breaks, liquidity levels or imbalances, this ICT indicator for TradingView automatically plots them with precision and full customization.
It is widely used by traders in Forex, Indices, Crypto and Commodities who want to study market structure the same way institutions do.
🔎 Features
✅ Killzones (Asia, London, New York)
Session boxes with customizable colors
50% midline level for equilibrium reference
Real-time status display (“In Killzone” / “Out of Killzone”)
✅ Equal Highs & Equal Lows (Liquidity zones)
Automatic detection of EQH/EQL
Equality tolerance parameter
Zone expiry (bars)
Rejection filter (2 consecutive closes)
Option to show only the latest active EQH/EQL
✅ Break of Structure (BOS) & Market Structure Shift (MSS)
Detects continuation (BOS) and reversal (MSS) structures
Customizable line styles and colors
“Body only” or “Body/Wick” break modes
Option to show only the latest signals
✅ Open Price Range (OPR)
Institutional daily open level in UTC
Historical OPR memory for backtesting
Optional labels for quick identification
✅ Previous Highs and Lows
Daily (PDH/PDL), Weekly (PWH/PWL), Monthly (PMH/PML)
Full label system
Customizable line width/style
Breakout alerts for each level
✅ Fair Value Gaps (FVGs)
Automatic imbalance detection
Wick or body detection modes
Highlighted imbalance candles in yellow
✅ Alerts Engine
One global alert condition
Modular alerts:
• Killzone opens/closes
• EQH/EQL created or broken
• BOS/MSS bullish & bearish signals
• Previous Highs/Lows breakouts
• FVGs
⚙️ Parameters Explained
Killzones: start/end times in UTC, colors, extension lines, 50% midline
EQH/EQL: tolerance (0 = strict equality, >0 = margin allowed), expiry age (bars), rejection filter, body/wick break type, latest only toggle
BOS/MSS: swing bars (pivots), body vs wick detection, line styles & widths, only-latest option
OPR: exact UTC time (HH:MM), history toggle, label size/color
Previous Highs/Lows: daily/weekly/monthly levels, line styles, label settings, breakout alerts
FVGs: wick vs body detection, candle highlight color
Alerts: global condition + per-module toggles (sessions, liquidity, BOS/MSS, FVG)
Every parameter is fully customizable, making this SMC indicator adaptable to any trading style or timeframe.
📌 Why use this ICT & SMC indicator?
Saves time by automating repetitive tasks
Provides an institutional framework directly on charts
Keeps analysis structured and consistent
Optimized for intraday scalping and swing trading
⚠️ Disclaimer
This script is for educational purposes only. It does not guarantee profits or predict markets with certainty. Always use proper risk management.
🔑 Access
This is an invite-only script on TradingView.
Click Request Access on this page to apply.

Initial Imbalance [First FVG - ICT] v1Initial Imbalance v1
This indicator identifies the first Fair Value Gap (FVG) at the start of a user-defined session, inspired by The Inner Circle Trader. It helps traders spot initial imbalance in a sessions price action, offering filter options to refine FVG detection and optional session high/low lines for context.
Features:
Detects the first bullish or bearish FVG at the session start (default: 08:30). ISE: Sets a custom session start time (hour and minute).
Filters FVGs by size: None, ATR-based, or Points-based.
Displays session high/low lines (optional) to visualize the session range.
Customizable colors for bullish and bearish FVGs (background and border derived from a single color input).
Alerts for new FVGs and mitigated FVGs.
Settings:
Session Start Time: Define the hour and minute for the session start.
FVG Filter Type: Choose None, ATR, or Points to filter FVGs by size.
ATR Multiple / Minimum Points: Set the minimum FVG size for ATR or Points filters.
Show Session High/Low Lines: Toggle visibility of session range lines.
Bullish/Bearish FVG Colors: Customize colors for FVGs.
Technical Details:
Overlay indicator, displayed directly on the price chart.
This indicator is ideal for traders seeking to identify key price imbalances at the start of a session, with flexible filtering and visualization options.

Liquidity Voids (FVG) [LuxAlgo]The Liquidity Voids (FVG) indicator is designed to detect liquidity voids/imbalances derived from the fair value gaps and highlight the distribution of the liquidity voids at specific price levels.
Fair value gaps and liquidity voids are both indicators of sell-side and buy-side imbalance in trading. The only difference is how they are represented in the trading chart. Liquidity voids occur when the price moves sharply in one direction forming long-range candles that have little trading activity, whilst a fair value is a gap in price.
🔶 USAGE
Liquidity can help you to determine where the price is likely to head next. In conjunction with higher timeframe market structure, and supply and demand, liquidity can give you insights into potential price movement. It's essential to practice using liquidity alongside trend analysis and supply and demand to read market conditions effectively.
The peculiar thing about liquidity voids is that they almost always fill up. And by “filling”, we mean the price returns to the origin of the gap. The reason for this is that during the gap, an imbalance is created in the asset that has to be made up for. The erasure of this gap is what we call the filling of the void. And while some voids waste no time in filling, some others take multiple periods before they get filled.
🔶 SETTINGS
The script takes into account user-defined parameters and detects the liquidity voids based on them, where detailed usage for each user-defined input parameter in indicator settings is provided with the related input's tooltip.
🔹 Liquidity Detection
Liquidity Voids Threshold: Act as a filter while detecting the Liquidity Voids. When set to 0 basically means no filtering is applied, increasing the value causes the script to check the width of the void compared to a fixed-length ATR value
Bullish: Color customization option for Bullish Liquidity Voids
Bearish: Color customization option for Bearish Liquidity Voids
Labels: Toggles the visibility of the Liquidity Void label
Filled Liquidity Voids: Toggles the visibility of the Filled Liquidity Voids
🔹 Display Options
Mode: Controls the lookback length of detection and visualization
# Bars: Lookback length customization, in case Mode is set to Present
🔶 RELATED SCRIPTS
Buyside-Sellside-Liquidity
Fair-Value-Gaps

📊 Volume Tension & Net Imbalance📊 Volume Tension & Net Imbalance (With Table + MultiLang + Alerts)
//
This indicator measures bullish vs. bearish pressure using volume-based tension and net imbalance.
It identifies accumulation zones, displays real-time market strength, trend direction, and triggers alerts on buildup entries.
Fully customizable table size, colors, and bilingual support (English/Russian).

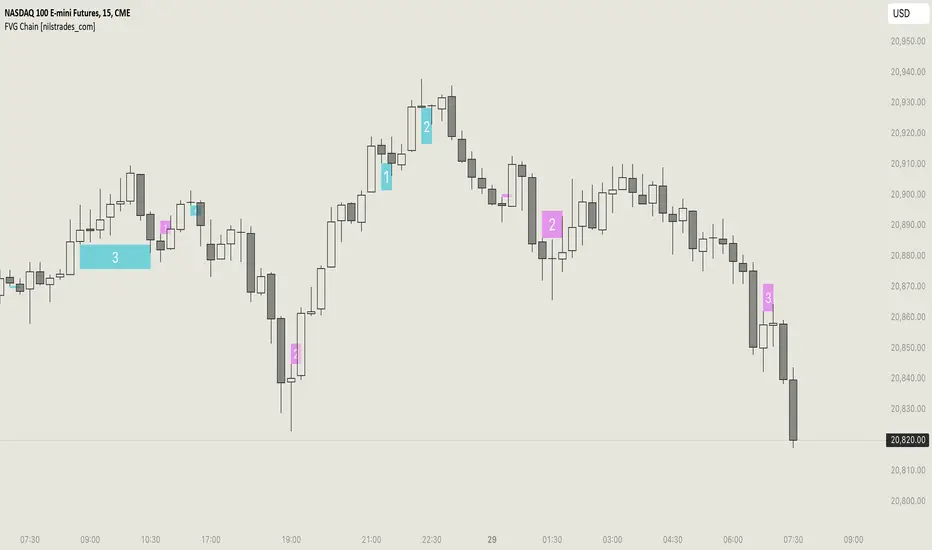
FVG Chain (Consecutive Fair Value Gaps / Imbalances)This indicator detects fair value gaps that are created out of the touch of older fair value gaps, hence creating an "FVG chain".
It counts +1 for the chain whenever a new price leg's FVG is touched.
You can use the current FVG Chain count, as well as the high, low, and price leg high/low of the current FVG as input source in external indicators. Check the data window to see the plot values.
How FVGs are detected:
Bullish: The low of the current confirmed bar is above the high of 2 bars back.
Bearish: The high of the current confirmed bar is below the low of 2 bars back.
A bullish FVG chain is broken if:
The current FVG's price leg low is broken.
The previous bar closed below the FVG, and the current confirmed bar closed below the previous bar.
A bearish FVG chain is broken if:
The current FVG's price leg high is broken.
The previous bar closed above the FVG, and the current confirmed bar closed above the previous bar.
Displacement (Two FVGs)A simple indicator that attempts to identify displacement in price by alerting you when two simultaneous Fair Value Gaps (FVGs) occur.
When two fair value gaps occur, the indicator will print a green bar (if bullish) or a red bar (if bearish). If you right click on the indicator you can turn on alerts that will pop up every time a dual FVG occurs.
Fair Value Gaps are most commonly used amongst price action traders and are defined as instances in which there are inefficiencies, or imbalances, in the market.
The concept for this indicator is very simple. Apply it to your chart and enable alerts on the instruments and timeframe you trade. When you get an alert, it could indicate larger players getting involved.
This is NOT a trading strategy. Its intention is to save time by alerting you to large imbalances in price on the instruments you trade.

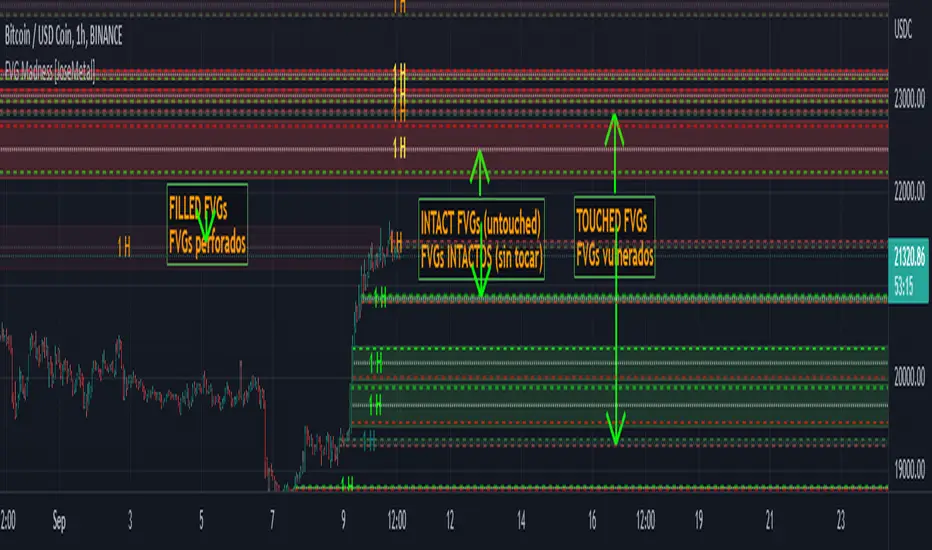
FVG Madness [JoseMetal]============
ENGLISH
============
- Description:
FVG (Fair Value Gap) / imbalances are inefficiencies in the price action generated by violent prices changes, the market is supposed to try to fill or at least retest these later on.
This is just one of the "Smart Money Concepts" or "Institutional trading", and there are different strategies to trade them.
Some use them as "price magnets", but in my case I use them to let orders placed on the "entry" line and take profit on the "exit" line, for both LONG or SHORT.
Others use them as reversal points (50% of the FVG), that's why I added a 50% line to each FVG, I want to make it usable for every single strategy related to FVGs.
Take your time to back test, study, and pick the best strategy for you as you'd do with any other indicator.
- Visual:
So like a "generic" FVG indicator this one also prints the FVGs, colors are customizable for both, bullish and bearish FVGs.
When a FVG is "touched" but not "filled" it changes color, which is also customizable.
As I said I use them as entry and take profit, so I added 3 lines, an entry line, midline and exit line, all have custom colors for both "untouched" and "touched" FVGs for better visualization.
- Customization:
All colors are customizable for both "untouched" and "touched" FVGs as well as their lines as well as the line style (so you can have dashed entry and exit for example but dotted midline, full customization).
You can pick to auto-delete a FVG if not filled completely but a percentage.
Entry and exit lines can be placed based on a percentage too.
Boxes for the FVGs can be extended or not.
There's an ATR (Average True Ratio) filter to ignore (don't plot) small FVGs which would only mess the chart, is custom, but default value is recommended.
- Usage and recommendations:
FVGs are supposed to work on any timeframes, i've seen traders using my strategy (placer a STOP LIMIT on the entry line and take profit on the exit line) even on 1 minute, however, if you have several FVGs you can aim to open a single position and take partial profit on each FVG.
Finally, on my back test i've seen that on 4H+ timeframes a lot of FVGs are only filled up to 50% as one of the mentioned strategies so make sure to move your stop to break even on that point or even close half or the position, just a recommendation to avoid absurd loses.
Enjoy!
============
ESPAÑOL
============
- Descripción:
Los FVG (Fair Value Gap) / imbalances son ineficiencias en la acción del precio generadas por cambios violentos en el mismo, se supone que el mercado trata de llenarlos o al menos volver a testearlos más tarde.
Éste es uno de los "Smart Money Concepts" o "Trading Institucional", y hay diferentes estrategias para operar con ellos.
Algunos los utilizan como "imanes del precio", pero en mi caso los utilizo para que las órdenes se coloquen en la línea de "entrada" y tomen ganancias en la línea de "salida", tanto para LONG como para SHORT.
Otros los usan como puntos de reversión (50% del FVG), por eso añadí una línea del 50% a cada FVG, quiero que sea utilizable para cada estrategia relacionada con los FVGs.
Tómate tu tiempo para hacer pruebas, estudiar y elegir la mejor estrategia como lo harías con cualquier otro indicador.
- Visual:
Al igual que un indicador FVG "genérico" este también dibuja los FVGs, los colores son personalizables para ambos, FVGs alcistas y bajistas.
Cuando un FVG es "tocado" pero no "llenado" cambia de color, que también es personalizable.
Como dije, los uso como entrada y toma de ganancias, así que agregué 3 líneas, una línea de entrada, una línea media y una línea de salida, todas tienen colores personalizados tanto para los FVGs "no tocados" como para los "tocados" para una mejor visualización.
- Personalización:
Todos los colores son personalizables tanto para los FVGs "intactos" como para los "tocados", así como sus líneas y el estilo de las mismas (por lo que puede tener la entrada y la salida punteadas, por ejemplo, pero la línea media punteada, personalización total).
Se puede elegir auto-borrar un FVG si es rellenado un determinado porcentaje en lugar de completo.
Las líneas de entrada y salida pueden ser colocadas en base a un porcentaje también.
Las cajas para los FVGs pueden ser extendidas o no.
Hay un filtro ATR (Average True Ratio) para ignorar (no dibujar) los FVGs pequeños que sólo ensuciarían el gráfico, es personalizado, pero se recomienda el valor por defecto.
- Uso y recomendaciones:
Los FVGs se supone que funcionan en cualquier marco de tiempo, he visto operadores que utilizan mi estrategia (colocar una orden en la línea de entrada y tomar ganancias en la línea de salida) incluso en 1 minuto, sin embargo, si se acumulan muchos FVGs pequeños se puede para abrir una sola posición y tomar ganancias parciales en cada FVG.
Por último, en mis pruebas he visto que en marcos de tiempo de 4H+ muchos FVGs sólo se llenan hasta el 50% como una de las estrategias mencionadas, así que asegúrate de mover tu stop para alcanzar el punto de equilibrio o incluso cerrar la mitad de la posición, es sólo una recomendación para evitar pérdidas absurdas.
¡Que lo disfrutéis!
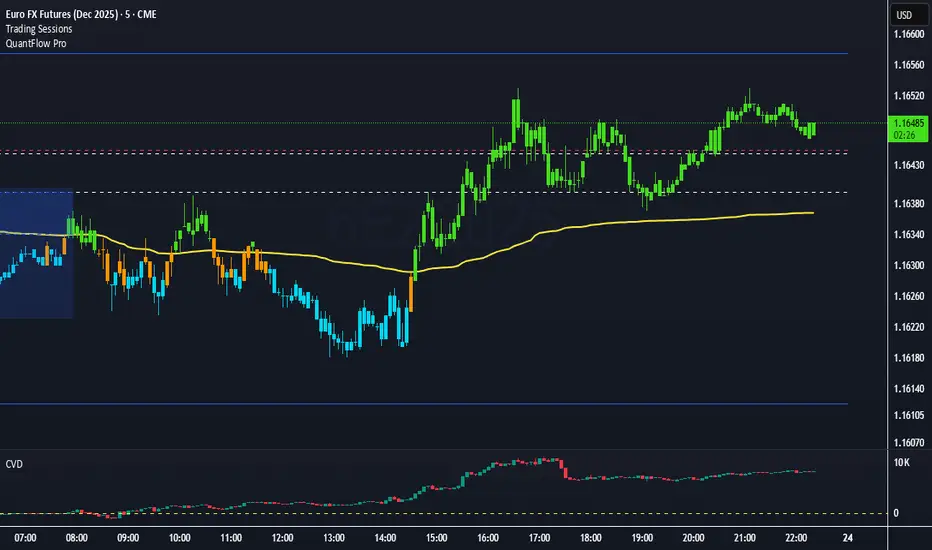
QuantFlow ProQuantFlow Pro
QuantFlow Pro is an advanced institutional indicator designed to detect bias shifts, liquidity imbalances, and real-time flow transitions.
Built on an adaptive architecture, it combines institutional flow analysis, multi-timeframe liquidity levels, and structural reference points to provide a clear and precise view of market dynamics.
Unlike conventional indicators that repaint or produce noisy signals, QuantFlow Pro relies on robust calculations based on volume, delta imbalance, and the detection of structural dislocations.
⚙️ Optimized for Futures markets, QuantFlow Pro helps traders identify market turning points with institutional precision and consistent reliability over time.
Market Imbalance Tracker (Inefficient Candle + FVG)# 📊 Overview
This indicator combines two imbalance concepts:
• **Squared Up Points (SUP)** – midpoints of large, "inefficient" candles that often attract price back.
• **Fair Value Gaps (FVG)** – 3-candle gaps created by strong impulse moves that often get "filled."
Use them separately or together. Confluence between a SUP line and an FVG boundary/midpoint is high-value.
---
# ⚡ Quick Start (2 minutes)
1. **Add to chart** → keep defaults (Percentile method, 80th percentile, 100-bar lookback).
2. **Watch** for dashed SUP lines to print after large candles.
3. **Toggle Show FVG** → see green/red boxes where gaps exist.
4. **Turn on alerts** → New SUP created, SUP touched, New FVG.
5. **Trade the reaction** → look for confluence (SUP + FVG + S/R), then manage risk.
---
# 🛠 Features
## 🔹 Squared Up Points (SUP)
• **Purpose:** Midpoint of a large candle → potential support/resistance magnet.
• **Detection:** Choose *Percentile* (adaptive) or *ATR Multiple* (absolute).
• **Validation:** Only plots if the preceding candle does not touch the midpoint (with tolerance).
• **Lifecycle:** Line auto-extends into the future; it's removed when touched or aged out.
• **Visual:** Horizontal dashed line (color/width configurable; style fixed to dashed if not exposed).
## 🔹 Fair Value Gaps (FVG)
• **Purpose:** 3-candle gaps from an impulse; price often revisits to "fill."
• **Detection:** Requires a strong directional candle (Marubozu threshold) creating a gap.
• **Types:**
- **Bullish FVG (Green):** Gap below; expectation is downward fill.
- **Bearish FVG (Red):** Gap above; expectation is upward fill.
• **Close Rules (if implemented):**
- *Full Fill:* Gap closes when the opposite boundary is tagged.
- *Midpoint Fill:* Gap closes when its midpoint is tagged.
• **Visual:** Colored boxes; optional split-coloring to emphasize the midpoint.
> **Note:** If a listed FVG option isn't visible in Inputs, you're on a lighter build; use the available switches.
---
# ⚙️ Settings
## SUP Settings
• **Candle Size Method:** Percentile (top X% of recent ranges) or ATR Multiple.
• **Candle Size Percentile:** e.g., 80 → top 20% largest candles.
• **ATR Multiple & Period:** e.g., 1.5 × ATR(14).
• **Percentile Lookback:** Bars used to compute percentile.
• **Lookback Period:** How long SUP lines remain eligible before auto-cleanup.
• **Touch Tolerance (%):** Buffer based on the inefficient candle's range (0% = exact touch).
## Line Appearance
• **Line Color / Width:** Customizable.
• **Style:** Dashed (fixed unless you expose a style input).
## FVG Settings (if present in your build)
• **Show FVG:** On/Off.
• **Close Method:** Full Fill or Midpoint.
• **Marubozu Wick Tolerance:** Max wick % of the impulse bar.
• **Use Split Coloring:** Two-tone box halves around midpoint.
• **Colors:** Bullish/Bearish, and upper/lower halves (if split).
• **Max FVG Age:** Auto-remove older gaps.
---
# 📈 How to Use
## Trading Applications
• **SUP Lines:** Expect reaction on first touch; use as S/R or profit-taking magnets.
• **FVG Fills:** Price frequently tags the midpoint/boundary before continuing.
• **Confluence:** SUP at an FVG midpoint/boundary + higher-timeframe S/R = higher quality.
• **Bias:** Clusters of unfilled FVGs can hint at path of least resistance.
## Best Practices
• **Timeframe:** HTFs for swing levels, LTFs for execution.
• **Volume:** High volume at level = stronger signal.
• **Context:** Trade with broader trend or at least avoid counter-trend without confirmation.
• **Risk:** Always pre-define invalidation; structures fail in chop.
---
# 🔔 Alerts
• **New SUP Created** – When a qualifying inefficient candle prints a SUP midpoint.
• **SUP Touched/Invalidated** – When price touches within tolerance.
• **New FVG Detected** – When a valid gap forms per your rules.
> **Tip:** Set alerts *Once Per Bar Close* on HTFs; *Once* on LTFs to avoid noise.
---
# 🧑💻 Technical Notes
• **Percentile vs ATR:** Percentile adapts to volatility; ATR gives consistency for backtesting.
• **FVG Direction Logic:** Gap above price = bearish (expect up-fill); below = bullish (expect down-fill).
• **Performance:** Limits on lines/boxes and auto-aging keep things snappy.
---
# ⚠️ Limitations
• Imbalances are **context tools**, not signals by themselves.
• Works best with trend or clear impulses; expect noise in narrow ranges.
• Lower-timeframe gaps can be plentiful and lower quality.
---
# 📌 Version & Requirements
• **Pine Script v6**
• Heavy drawings may require **TradingView Pro** or higher (object limits).
---
*For best results, combine with your existing trading strategy and proper risk management.*

Unrecovered Imbalanced Zone with PVRSAThis indicator highlights imbalanced PVSRA candles that have not been recovered.
Bullish Candles/Zones
200% Volume = Green
150% Volume = Blue
Bearish Candles/Zones
200% Volume = Red
150% Volume = Fuchsia
Imbalanced Zones with normal/below 150% Average 10ema volume can be displayed or hidden from view (Hidden by default)

Fair Value Gaps Mitigation Oscillator [LuxAlgo]The Fair Value Gaps Mitigation Oscillator is an oscillator based on the traditional Fair Value Gaps (FVGs) imbalances. The oscillator displays the current total un-mitigated values for the number of FVGs chosen by the user.
The indicator also displays each New FVG as a bar representing the current ratio of the New FVG in relation to the current un-mitigated total for its direction.
🔶 USAGE
When an FVG forms, it is often interpreted as strong market sentiment in the direction of the gap. For example, an upward FVG during an uptrend is typically seen as a confirmation of the strength and continuation of the trend, as it indicates that buyers are willing to purchase at higher prices without much resistance, suggesting strong demand and positive sentiment.
By analyzing the mitigation (or lack thereof), we can visualize the increase of directional strength in a trend. This is where the proposed oscillator is useful.
🔶 DETAILS
The oscillator's values are expressed as Percentages (%). Each FVG is allocated 100% of the total of its width with a max potential value of 100 and minimum potential value of 0.
Based on the "FVG Lookback" Input, the FVGs are scaled to fit within the range of +1 to -1. Using a higher "FVG Lookback" value will allow you to get indications of longer-term trends.
A higher value of the normalized bullish FVG areas suggest a stronger and cleaner uptrend, while lower values of the bearish the normalized bullish FVG areas suggest a stronger and cleaner downtrend.
+1 or -1 indicates that there is a Full Lookback of FVGs, and each one is fully un-mitigated, and the opposite direction of FVGs is entirely Mitigated.
When the price closes over/under or within an FVG it begins to get mitigated, when this happens the % of mitigation is subtracted from the total.
When a New FVG is formed, a Histogram bar is created representing the ratio of the current FVG's width to the total width off all un-mitigated FVGs.
The entire bar represents 100% of total un-mitigated FVG Width.
The filled area represents the current FVG's width relative to the whole.
A 50% hash mark is also displayed for reference.
🔶 SETTINGS
FVG Lookback - Determines the number of FVGs (Bullish and Bearish Pairs) to keep in memory for analysis.

ICT Fair Value Gap [LM]Hello traders,
I would like to present you ICT Fair Value Gap script. The idea is the same as in my other script to look form imbalances. I have improved the previous script from teaching of ICT and created this script to train the eye to see those gaps. Shrinking option also shows if the gap has been already filled and also in case gap is filled you can get alert in case you will set it up .
The script has two settings:
general settings - definition of volatility condition for middle candle
box settings - setting for boxes, box colors, shrinking
I hope you enjoy it,
Lukas

HybridWhales DAY TRADINGThis indicator offers a streamlined view of prevailing market trends on lower timeframes, empowering day traders to execute their strategies with greater precision
It incorporates two widely used exponential moving averages (EMAs)—the 50-period and 200-period—alongside an 800-period EMA, which effectively mirrors the 200-period EMA on the next higher timeframe. This setup provides enhanced flexibility, delivering multi-timeframe insights without the need to switch charts manually.
In addition, the indicator highlights essential intraday levels for quick reference:
Daily Open, denoted in yellow
Monday Highs, marked in red
Monday Lows, indicated in green
The indicator's core strength lies in its ability to detect market maker activity through color-coded candlesticks, based on volume analysis. Candles exhibiting significantly higher volume than the average of the prior eight candles are colored green (for bullish closes) or red (for bearish closes), signaling active market maker positioning—either entering shorts or longs.
Candles with moderately elevated volume (above average but not extreme) are shaded blue (bullish) or pink (bearish), suggesting market makers are accumulating short or long positions.
Interpretation is key: Red or pink candles (bearish) imply that market makers have initiated long positions, with price likely to revisit and fill these areas in the future. Conversely, green or blue candles (bullish) indicate market makers establishing shorts, anticipating a eventual pullback to these levels
To pinpoint the precise zones where price may return, the indicator places a white marker on each colored candle at its 50% retracement level, representing a fair value gap or imbalance.
Overall, this tool enables traders to spot market maker footprints, identify critical support and resistance zones, gauge weekly ranges, and assess potential momentum. While it fosters stronger confluence in analysis, results are not guaranteed and depend on individual trading execution.

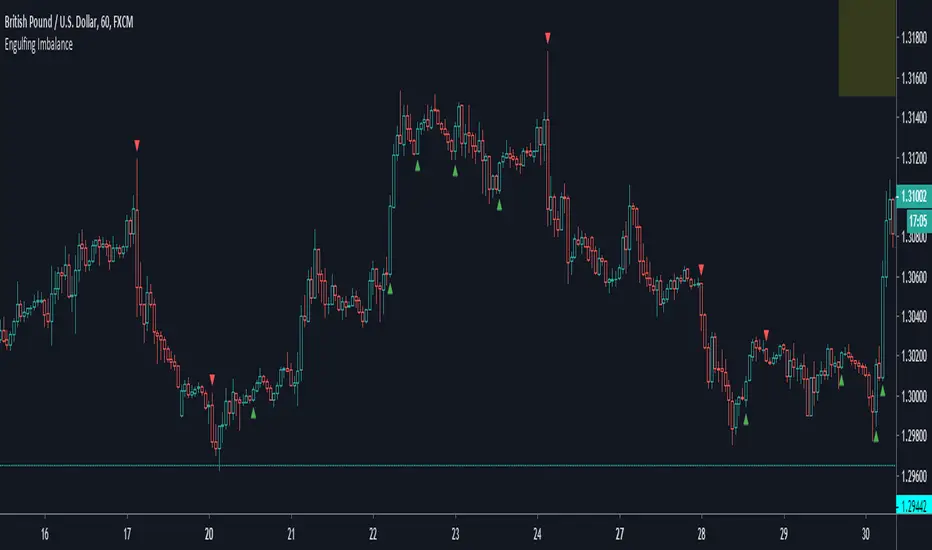
Engulfing ImbalanceShows Engulfing candles which are immediately followed by an imbalance. Useful to quickly identify impulsive moves and future reversal areas.
ICT FVG & Swing Detector Basic by Trader RiazICT FVG & Swing Detector Basic by Trader Riaz
Unlock Precision Trading with the Ultimate Fair Value Gap (FVG) and Swing Detection Tool!
Developed by Trader Riaz , the ICT FVG and Swing Detector Basic is a powerful Pine Script indicator designed to help traders identify key market structures with ease. Whether you're a day trader, swing trader, or scalper, this indicator provides actionable insights by detecting Bullish and Bearish Fair Value Gaps (FVGs) and Swing Highs/Lows on any timeframe. Perfect for trading forex, stocks, crypto, and more on TradingView!
Key Features:
1: Bullish and Bearish FVG Detection
- Automatically identifies Bullish FVGs (highlighted in green) and Bearish FVGs (highlighted in red) to spot potential reversal or continuation zones.
- Displays FVGs as shaded boxes with a dashed midline at 70% opacity, making it easy to see the midpoint of the gap for precise entries and exits.
- Labels are placed inside the FVG boxes at the extreme right for clear visibility.
2: Customizable FVG Display
- Control the number of Bullish and Bearish FVGs displayed on the chart with user-defined inputs (fvg_bull_count and fvg_bear_count).
- Toggle the visibility of Bullish and Bearish FVGs with simple checkboxes (show_bull_fvg and show_bear_fvg) to declutter your chart.
3: Swing High and Swing Low Detection
- Detects Swing Highs (blue lines) and Swing Lows (red lines) to identify key market turning points.
- Labels are positioned at the extreme right edge of the lines for better readability and alignment.
- Customize the number of Swing Highs and Lows displayed (swing_high_count and swing_low_count) to focus on the most recent market structures.
4: Fully Customizable Display
- Toggle visibility for Swing Highs and Lows (show_swing_high and show_swing_low) to suit your trading style.
- Adjust the colors of Swing High and Low lines (swing_high_color and swing_low_color) to match your chart preferences.
5: Clean and Efficient Design
- Built with Pine Script v6 for optimal performance on TradingView.
- Automatically removes older FVGs and Swing points when the user-defined count is exceeded, keeping your chart clean and focused.
- Labels are strategically placed to avoid clutter while providing clear information.
Why Use This Indicator?
Precision Trading: Identify high-probability setups with FVGs and Swing points, commonly used in Smart Money Concepts (SMC) and Institutional Trading strategies.
User-Friendly: Easy-to-use inputs allow traders of all levels to customize the indicator to their needs.
Versatile: Works on any market (Forex, Stocks, Crypto, Commodities) and timeframe (1M, 5M, 1H, 4H, Daily, etc.).
Developed by Trader Riaz: Backed by the expertise of Trader Riaz, a seasoned trader dedicated to creating tools that empower the TradingView community.
How to Use:
- Add the Custom FVG and Swing Detector to your chart on TradingView.
- Adjust the input settings to control the number of FVGs and Swing points displayed.
- Toggle visibility for Bullish/Bearish FVGs and Swing Highs/Lows as needed.
- Use the identified FVGs and Swing points to plan your trades, set stop-losses, and target key levels.
Ideal For:
- Traders using Smart Money Concepts (SMC), Price Action, or Market Structure strategies.
- Those looking to identify liquidity grabs, imbalances, and trend reversals.
- Beginners and advanced traders seeking a reliable tool to enhance their technical analysis.
Happy trading!

Fair Value Gaps (FVG) [UAlgo]A fair value gap is especially popular among price action traders and occurs when there are inefficiencies or imbalances in the market, or when the buying and selling are not equal. Fair value gaps can become a magnet for the price before continuing in the same direction.
🔶 Key Features :
Fair Value Gap Identification:
Bullish fair value gaps occur when the current market price exceeds the previous high. The indicator identifies bullish gaps by comparing the low of the current candle with the high of the candle two candles ago . If the low of the current candle is higher than the high two candles ago and the closing price of the previous candle is also higher than the high two candles ago, a bullish fair value gap is detected.
Bearish fair value gaps occur when the current market price falls below the previous low. The indicator identifies bearish gaps by comparing the high of the current candle with the low of the candle two candles ago. If the high of the current candle is lower than the low two periods ago and the closing price of the previous candle is also lower than the low two candles ago, a bearish fair value gap is detected.
Fair Value Gap Filter :
ATR measures market volatility by analyzing the range of price movements over a specified period. It provides insights into the average price range that a security experiences within a given timeframe. After the ATR is calculated, a Simple Moving Average (SMA) is computed for the ATR values. This moving average smoothens out the ATR data, providing a clearer indication of the average volatility levels over time.
When the filter is active, fair value gaps are identified only if they occur during periods of relatively higher volatility, as indicated by the ATR being greater than the SMA. This helps in refining and obtaining the detection of stronger fair value gaps
An example with FVG filtering off:
An example with FVG filtering on:
Customizable Settings: Users have the flexibility to customize various parameters to suit their trading preferences. They can adjust settings such as the number of fair value gaps displayed, mitigation method (either based on closing prices or wicks), and apply filters based on Average True Range (ATR) to refine gap detection.
🔶 Disclaimer :
Use with Caution: Trading involves significant risk, and this indicator should be used with caution. While it can help identify potential trading opportunities, it does not guarantee profits and may sometimes provide false signals.
Not Financial Advice: The information provided by the Fair Value Gaps indicator is for educational and informational purposes only and should not be considered as financial advice. Traders should conduct their own research and consult with financial professionals before making any trading decisions.
Past Performance: Past performance is not indicative of future results. Historical price movements analyzed by the indicator may not accurately predict future market behavior.

Smart Money Add-Ons [TFO]Supplementing my “Smart Money Essentials ” indicator, these add-ons provide some more commonly used “Smart Money Concepts,” including SMT Divergence, and HTF POI, and open price lines for added confluence.
Smart Money Technique (SMT) Divergence is meant to annotate divergence between closely correlated assets. Take $ES_F and $NQ_F for example (S&P 500 and Nasdaq 100 futures). These two names normally track each other very closely, but if $ES_F is steadily rising towards a large institutional level and making higher highs, while $NQ_F is approaching a similarly important level and making lower highs on that same timeframe, this would indicate a divergence between the two assets that could foreshadow a “Smart Money Reversal.”
Open price lines can provide intraday levels of interest from important times of day, where the defaults are set to midnight (12:00 AM), 8:30 AM for news releases, and 9:30 AM New York market open (New York local time). The open prices at these times can often act as support and resistance when other confluence factors are present. Higher timeframe points of interest (HTF POI) are also helpful to remain mindful of imbalances and other inefficiencies in which lower timeframe price action may create some reversal structure.

[VC] Cumulative Delta Histogram V1.0The V.C Cumulative Delta Histogram shows the market's ongoing Buying/Selling pressure. It helps to determine whether Supply or Demand is dominating and in control.
➤If the Cumulative Delta Increases, the buyers are in control.➚
➤If the Cumulative Delta Decreases, the sellers are in control.➘
The use cases for this Indicator are vast and correlated with our other Delta Indicators. The following examples will explain how to use this Indicator.
Example 1 EUR / USD
In the above example, Negative Cumulative Delta Decreased & Turned into Positive Cumulative Delta. That indicates that sellers are losing control & buyers are getting power.
As a confirmation on the ' 'Box Chart Histogram'' it is evident that Demand is also increasing.
And on ''Wave Chart Index'' as a 3rd confirmation, you can see that the Delta has also increased compared to previous waves.
Example 2
Positive Delta on Cumulative Delta Histogram is decreasing & Negative Delta started increasing.
On the Box Chart Histogram , Demand is decreasing & Supply is increasing.
Additionally, on the Wave Chart Index , the Delta of the wave is also decreasing.
(in short, besides ''Cumulative Delta Histogram," Box chart Histogram & Wave Chart Index is also adding additional confirmation)
Note: Two types of Delta sources are included in this Cumulative Delta Indicator.
Type A: Simple Delta
Type B: Delta %
Simple Delta is the difference between Net Buying - Selling pressure.
Delta % also works in the same calculation, but a Volume weighted algorithm is applied on it.
You may use any of them that suits your analysis.
VC Cumulative Delta Histogram Settings & Inputs
Source:
Allows you to choose the source, Between Simple Delta & Delta %.
Cumulative Length:
Allows you to Change the cumulative length.
Positive & Negative Color:
It allows you to change the colors.
Style Menue
Allows you to change the style & color of the histogram.
Disclaimer Note:
V.C Cumulative Delta Histogram It is purely Volume , Delta, Demand & Supply imbalance and comparative analysis-based tool. Before applying this Indicator to your study, you should know about Volume , Delta & Spread, Demand & Supply, and Aggressive & Passive behaviour of buyers/sellers.
Some basic understanding of Sir Richerd Wyckoff's Theory can also be helpful.
