Index Position Size Calculator for [US30 / US100 / SP500]What it does
This tool helps you size positions consistently for index trades on US30 (Dow Jones), NAS100 (Nasdaq-100), and SP500 (S&P 500). Enter your account balance, risk %, and your planned Entry / Stop-Loss / Target and the script calculates:
• Position Size (rounded to your lot/contract step)
• Risk-to-Reward (R/R)
• Potential P/L in USD based on your inputs
• Visual Entry / SL / TP lines with green/red zones and concise labels
Supported contract styles
Choose a preset for common products (e.g., CFD $1/pt, YM/NQ/ES futures, MYM/MNQ/MES micros) or override the economics yourself. You remain in control of the two key levers:
• $/point — how many dollars you gain/lose per 1 index point per contract/lot
• Point size — how many price units equal 1 index point on your chart (often 1.0, but some brokers use 0.1 or 0.5)
Inputs
• Account Balance ($) and Risk % per trade
• Index: US30 / NAS100 / SP500
• Contract: CFD / Futures (YM, NQ, ES) / Micros (MYM, MNQ, MES)
• $/point: auto from Contract or manual override
• Point size: auto from Index or manual override
• Position size step: rounding (e.g., 1 for futures, 0.01 for CFDs)
• Entry / SL / TP: typed values (snapped to tick), with on-chart zones and labels
• Display toggles for lines and labels
How the math works
• StopPoints = |Entry − SL| ÷ PointSize
• ProfitPoints = |TP − Entry| ÷ PointSize
• Position Size = (AccountBalance × Risk%) ÷ (StopPoints × $/point)
• R/R = ProfitPoints ÷ StopPoints
• Potential P/L = PositionSize × Points × $/point
How to use (quick start)
1. Select Index and Contract.
2. Confirm $/point and Point size match your broker’s specs.
3. Enter Entry / SL / TP for the trade idea.
4. Read the Position Size, R/R, and Potential P/L in the info box.
5. Adjust for fees, spreads, and slippage as needed.
Notes & limitations
• Broker symbols can vary. Always verify $/point and Point size for your instrument before risking capital.
• The script does not place orders and does not generate trade signals; it’s a sizing/visualization tool.
• Results can differ across brokers due to pricing, spreads, minimum lot sizes, and execution rules.
• Use on the intended indices; you’ll see a reminder if you load it elsewhere.
Changelog highlights
• Pine v6, constant-safe inputs, tick-snapping, global fills (no local-scope errors).
• Robust label handling and optional minimal chart markers.
Disclaimer
This script is provided for educational purposes only and does not constitute financial advice or a recommendation to buy or sell any security or derivative. Trading involves risk, including the possible loss of principal. Always do your own research, verify contract specifications with your broker, and consider testing in a demo environment before trading live.
在腳本中搜尋"index"

Index Reversal Range with Volatility Index or VIXWhat is the Indicator?
• The indicator is a visualization of maximum price in which the respective index can go up to in comparison with it's Volatility Index or VIX.
Who to use?
• Intraday
• Swing
• Position
• Long term Investors
• Futures
• Options
• Portfolio Managers
• Mutual Fund Managers
• Index Traders
• Volatility based Traders
• Long term Investors and Options Traders gets the maximum benefit
What timeframe to use?
• 1 Year: Position & Investors
• 6 Months: Position & Investors
• 3 Months: Swing & Position
• 1 Month: Swing & Position
• 1 Week: Swing
• 1 Day: Swing
• 1 Hour: Intraday & Swing
What are Upper and Lower lines?
• Upper Line: If the index price reach closer to the Upper line there is a high chance of reversal to Bearish trend.
• Lower Line: If the index price reach closer to the Lower line there is a high chance of reversal to Bullish trend.
• This need to be confirmed with multiple levels like Daily, Weekly, Monthly etc.
How to use?
• If the price reach closer to that level there is a high chance of reversal from the current trend.
• To identify the reversal zone of the index.
• To identify the trend.
• Option Traders can Sell a Call or Put Option from that level.
• Long term Investors, Position or Swing traders can plan for a Long entry.
• Intraday traders can use lower timeframes to do the same.
Indicator Menu
• Input VIX: Identify the VIX Symbol of your Index and type it in the box.
• For example for NIFTY Index chart type INDIAVIX in the box.
• Choose multiple timeframes according to your convenience.
How to turn on indicator Name and Value labels?
• Right side of the screen >
• Right click on the Price scale >
• Labels > Indicators and financial name labels, Indicators and financial value labels
Further Reading:
• Various videos and reading materials are available about this method.

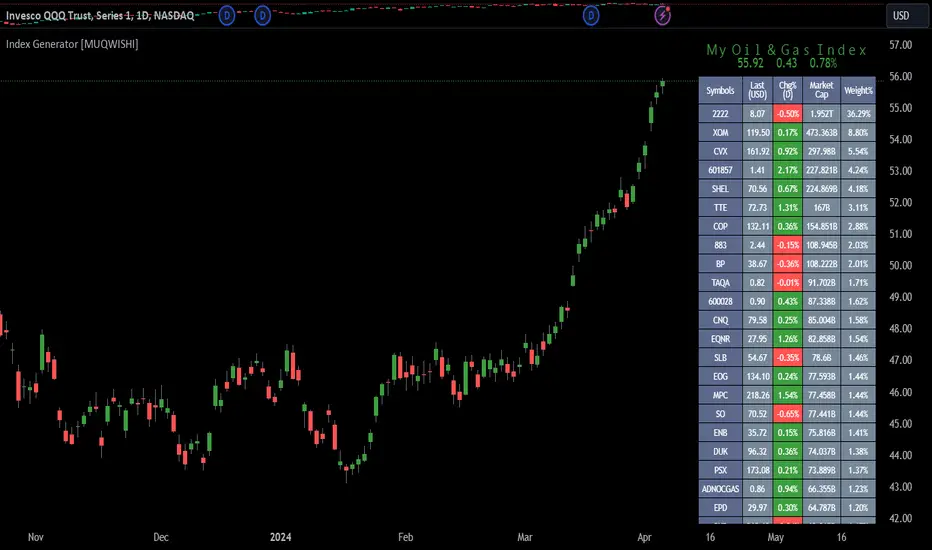
Index Generator [By MUQWISHI]▋ INTRODUCTION :
The “Index Generator” simplifies the process of building a custom market index, allowing investors to enter a list of preferred holdings from global securities. It aims to serve as an approach for tracking performance, conducting research, and analyzing specific aspects of the global market. The output will include an index value, a table of holdings, and chart plotting, providing a deeper understanding of historical movement.
_______________________
▋ OVERVIEW:
The image can be taken as an example of building a custom index. I created this index and named it “My Oil & Gas Index”. The index comprises several global energy companies. Essentially, the indicator weights each company by collecting the number of shares and then computes the market capitalization before sorting them as seen in the table.
_______________________
▋ OUTPUTS:
The output can be divided into 3 sections:
1. Index Title (Name & Value).
2. Index Holdings.
3. Index Chart.
1. Index Title , displays the index name at the top, and at the bottom, it shows the index value, along with the daily change in points and percentage.
2. Index Holdings , displays list the holding securities inside a table that contains the ticker, price, daily change %, market cap, and weight %. Additionally, a tooltip appears when the user passes the cursor over a ticker's cell, showing brief information about the company, such as the company's name, exchange market, country, sector, and industry.
3. Index Chart , display a plot of the historical movement of the index in the form of a bar, candle, or line chart.
_______________________
▋ INDICATOR SETTINGS:
(1) Naming the index.
(2) Entering a currency. To unite all securities in one currency.
(3) Table location on the chart.
(4) Table’s cells size.
(5) Table’s colors.
(6) Sorting table. By securities’ (Market Cap, Change%, Price, or Ticker Alphabetical) order.
(7) Plotting formation (Candle, Bar, or Line)
(8) To show/hide any indicator’s components.
(9) There are 34 fields where user can fill them with symbols.
Please let me know if you have any questions.
Index Value RainbowThis indicator is used to estimate Index valuation based on each countries base money supply M0. The chart will compare how the index value will move alongside with base money supply for comparison study. The chart presented here is just a relative comparison with some scaling and shifting so it doesn't refers to any real measurement. However it can be used to track the index whether it's too cheap or too expensive in relative to money supply available in the market.
- The gray line represent the money supply M0
- The rainbow above the gray line represent the multiplication factors from 1x, 2x, ..., 10x
- The rainbow below the gray line represent the division factors from 0.8x, 0.6x, ..., 0.2x
This indicator can only be used with specific indices mentioned below. Currently can be used to estimate the value of largest indices by market cap:
- US Index - based on Fed Balance Sheet (SPX, NDX, DJI, RUI, RUT, RUA, ES1!, NQ1!, YM1!, RTY1!)
- EU Index - based on M1 Money Supply (N100, EU500)
- JP Index - based on M0 Money Supply (NI225, NKY)
- CN Index - based on M0 Money Supply (000001, 399001)
- HK Index - based on M0 Money Supply (HSI)
- SG Index - based on M0 Money Supply (STI)
- CA Index - based on M0 Money Supply (TSX)
- AU Index - based on M0 Money Supply (ASX200, AUS200)
- ID Index - based on M0 Money Supply (COMPOSITE)
Check other script to value stock and index:
- Stock Value Rainbow: script to value stock based on book value, earning, dividend and cash flow
- Index Value Rainbow: script to value index based on fed balance sheet and base money supply
- Gold Value Rainbow: script to value gold based on global money supply
- Stock Value US: script to check US stock value
- Stock Value EU: script to check EU stock value
- Stock Value JP: script to check JP stock value
- Stock Value CN: script to check CN stock value

Index investingThe Index Investing indicator simplifies decision-making for adding to Index ETF's Long-term investments. By utilizing a percentage discount methodology, it highlights potential opportunities to enhance portfolios. This straightforward tool aids in identifying favorable moments to invest based on calculated price discounts from selected reference points, making the process more systematic and less subjective.
🔶 SETTINGS
Reference Price: Choose between 'All-Time-High' or 'Start of the Year' as the basis for calculating discount levels. This allows for flexibility in strategy depending on market conditions or investment philosophy.
Discount 1 %, Discount 2 %, Discount 3 %: These inputs define the percentage below the reference price at which buy signals are generated. They represent strategic entry points at discounted prices.
🔶 Default Parameters
The default parameters of 4.13%, 8.26%, and 12.39% for the discount levels are chosen based on the average 5-year return of the NSE:NIFTY Index, which stands at approximately 12.39%. By dividing this return into three parts, we obtain a structured approach to capturing potential upside at varying levels of market retracement, providing a logical basis for the selected default values.
Users have the flexibility to modify these parameters, tailoring the indicator to fit their unique approach and market outlook.
🔶 How Levels Are Calculated
Discount levels are calculated using the formula: Discount Price = Reference Price * (1 - Discount %) . This succinct approach establishes specific entry points below the chosen reference, such as an all-time high or the year's start price.
🔶 How Are the Buy Labels Generated
Buy signals are generated when the market price(Low of the candle) crosses under any of the defined discount levels. Each level has a corresponding buy label ('Buy 1', 'Buy 2', 'Buy 3'), which is activated upon the price crossing below the specified discount level and is only reset at the beginning of a new year or upon reaching a new reference high, ensuring signals are not repetitive for the same price level.
🔶 Other Features
Alerts: The indicator provides alerts for each buy signal, notifying potential entry points at their defined discount levels. The alert triggers only once per candle.
Year Marker: A vertical line with an accompanying label marks the start of each trading year on the chart. This feature aids in visualizing the temporal context of buy signals and reference price adjustments.

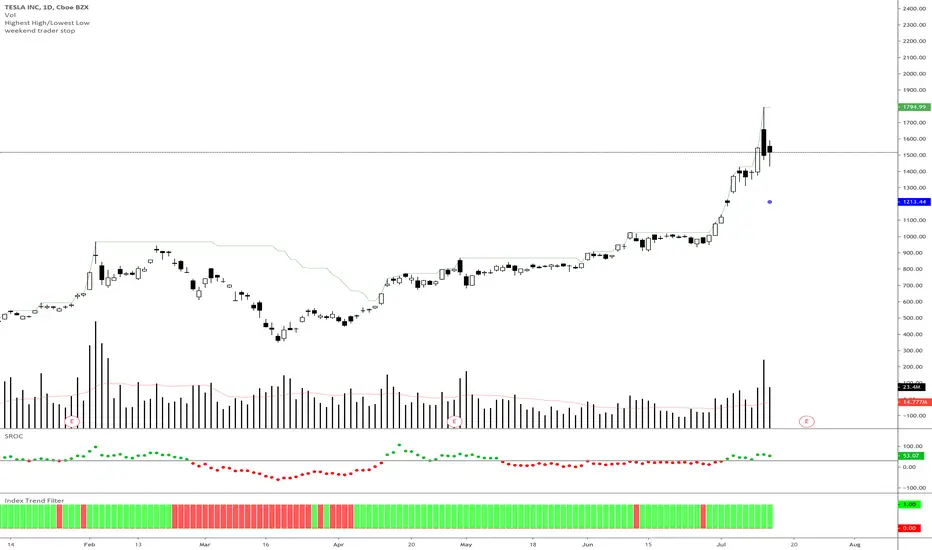
Index Trend Filter - Weekend Trend TraderThis little script simply gives you a quick visual cue of where price is compared to a particular EMA of another security or underlying index.
It is based on Nick Radge's broader market filter weekend trend trader system, but can be applied to other timeframes if you want to confirm if the index is in an up trend or down trend.
• Green means the underlying index price is above the EMA
• Red means the underlying index price is below the EMA
Kraken Altcoin IndexIndex based upon the valuation of LTC, ETH, ETC, XMR and ZEC in XBT, USD and EUR
Options:
- choose which of the above alt coins are part of the index
- choose whether you want to see the valuation in XBT, USD or EUR
Note that because of the high valuation of ZEC during the launch period and the months thereafter it has a significant effect on the index. This is true as well for XMR, though to lesser extend.
Because of these effect, ZEC and XMR are not taken part of the index by default.
Please like it, if you find it useful.
If you'd like me to improve the indicator, the by all means leave a comment or PM me.
Cheers!

LUNC Spot IndexIndex of several (eventually all) luna classic spot markets with some bonus features!

Index SMA vs. CloseVery simple script that index the close price with the SMA 20,50 and 200. It is very useful to plot and see if stocks are extended vs. de SMAs.
Index Vs Futures for OKEX Quarterly Contracts 5.0*****Please note that all old versions of this script are depreciated and will report incorrect data!*****
This "indicator" is made to display the history of the price difference between OKEX's quarterly contracts and the market that it is supposed to be tracking. Contango differences are natural, but it's nice to visualize how they change over time.
This update to this script brings in further functionality when OKEX changed the index that the futures contracts are based off of to remove chinese exchanges from the mix. This script reflects that change and crosses-over when that change was made.
The new index removed chinese exchanges which are (currently) trading at a significant discount which will give bad data when using my old code.

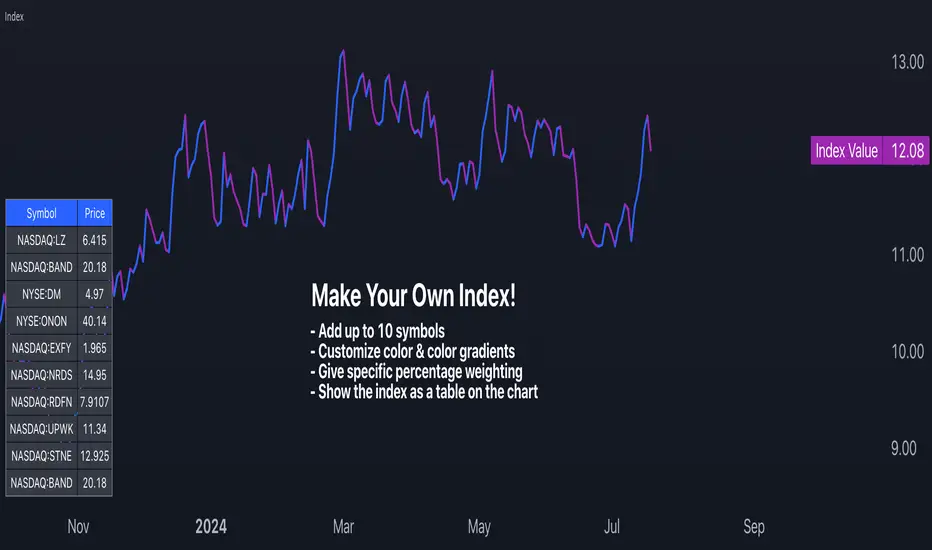
Make Your Own Index!Intro
For my first script, I have released Make Your Own Index version 1. It has a long way to go so please stay tuned. Scroll down to read all the updates and notes as they come in.
Why it matters
Making your index is important to quickly see an index of symbols that you want to chart. Having the ability to assign weightings gives you the opportunity to make the index equal weighted or custom weighted. As we all know, indexes like the S&P 500 are NOT equal weighted, but more heavily weighted toward the winners. Now, you can make your own of a basket of symbols and make them custom weighted or equal weighted. Have some fun exploring this.
Features
You select the symbols of your choice and then chart them as one line with a specific weighting. This can be done in the settings menu once the indicator is selected. Use the symbol search field to add a symbol. From what I have tested, it works for any symbol whether it's stocks, crypto, FX and more. The default is set to stocks.
The Weight field in the settings menu is where you can assign a specific weight to the symbol of your choice. This way you can make an equal weighted index or a custom weighted index. By default each symbol is set to 10 or 10%. There are 10 symbols in the menu, so at 10%, they are equally weighted! In the script I have made it so each weighting is in percentage terms. So type in the percentage and you're good to go.
The chart is currently displayed in a separate window and not as an overlay. This may change in the future. The line can also be changed slightly and the color of it. Stay tuned for more on this.
Send in feedback
I am a Pine rookie in all regards and I am surely looking for support, feedback, and/or ideas. I want to add a lot more to this. If you look at the settings you will see have some input fields that are in their first iteration and currently needing to be improved. Rather than waiting to make them perfect, I just want to get this out there and update as I go. Also, as mentioned, I will definitely need a little support at adding more features that I have in mind.
Credit where credit is due
I used a lot of Open Source indicators as inspiration to quickly get going so thank you to the following people and accounts who share open source scripts that you can use to learn, test, and get started instantly:
@TradingView
@LucF
@PineCoders
@KioseffTrading
@norok
@RedKTrader
@NeoButane
And many others. That's the beauty of open source!
Closing note
Publishing it open source so people can fact check my code and thinking. One thing I know for sure is that this can probably be created in a more efficient way. Nonetheless, please a take look and let me know what you think - I am excited to make some updates over the coming weeks.
Thanks for reading!
Portfolio Index Generator [By MUQWISHI]▋ INTRODUCTION:
The “Portfolio Index Generator” simplifies the process of building a custom portfolio management index, allowing investors to input a list of preferred holdings from global securities and customize the initial investment weight of each security. Furthermore, it includes an option for rebalancing by adjusting the weights of assets to maintain a desired level of asset allocation. The tool serves as a comprehensive approach for tracking portfolio performance, conducting research, and analyzing specific aspects of portfolio investment. The output includes an index value, a table of holdings, and chart plotting, providing a deeper understanding of the portfolio's historical movement.
_______________________
▋ OVERVIEW:
The image can be taken as an example of building a custom portfolio index. I created this index and named it “My Portfolio Performance”, which comprises several global companies and crypto assets.
_______________________
▋ OUTPUTS:
The output can be divided into 4 sections:
1. Portfolio Index Title (Name & Value).
2. Portfolio Specifications.
3. Portfolio Holdings.
4. Portfolio Index Chart.
1. Portfolio Index Title, displays the index name at the top, and at the bottom, it shows the index value, along with the chart timeframe, e.g., daily change in points and percentage.
2. Portfolio Specifications, displays the essential information on portfolio performance, including the investment date range, initial capital, returns, assets, and equity.
3. Portfolio Holdings, a list of the holding securities inside a table that contains the ticker, average entry price, last price, return percentage of the portfolio's initial capital, and customized weighted percentage of the portfolio. Additionally, a tooltip appears when the user passes the cursor over a ticker's cell, showing brief information about the company, such as the company's name, exchange market, country, sector, and industry.
4. Index Chart, display a plot of the historical movement of the index in the form of a bar, candle, or line chart.
_______________________
▋ INDICATOR SETTINGS:
Section(1): Style Settings
(1) Naming the index.
(2) Table location on the chart and cell size.
(3) Sorting Holdings Table. By securities’ {Return(%) Portfolio, Weight(%) Portfolio, or Ticker Alphabetical} order.
(4) Choose the type of index: {Equity or Return (%)}, and the plot type for the index: {Candle, Bar, or Line}.
(5) Positive/Negative colors.
(6) Table Colors (Title, Cell, and Text).
(7) To show/hide any indicator’s components.
Section(2): Performance Settings
(1) Calculation window period: from DateTime to DateTime.
(2) Initial Capital and specifying currency.
(3) Option to enable portfolio rebalancing in {Monthly, Quarterly, or Yearly} intervals.
Section(3): Portfolio Holdings
(1) Enable and count security in the investment portfolio.
(2) Initial weight of security. For example, if the initial capital is $100,000 and the weight of XYZ stock is 4%, the initial value of the shares would be $4,000.
(3) Select and add up to 30 symbols that interested in.
Please let me know if you have any questions.

Jakes Index------------
English
I introduce the community to the Jakes Index. Basically, this is an index containing the top 10 cryptocurrencies, classified according to their Marketcap. The purpose of this index is to show a general market context, without being tied to a single crypto. With an overview of the market, it is easier to identify the market trend, in addition to being an excellent indicator to gauge the performance of your Crypt portfolio. Supply data comes from CoinMarktCap, and price data comes mostly from Binance, however some crypts are not yet available for trading by it, so the prices used come from the first broker indicated by TradingView in the search.
Given that one of the crypts was launched very recently, Internet Computer to be more exact, I decided to leave it out of the index, adding "//" to the code in all references to it. If you want to see the performance of the index with the included cryptography, just delete the bars that follow in front of your code, such parts: "ASSET8; SUPPLY8; PESO8; QOC8; FINM8" after that add "//" in "PESO11" and remove the bars from "PESSO11F", in addition to also removing the F. Do the same with "JAKESINDEX" at the end of the code, and you will have the result with the Internet Computer included.
The calculation of the index takes into account the Marketcap of the crypto, which is divided by the sum of the Marketcap of all the others, and then the result is multiplied by the market value of the Cryptocurrency. Thus, we have an index weighted by Marketcap with the 10 most important cryptocurrencies in the market AT THE TIME. It is important to remember that this index must be updated, both in terms of the currencies that change their place in the ranking with certain frequency, as the Supply that each one has, since coins with active mining, as is the case of Bitcoin, change their Supply frequently.
To keep the index up to date, I will do ONE Monthly update, always posting the code with the new changes.
------------
Português
Apresento a comunidade o Jakes Index. Basicamente, este é um índice contendo as 10 principais criptomoedas, classificadas de acordo com seu Marketcap. O objetivo deste índice é mostrar um contexto geral do mercado, sem ficar preso a uma única cripto. Com um apanhado geral sobre o mercado, fica mais fácil identificar a tendência do mercado, além de ser um excelente indicador para balizar o desempenho da sua carteira de Criptos. Os dados referentes a Supply são advindos do CoinMarktCap, e os dados dos preços vem em sua maioria da Binance, porém algumas criptos ainda não estão disponíveis para negociação pela mesma, portanto os preços utilizados vem da primeira corretora indicada pelo TradingView na busca.
Tendo em vista que uma das criptos foi lançada muito recentemente, a Internet Computer para ser mais exato, decidi deixa-la de fora do índice, adicionando "//" no código em todas as referencias a mesma. Caso queira ver o desempenho do índice com a cripto incluída, basta apagar as barras que seguem na frente de seu código, sendo tais partes: "ASSET8; SUPPLY8; PESO8; QOC8; FINM8" após isso adicione "//" em "PESO11" e remova as barras de "PESSO11F", além de remover também o F. Faça o mesmo com "JAKESINDEX" no fim do código, e terá o resultado com a Internet Computer incluída.
O calculo do índice leva em conta o Marketcap da cripto, que é dividio pela soma do Marketcap de todas as outras, e então o resultado é multiplicado pelo valor a mercado da Criptomoeda. Dessa forma, temos um índice ponderado pelo Marketcap com as 10 Criptomoedas mais importantes do mercado NO MOMENTO. É importante lembrar que este índice deve ser atualizado, tanto em questão das moedas que mudam com certa frequência seu lugar no ranking, como o Supply que cada uma tem, visto que moedas com mineração ativa, como é o caso do Bitcoin, mudam seu Supply com frequência.
Para manter o índice atualizado, farei UMA atualização Mensal, postando sempre o código com as novas alterações.
Dual Custom Index with SpreadDual Custom Index with Spread
Create powerful custom indices from any instruments and analyze their relative strength dynamics
Overview
This advanced indicator allows you to build two completely customizable indices from your choice of instruments and analyze their spread relationship. Perfect for inter-market analysis, sector rotation strategies, currency strength comparisons, and sophisticated relative performance studies.
Key Features
🔧 Fully Customizable Index Construction
Build each index from up to 6 instruments with individual weightings
Enable/disable instruments on the fly without losing settings
Automatic weight validation ensures mathematically accurate calculations
Invert functionality for instruments that move opposite to index strength
📊 Advanced ADX-Based Methodology
Uses sophisticated ADX +DI/-DI directional bias calculations
Normalized bias calculation for consistent scaling across different instruments
Optimized default settings for intraday trading with full customization options
Professional-grade smoothing and filtering options
📈 Dual Analysis Modes
Difference Mode: Shows absolute strength difference (Index1 - Index2)
Ratio Mode: Shows relative performance ratio (Index1 / Index2)
Additional spread smoothing for cleaner signals
🎨 Professional Display Options
Custom labels with full color, size, and positioning control
Dynamic "Follow Line" labels that move with your data
Static corner positioning for reference displays
Clean error messaging and validation feedback
Use Cases
Gold Trading: Create gold strength vs USD strength indices for precise market timing
Sector Analysis: Compare technology vs financial sector strength for rotation strategies
Currency Strength: Build custom currency baskets for advanced forex analysis
Commodity Spreads: Analyze relative strength between different commodity groups
Regional Markets: Compare strength between different geographical market indices
Crypto Analysis: Track relative performance between different cryptocurrency sectors
Technical Specifications
Instruments per Index: Up to 6 with individual enable/disable
Weight Validation: Automatic 100% total weight enforcement
Calculation Method: ADX-based directional bias with trend strength weighting
Smoothing Options: Multiple levels of customizable smoothing
Error Handling: Professional validation with clear user feedback
Optimization Tips
Intraday Trading: Use DI Length 3-7 for faster response
Daily Analysis: Use DI Length 10-14 for smoother signals
Noisy Markets: Increase Final Smoothing for cleaner signals
Trending Markets: Lower smoothing values for faster reaction
Perfect for traders who need sophisticated inter-market analysis tools beyond standard indicators. Whether you're analyzing gold vs dollar dynamics, sector rotation opportunities, or custom currency strength relationships, this indicator provides institutional-grade analysis capabilities with complete customization flexibility.

Plot background depending on Index EMA 10 and EMA 20This indicator gives the user an easy way to check the conditions of the market.
Up market should be good for breakout traders.
Down market should be good for breakdown shortsellers
The others should be good for pullback buyers.
This script automaticlly check which index should be used for the depending on which ticker is view. If no match is found indicator will use IXIC as reference.
The script works for Nordic and US stocks.
"OMXSPI"
"OBX"
"OMXSPI"
"OMXHPI"
"OMXCPI"
"IXIC"
It then alculated the EMA10 and EMA20 for the index and plots the background depending on 6 differnet conditions.
EMA10 below EMA20 and EMA10 and EMA20 is sloping down. //Down market
EMA10 above EMA20 and EMA10 and EMA20 is sloping up. //Up market
EMA10 below EMA20 and EMA10 sloping up and EMA20 is sloping down. //First indication by market to move up
EMA10 above EMA20 and EMA10 sloping down and EMA20 is sloping up. //First indication by market to move down
EMA10 below EMA20 and EMA10 sloping up and EMA20 is sloping up. //Possible MA cross over
EMA10 below EMA20 and EMA10 sloping down and EMA20 is sloping down. //Possible MA cross over

AP Index - Geomagnetic disturbancesDaily AP index back to 2015-01-01.
Geomagnetic disturbances can be monitored by ground-based magnetic observatories recording the three magnetic field components. The global Kp index is obtained as the mean value of the disturbance levels in the two horizontal field components, observed at 13 selected, subauroral stations . The name Kp originates from "planetarische Kennziffer" ( = planetary index).
The three-hour index ap and the daily indices Ap, Cp and C9 are directly related to the Kp index. In order to obtain a linear scale from Kp, J. Bartels gave the following table to derive a three-hour equivalent range, named ap index.
Geomagnetic Ap Index: The daily index Ap is obtained by averaging the eight values of ap for each day.
Based on the data from Helmholtz Centre Potsdam GFZ German Research Centre for Geosciences.

.BXBT IndexThe current .BXBT index weighted as close as possible to BitMEX's with updates as BitMEX refreshes their index.
Difference between this and the script titled '2020 March 27 .BXBT Index': this one will receive updates because it doesn't have a date in its title.
Methodology
www.bitmex.com
"BitMEX Index Weights, assuming no constituent exchanges have been excluded due to Index Protection Rules, last updated 27 December 2019 at 12:00:05 UTC."
Binance: -
Bitstamp: 10.61%
Bittrex: 2.53%
Coinbase: 52.30%
Gemini: 6.89%
Huobi: -
Itbit: 4.21%
Kraken: 23.46%
Poloniex: -
ItBit's weight is combined with Gemini's due to ItBit not being on TradingView as of now. BITTREX:BTCUSD substituted with BITTREX:BTCUSDT*POLONIEX:USDTUSD to backfill because Bittrex only recently (late 2018) started to offer a fiat BTC/USD pair. Not that it matters since the index used in 2018 didn't include Bittrex if I remember correctly.
What is actually used for 27/12/2019 to 27/03/2020:
Binance: -
Bitstamp: 10.61%
Bittrex: 2.53%
Coinbase: 52.30%
Gemini: 11.10%
Huobi: -
Itbit: -
Kraken: 23.46%
Poloniex: -
Options:
Toggle candlesticks or close line
Change price source to be used for indicators
To be added: Change quarter to show indexes for different times, with labels that apply to the appropriate index used
Reasons to use this vs. the index itself: (not many)
It is helpful as a reference for other indicators or creation of an index.

Canadian Dollar Currency IndexCanadian Dollar Currency Index updates in real time and doesn't close like tradingview.com's currency indexes. Based off of the Bank of Canada's CEER methodology and tracks it quite closely, although not perfectly. It seems to be higher than the Bank of Canada's index by 2 points. This could be due to using different data for the currencies and as I am not proficient in PineScript, I don't think I was able to replicate the formula exactly...? Regardless ,it works well and is more than close enough to suit one's purpose of tracking the Canadian dollar against a basket of currencies that are weighted according to the Bank of Canada's total weights (The total weight of a country j in year t is a weighted average of the their import, export and third-market competition weights). For more information on the actual Bank of Canada's index: www.bankofcanada.ca
COT Index by cendalcLegacy and disaggregated COT index for several commodities I trade:
ZC, ZW, ZS, ZL, ZM, HG, GC, SI, CC, KC, CT, OJ, SB, CL, HO, NG
Available indexes:
Commercials Index
Large traders Index
Producers Index
Managed Money Index
Data is taken from Quandl: www.quandl.com
Default week period is 26 except for CC, KC, CT, OJ, SB, CL, HO and NG where it is 13. You can set your own period.
Works correctly on weekly and daily data. Daily length is correctly computed from trade days in weeks.
Displays the previous cot index for the current week if COT report has not yet been published.
Intramarket Difference Index StrategyHi Traders !!
The IDI Strategy:
In layman’s terms this strategy compares two indicators across markets and exploits their differences.
note: it is best the two markets are correlated as then we know we are trading a short to long term deviation from both markets' general trend with the assumption both markets will trend again sometime in the future thereby exhausting our trading opportunity.
📍 Import Notes:
This Strategy calculates trade position size independently (i.e. risk per trade is controlled in the user inputs tab), this means that the ‘Order size’ input in the ‘Properties’ tab will have no effect on the strategy. Why ? because this allows us to define custom position size algorithms which we can use to improve our risk management and equity growth over time. Here we have the option to have fixed quantity or fixed percentage of equity ATR (Average True Range) based stops in addition to the turtle trading position size algorithm.
‘Pyramiding’ does not work for this strategy’, similar to the order size input togeling this input will have no effect on the strategy as the strategy explicitly defines the maximum order size to be 1.
This strategy is not perfect, and as of writing of this post I have not traded this algo.
Always take your time to backtests and debug the strategy.
🔷 The IDI Strategy:
By default this strategy pulls data from your current TV chart and then compares it to the base market, be default BINANCE:BTCUSD . The strategy pulls SMA and RSI data from either market (we call this the difference data), standardizes the data (solving the different unit problem across markets) such that it is comparable and then differentiates the data, calling the result of this transformation and difference the Intramarket Difference (ID). The formula for the the ID is
ID = market1_diff_data - market2_diff_data (1)
Where
market(i)_diff_data = diff_data / ATR(j)_market(i)^0.5,
where i = {1, 2} and j = the natural numbers excluding 0
Formula (1) interpretation is the following
When ID > 0: this means the current market outperforms the base market
When ID = 0: Markets are at long run equilibrium
When ID < 0: this means the current market underperforms the base market
To form the strategy we define one of two strategy type’s which are Trend and Mean Revesion respectively.
🔸 Trend Case:
Given the ‘‘Strategy Type’’ is equal to TREND we define a threshold for which if the ID crosses over we go long and if the ID crosses under the negative of the threshold we go short.
The motivating idea is that the ID is an indicator of the two symbols being out of sync, and given we know volatility clustering, momentum and mean reversion of anomalies to be a stylised fact of financial data we can construct a trading premise. Let's first talk more about this premise.
For some markets (cryptocurrency markets - synthetic symbols in TV) the stylised fact of momentum is true, this means that higher momentum is followed by higher momentum, and given we know momentum to be a vector quantity (with magnitude and direction) this momentum can be both positive and negative i.e. when the ID crosses above some threshold we make an assumption it will continue in that direction for some time before executing back to its long run equilibrium of 0 which is a reasonable assumption to make if the market are correlated. For example for the BTCUSD - ETHUSD pair, if the ID > +threshold (inputs for MA and RSI based ID thresholds are found under the ‘‘INTRAMARKET DIFFERENCE INDEX’’ group’), ETHUSD outperforms BTCUSD, we assume the momentum to continue so we go long ETHUSD.
In the standard case we would exit the market when the IDI returns to its long run equilibrium of 0 (for the positive case the ID may return to 0 because ETH’s difference data may have decreased or BTC’s difference data may have increased). However in this strategy we will not define this as our exit condition, why ?
This is because we want to ‘‘let our winners run’’, to achieve this we define a trailing Donchian Channel stop loss (along with a fixed ATR based stop as our volatility proxy). If we were too use the 0 exit the strategy may print a buy signal (ID > +threshold in the simple case, market regimes may be used), return to 0 and then print another buy signal, and this process can loop may times, this high trade frequency means we fail capture the entire market move lowering our profit, furthermore on lower time frames this high trade frequencies mean we pay more transaction costs (due to price slippage, commission and big-ask spread) which means less profit.
By capturing the sum of many momentum moves we are essentially following the trend hence the trend following strategy type.
Here we also print the IDI (with default strategy settings with the MA difference type), we can see that by letting our winners run we may catch many valid momentum moves, that results in a larger final pnl that if we would otherwise exit based on the equilibrium condition(Valid trades are denoted by solid green and red arrows respectively and all other valid trades which occur within the original signal are light green and red small arrows).
another example...
Note: if you would like to plot the IDI separately copy and paste the following code in a new Pine Script indicator template.
indicator("IDI")
// INTRAMARKET INDEX
var string g_idi = "intramarket diffirence index"
ui_index_1 = input.symbol("BINANCE:BTCUSD", title = "Base market", group = g_idi)
// ui_index_2 = input.symbol("BINANCE:ETHUSD", title = "Quote Market", group = g_idi)
type = input.string("MA", title = "Differrencing Series", options = , group = g_idi)
ui_ma_lkb = input.int(24, title = "lookback of ma and volatility scaling constant", group = g_idi)
ui_rsi_lkb = input.int(14, title = "Lookback of RSI", group = g_idi)
ui_atr_lkb = input.int(300, title = "ATR lookback - Normalising value", group = g_idi)
ui_ma_threshold = input.float(5, title = "Threshold of Upward/Downward Trend (MA)", group = g_idi)
ui_rsi_threshold = input.float(20, title = "Threshold of Upward/Downward Trend (RSI)", group = g_idi)
//>>+----------------------------------------------------------------+}
// CUSTOM FUNCTIONS |
//<<+----------------------------------------------------------------+{
// construct UDT (User defined type) containing the IDI (Intramarket Difference Index) source values
// UDT will hold many variables / functions grouped under the UDT
type functions
float Close // close price
float ma // ma of symbol
float rsi // rsi of the asset
float atr // atr of the asset
// the security data
getUDTdata(symbol, malookback, rsilookback, atrlookback) =>
indexHighTF = barstate.isrealtime ? 1 : 0
= request.security(symbol, timeframe = timeframe.period,
expression = [close , // Instentiate UDT variables
ta.sma(close, malookback) ,
ta.rsi(close, rsilookback) ,
ta.atr(atrlookback) ])
data = functions.new(close_, ma_, rsi_, atr_)
data
// Intramerket Difference Index
idi(type, symbol1, malookback, rsilookback, atrlookback, mathreshold, rsithreshold) =>
threshold = float(na)
index1 = getUDTdata(symbol1, malookback, rsilookback, atrlookback)
index2 = getUDTdata(syminfo.tickerid, malookback, rsilookback, atrlookback)
// declare difference variables for both base and quote symbols, conditional on which difference type is selected
var diffindex1 = 0.0, var diffindex2 = 0.0,
// declare Intramarket Difference Index based on series type, note
// if > 0, index 2 outpreforms index 1, buy index 2 (momentum based) until equalibrium
// if < 0, index 2 underpreforms index 1, sell index 1 (momentum based) until equalibrium
// for idi to be valid both series must be stationary and normalised so both series hae he same scale
intramarket_difference = 0.0
if type == "MA"
threshold := mathreshold
diffindex1 := (index1.Close - index1.ma) / math.pow(index1.atr*malookback, 0.5)
diffindex2 := (index2.Close - index2.ma) / math.pow(index2.atr*malookback, 0.5)
intramarket_difference := diffindex2 - diffindex1
else if type == "RSI"
threshold := rsilookback
diffindex1 := index1.rsi
diffindex2 := index2.rsi
intramarket_difference := diffindex2 - diffindex1
//>>+----------------------------------------------------------------+}
// STRATEGY FUNCTIONS CALLS |
//<<+----------------------------------------------------------------+{
// plot the intramarket difference
= idi(type,
ui_index_1,
ui_ma_lkb,
ui_rsi_lkb,
ui_atr_lkb,
ui_ma_threshold,
ui_rsi_threshold)
//>>+----------------------------------------------------------------+}
plot(intramarket_difference, color = color.orange)
hline(type == "MA" ? ui_ma_threshold : ui_rsi_threshold, color = color.green)
hline(type == "MA" ? -ui_ma_threshold : -ui_rsi_threshold, color = color.red)
hline(0)
Note it is possible that after printing a buy the strategy then prints many sell signals before returning to a buy, which again has the same implication (less profit. Potentially because we exit early only for price to continue upwards hence missing the larger "trend"). The image below showcases this cenario and again, by allowing our winner to run we may capture more profit (theoretically).
This should be clear...
🔸 Mean Reversion Case:
We stated prior that mean reversion of anomalies is an standerdies fact of financial data, how can we exploit this ?
We exploit this by normalizing the ID by applying the Ehlers fisher transformation. The transformed data is then assumed to be approximately normally distributed. To form the strategy we employ the same logic as for the z score, if the FT normalized ID > 2.5 (< -2.5) we buy (short). Our exit conditions remain unchanged (fixed ATR stop and trailing Donchian Trailing stop)
🔷 Position Sizing:
If ‘‘Fixed Risk From Initial Balance’’ is toggled true this means we risk a fixed percentage of our initial balance, if false we risk a fixed percentage of our equity (current balance).
Note we also employ a volatility adjusted position sizing formula, the turtle training method which is defined as follows.
Turtle position size = (1/ r * ATR * DV) * C
Where,
r = risk factor coefficient (default is 20)
ATR(j) = risk proxy, over j times steps
DV = Dollar Volatility, where DV = (1/Asset Price) * Capital at Risk
🔷 Risk Management:
Correct money management means we can limit risk and increase reward (theoretically). Here we employ
Max loss and gain per day
Max loss per trade
Max number of consecutive losing trades until trade skip
To read more see the tooltips (info circle).
🔷 Take Profit:
By defualt the script uses a Donchain Channel as a trailing stop and take profit, In addition to this the script defines a fixed ATR stop losses (by defualt, this covers cases where the DC range may be to wide making a fixed ATR stop usefull), ATR take profits however are defined but optional.
ATR SL and TP defined for all trades
🔷 Hurst Regime (Regime Filter):
The Hurst Exponent (H) aims to segment the market into three different states, Trending (H > 0.5), Random Geometric Brownian Motion (H = 0.5) and Mean Reverting / Contrarian (H < 0.5). In my interpretation this can be used as a trend filter that eliminates market noise.
We utilize the trending and mean reverting based states, as extra conditions required for valid trades for both strategy types respectively, in the process increasing our trade entry quality.
🔷 Example model Architecture:
Here is an example of one configuration of this strategy, combining all aspects discussed in this post.
Future Updates
- Automation integration (next update)

Ticker vs IndexI was exploring a simple idea how I can visualize the ticker performance against the underlying Index (or any other ticker) performance.
how it works:
When the line is moving up (blue zone), the ticker is performing better than the underlying index (e.g. SPX)(configurable).
When the line is moving down (red zone), the ticker is performing worse than the underlying index.
How to use it:
Use as confirmation always in conjunction with other (main) indicators, avoid "buy" when indicator is in the red zone
Also, crossing over the zero line is often an indication for an upcoming upward move
Try to different SMA length - default is 20 but 10 was often showing better results
(No financial advise, for testing purposes only)
world stage indexThis is an indicator that expresses the ratio of "stage1" and "stage4" of world index.
40 symbols are as follows
(JAPAN, US, EUROPE, and CANADA)
OSE:NK2251!, DJ:DJI, NASDAQ:IXIC, SP:SPX, XETR:DAX, TVC:CAC40, TVC:UKX, TSX:TSX
(ASIA)
TVC:SHCOMP, SZSE:399001, TVC:HSI, TWSE:TAIEX, BSE:SENSEX, OANDA:SG30SGD, INDEX:KSI, SET:SET
(EUROPE)
INDEX:SX5E, INDEX:FTSEMIB, SIX:SMI, BME:IBC, EURONEXT:BEL20, TVC:AEX, OMXCOP:OMXC25, XETR:0Q5X
(Pacific Ocean)
ASX:XJO, TVC:NZ50G, IDX:COMPOSITE, FTSEMYX:FBMKLCI, BMFBOVESPA:IBOV, BMV:ME, BVL:SPBLPGPT, BYMA:IMV
(Eastern Europe & Middle East)
MOEX:IMOEX, GPW:WIG20, OMXHEX:OMXH25, OMXSTO:OMXS30, DFM:DFMGI, TADAWUL:TASI, OSE:GNRI, EGX:EGX30
The criteria are as follows:
EMA5≧EMA20≧EMA40 : Stage1
EMA5≦EMA20≦EMA40 : Stage4
A.The sum of Stage1 was multiplied by 2.5 and drawn on a scale of 0 to 100, with yellow area
B.The Sum of Stage4 was multiplied by 2.5 and drawn on a scale of 0 to 100, with blue area.
C. The ratio of A/B was multiplied by 2.5 and drawn on a scale of 0 to 100, with red lines.
This idea is from Kojirou Kousi.
40 symbols of this script are partially different from Kojiro kousi's idea.
But he said the difference isn't matter.
「小次郎講師指数」に着想を得た、世界40カ国の株価指数stage状態です。
参考文献は、小次郎講師著書「世界一わかりやすい投資の勝ち方」です。
小次郎講師とは一部異なるシンボルを採用していますが、
多少の違いは余り大した問題では無いと御本人から教わった事があります。
先進国に関してはおそらくほとんど同じだと思います。
stage1の合計の%を黄色、stage4の合計の%を青色、stage1の合計/stage4の合計の%を赤で表示しています。
雰囲気で分かればいいので、正確な数字までは表示しませんでした。
個人的には現状分析以外にも、プラクティス時に世界情勢を把握するのに重宝しています。

Custom IndexEnables users to create their own custom Stock Index with up to 29 tickers! Has included optionality to include/exclude certain sectors, plot sectors individually and measure in gold. Good for having a look at how your favorite tickers have performed (with your modification of course). Also has option to show Moving Averages for your convenience.
