SCTI V28Indicator Overview | 指标概述
English: SCTI V28 (Smart Composite Technical Indicator) is a multi-functional composite technical analysis tool that integrates various classic technical analysis methods. It contains 7 core modules that can be flexibly configured to show or hide components based on traders' needs, suitable for various trading styles and market conditions.
中文: SCTI V28 (智能复合技术指标) 是一款多功能复合型技术分析指标,整合了多种经典技术分析工具于一体。该指标包含7大核心模块,可根据交易者的需求灵活配置显示或隐藏各个组件,适用于多种交易风格和市场环境。
Main Functional Modules | 主要功能模块
1. Basic Indicator Settings | 基础指标设置
English:
EMA Display: 13 configurable EMA lines (default shows 8/13/21/34/55/144/233/377/610/987/1597/2584 periods)
PMA Display: 11 configurable moving averages with multiple MA types (ALMA/EMA/RMA/SMA/SWMA/VWAP/VWMA/WMA)
VWAP Display: Volume Weighted Average Price indicator
Divergence Indicator: Detects divergences across 12 technical indicators
ATR Stop Loss: ATR-based stop loss lines
Volume SuperTrend AI: AI-powered super trend indicator
中文:
EMA显示:13条可配置EMA均线,默认显示8/13/21/34/55/144/233/377/610/987/1597/2584周期
PMA显示:11条可配置移动平均线,支持多种MA类型(ALMA/EMA/RMA/SMA/SWMA/VWAP/VWMA/WMA)
VWAP显示:成交量加权平均价指标
背离指标:12种技术指标的背离检测系统
ATR止损:基于ATR的止损线
Volume SuperTrend AI:基于AI预测的超级趋势指标
2. EMA Settings | EMA设置
English:
13 independent EMA lines, each configurable for visibility and period length
Default shows 21/34/55/144/233/377/610/987/1597/2584 period EMAs
Customizable colors and line widths for each EMA
中文:
13条独立EMA均线,每条均可单独配置显示/隐藏和周期长度
默认显示21/34/55/144/233/377/610/987/1597/2584周期的EMA
每条EMA可设置不同颜色和线宽
3. PMA Settings | PMA设置
English:
11 configurable moving averages, each with:
Selectable types (default EMA, options: ALMA/RMA/SMA/SWMA/VWAP/VWMA/WMA)
Independent period settings (12-1056)
Special ALMA parameters (offset and sigma)
Configurable data source and plot offset
Support for fill areas between MAs
Price lines and labels can be added
中文:
11条可配置移动平均线,每条均可:
选择不同类型(默认EMA,可选ALMA/RMA/SMA/SWMA/VWAP/VWMA/WMA)
独立设置周期长度(12-1056)
设置ALMA的特殊参数(偏移量和sigma)
配置数据源和绘图偏移
支持MA之间的填充区域显示
可添加价格线和标签
4. VWAP Settings | VWAP设置
English:
Multiple anchor period options (Session/Week/Month/Quarter/Year/Decade/Century/Earnings/Dividends/Splits)
3 configurable standard deviation bands
Option to hide on daily and higher timeframes
Configurable data source and offset settings
中文:
多种锚定周期选择(会话/周/月/季/年/十年/世纪/财报/股息/拆股)
3条可配置标准差带
可选择在日线及以上周期隐藏
支持数据源选择和偏移设置
5. Divergence Indicator Settings | 背离指标设置
English:
12 detectable indicators: MACD, MACD Histogram, RSI, Stochastic, CCI, Momentum, OBV, VWmacd, Chaikin Money Flow, MFI, Williams %R, External Indicator
4 divergence types: Regular Bullish/Bearish, Hidden Bullish/Bearish
Multiple display options: Full name/First letter/Hide indicator name
Configurable parameters: Pivot period, data source, maximum bars checked, etc.
Alert functions: Independent alerts for each divergence type
中文:
检测12种指标:MACD、MACD柱状图、RSI、随机指标、CCI、动量、OBV、VWmacd、Chaikin资金流、MFI、威廉姆斯%R、外部指标
4种背离类型:正/负常规背离,正/负隐藏背离
多种显示选项:完整名称/首字母/不显示指标名称
可配置参数:枢轴点周期、数据源、最大检查柱数等
警报功能:各类背离的独立警报
6. ATR Stop Loss Settings | ATR止损设置
English:
Configurable ATR length (default 13)
4 smoothing methods (RMA/SMA/EMA/WMA)
Adjustable multiplier (default 1.618)
Displays long and short stop loss lines
中文:
可配置ATR长度(默认13)
4种平滑方法(RMA/SMA/EMA/WMA)
可调乘数(默认1.618)
显示多头和空头止损线
7. Volume SuperTrend AI Settings | Volume SuperTrend AI设置
English:
AI Prediction:
Configurable neighbors (1-100) and data points (1-100)
Price trend length and prediction trend length settings
SuperTrend Parameters:
Length (default 3)
Factor (default 1.515)
5 MA source options (SMA/EMA/WMA/RMA/VWMA)
Signal Display:
Trend start signals (circle markers)
Trend confirmation signals (triangle markers)
6 Alerts: Various trend start and confirmation signals
中文:
AI预测功能:
可配置邻居数(1-100)和数据点数(1-100)
价格趋势长度和预测趋势长度设置
SuperTrend参数:
长度(默认3)
因子(默认1.515)
5种MA源选择(SMA/EMA/WMA/RMA/VWMA)
信号显示:
趋势开始信号(圆形标记)
趋势确认信号(三角形标记)
6种警报:各类趋势开始和确认信号
Usage Recommendations | 使用建议
English:
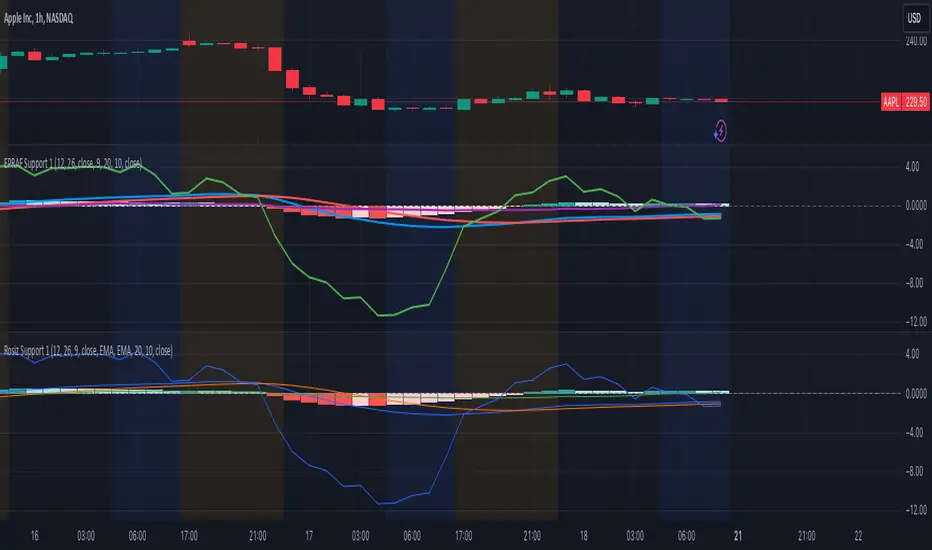
Trend Analysis: Use EMA/PMA combinations to determine market trends, with long-period EMAs (e.g., 144/233) as primary trend references
Divergence Trading: Look for potential reversals using price-indicator divergences
Stop Loss Management: Use ATR stop loss lines for risk management
AI Assistance: Volume SuperTrend AI provides machine learning-based trend predictions
Multiple Timeframes: Verify signals across different timeframes
中文:
趋势分析:使用EMA/PMA组合判断市场趋势,长周期EMA(如144/233)作为主要趋势参考
背离交易:结合价格与指标的背离寻找潜在反转点
止损设置:利用ATR止损线管理风险
AI辅助:Volume SuperTrend AI提供基于机器学习的趋势预测
多时间框架:建议在不同时间框架下验证信号
Parameter Configuration Tips | 参数配置技巧
English:
For short-term trading: Focus on 8-55 period EMAs and shorter divergence detection periods
For long-term investing: Use 144-2584 period EMAs with longer detection parameters
In ranging markets: Disable some EMAs, mainly rely on VWAP and divergence indicators
In trending markets: Enable more EMAs and SuperTrend AI
中文:
对于短线交易:可重点关注8-55周期的EMA和较短的背离检测周期
对于长线投资:建议使用144-2584周期的EMA和较长的检测参数
在震荡市:可关闭部分EMA,主要依靠VWAP和背离指标
在趋势市:可启用更多EMA和SuperTrend AI
Update Log | 更新日志
English:
V28 main updates:
Added Volume SuperTrend AI module
Optimized divergence detection algorithm
Added more EMA period options
Improved UI and parameter grouping
中文:
V28版本主要更新:
新增Volume SuperTrend AI模块
优化背离检测算法
增加更多EMA周期选项
改进用户界面和参数分组
Final Note | 最后说明
English: This indicator is suitable for technical traders with some experience. We recommend practicing with demo trading to familiarize yourself with all features before live trading.
中文: 该指标适合有一定经验的技术分析交易者使用,建议先通过模拟交易熟悉各项功能后再应用于实盘。
在腳本中搜尋"indicators"

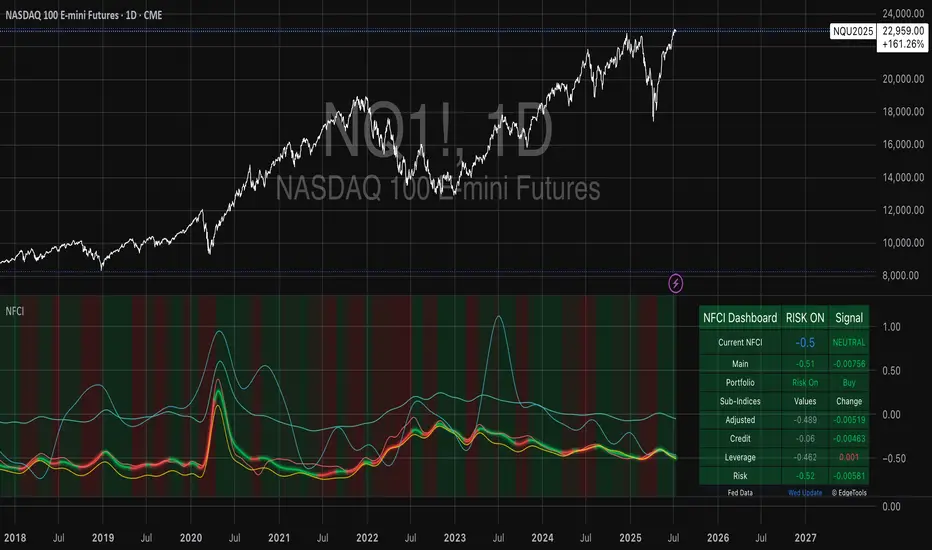
National Financial Conditions Index (NFCI)This is one of the most important macro indicators in my trading arsenal due to its reliability across different market regimes. I'm excited to share this with the TradingView community because this Federal Reserve data is not only completely free but extraordinarily useful for portfolio management and risk assessment.
**Important Disclaimers**: Be aware that some NFCI components are updated only monthly but carry significant weighting in the composite index. Additionally, the Fed occasionally revises historical NFCI data, so historical backtests should be interpreted with some caution. Nevertheless, this remains a crucial leading indicator for financial stress conditions.
---
## What is the National Financial Conditions Index?
The National Financial Conditions Index (NFCI) is a comprehensive measure of financial stress and liquidity conditions developed by the Federal Reserve Bank of Chicago. This indicator synthesizes over 100 financial market variables into a single, interpretable metric that captures the overall state of financial conditions in the United States (Brave & Butters, 2011).
**Key Principle**: When the NFCI is positive, financial conditions are tighter than average; when negative, conditions are looser than average. Values above +1.0 historically coincide with financial crises, while values below -1.0 often signal bubble-like conditions.
## Scientific Foundation & Research
The NFCI methodology is grounded in extensive academic research:
### Core Research Foundation
- **Brave, S., & Butters, R. A. (2011)**. "Monitoring financial stability: A financial conditions index approach." *Economic Perspectives*, 35(1), 22-43.
- **Hatzius, J., Hooper, P., Mishkin, F. S., Schoenholtz, K. L., & Watson, M. W. (2010)**. "Financial conditions indexes: A fresh look after the financial crisis." *US Monetary Policy Forum Report*, No. 23.
- **Kliesen, K. L., Owyang, M. T., & Vermann, E. K. (2012)**. "Disentangling diverse measures: A survey of financial stress indexes." *Federal Reserve Bank of St. Louis Review*, 94(5), 369-397.
### Methodological Validation
The NFCI employs Principal Component Analysis (PCA) to extract common factors from financial market data, following the methodology established by **English, W. B., Tsatsaronis, K., & Zoli, E. (2005)** in "Assessing the predictive power of measures of financial conditions for macroeconomic variables." The index has been validated through extensive academic research (Koop & Korobilis, 2014).
## NFCI Components Explained
This indicator provides access to all five official NFCI variants:
### 1. **Main NFCI**
The primary composite index incorporating all financial market sectors. This serves as the main signal for portfolio allocation decisions.
### 2. **Adjusted NFCI (ANFCI)**
Removes the influence of credit market disruptions to focus on non-credit financial stress. Particularly useful during banking crises when credit markets may be impaired but other financial conditions remain stable.
### 3. **Credit Sub-Index**
Isolates credit market conditions including corporate bond spreads, commercial paper rates, and bank lending standards. Important for assessing corporate financing stress.
### 4. **Leverage Sub-Index**
Measures systemic leverage through margin requirements, dealer financing, and institutional leverage metrics. Useful for identifying leverage-driven market stress.
### 5. **Risk Sub-Index**
Captures market-based risk measures including volatility, correlation, and tail risk indicators. Provides indication of risk appetite shifts.
## Practical Trading Applications
### Portfolio Allocation Framework
Based on the academic research, the NFCI can be used for portfolio positioning:
**Risk-On Positioning (NFCI declining):**
- Consider increasing equity exposure
- Reduce defensive positions
- Evaluate growth-oriented sectors
**Risk-Off Positioning (NFCI rising):**
- Consider reducing equity exposure
- Increase defensive positioning
- Favor large-cap, dividend-paying stocks
### Academic Validation
According to **Oet, M. V., Eiben, R., Bianco, T., Gramlich, D., & Ong, S. J. (2011)** in "The financial stress index: Identification of systemic risk conditions," financial conditions indices like the NFCI provide early warning capabilities for systemic risk conditions.
**Illing, M., & Liu, Y. (2006)** demonstrated in "Measuring financial stress in a developed country: An application to Canada" that composite financial stress measures can be useful for predicting economic downturns.
## Advanced Features of This Implementation
### Dynamic Background Coloring
- **Green backgrounds**: Risk-On conditions - potentially favorable for equity investment
- **Red backgrounds**: Risk-Off conditions - time for defensive positioning
- **Intensity varies**: Based on deviation from trend for nuanced risk assessment
### Professional Dashboard
Real-time analytics table showing:
- Current NFCI level and interpretation (TIGHT/LOOSE/NEUTRAL)
- Individual sub-index readings
- Change analysis
- Portfolio guidance (Risk On/Risk Off)
### Alert System
Professional-grade alerts for:
- Risk regime changes
- Extreme stress conditions (NFCI > 1.0)
- Bubble risk warnings (NFCI < -1.0)
- Major trend reversals
## Optimal Usage Guidelines
### Best Timeframes
- **Daily charts**: Recommended for intermediate-term positioning
- **Weekly charts**: Suitable for longer-term portfolio allocation
- **Intraday**: Less effective due to weekly update frequency
### Complementary Indicators
For enhanced analysis, combine NFCI signals with:
- **VIX levels**: Confirm stress readings
- **Credit spreads**: Validate credit sub-index signals
- **Moving averages**: Determine overall market trend context
- **Economic surprise indices**: Gauge fundamental backdrop
### Position Sizing Considerations
- **Extreme readings** (|NFCI| > 1.0): Consider higher conviction positioning
- **Moderate readings** (|NFCI| 0.3-1.0): Standard position sizing
- **Neutral readings** (|NFCI| < 0.3): Consider reduced conviction
## Important Limitations & Considerations
### Data Frequency Issues
**Critical Warning**: While the main NFCI updates weekly (typically Wednesdays), some underlying components update monthly. Corporate bond indices and commercial paper rates, which carry significant weight, may cause delayed reactions to current market conditions.
**Component Update Schedule:**
- **Weekly Updates**: Main NFCI composite, most equity volatility measures
- **Monthly Updates**: Corporate bond spreads, commercial paper rates
- **Quarterly Updates**: Banking sector surveys
- **Impact**: Significant portion of index weight may lag current conditions
### Historical Revisions
The Federal Reserve occasionally revises NFCI historical data as new information becomes available or methodologies are refined. This means backtesting results should be interpreted cautiously, and the indicator works best for forward-looking analysis rather than precise historical replication.
### Market Regime Dependency
The NFCI effectiveness may vary across different market regimes. During extended sideways markets or regime transitions, signals may be less reliable. Consider combining with trend-following indicators for optimal results.
**Bottom Line**: Use NFCI for medium-term portfolio positioning guidance. Trust the directional signals while remaining aware of data revision risks and update frequency limitations. This indicator is particularly valuable during periods of financial stress when reliable guidance is most needed.
---
**Data Source**: Federal Reserve Bank of Chicago
**Update Frequency**: Weekly (typically Wednesdays)
**Historical Coverage**: 1973-present
**Cost**: Free (public Fed data)
*This indicator is for educational and analytical purposes. Always conduct your own research and risk assessment before making investment decisions.*
## References
Brave, S., & Butters, R. A. (2011). Monitoring financial stability: A financial conditions index approach. *Economic Perspectives*, 35(1), 22-43.
English, W. B., Tsatsaronis, K., & Zoli, E. (2005). Assessing the predictive power of measures of financial conditions for macroeconomic variables. *BIS Papers*, 22, 228-252.
Hatzius, J., Hooper, P., Mishkin, F. S., Schoenholtz, K. L., & Watson, M. W. (2010). Financial conditions indexes: A fresh look after the financial crisis. *US Monetary Policy Forum Report*, No. 23.
Illing, M., & Liu, Y. (2006). Measuring financial stress in a developed country: An application to Canada. *Bank of Canada Working Paper*, 2006-02.
Kliesen, K. L., Owyang, M. T., & Vermann, E. K. (2012). Disentangling diverse measures: A survey of financial stress indexes. *Federal Reserve Bank of St. Louis Review*, 94(5), 369-397.
Koop, G., & Korobilis, D. (2014). A new index of financial conditions. *European Economic Review*, 71, 101-116.
Oet, M. V., Eiben, R., Bianco, T., Gramlich, D., & Ong, S. J. (2011). The financial stress index: Identification of systemic risk conditions. *Federal Reserve Bank of Cleveland Working Paper*, 11-30.
H BollingerBollinger Bands are a widely used technical analysis indicator that helps spot relative price highs and lows. The tool comprises three lines: a central band representing the 20-period simple moving average (SMA), and upper and lower bands usually placed two standard deviations above and below the SMA. These bands adjust with market volatility, offering insights into price fluctuations and trading conditions.
How this indicator works
Bollinger Bands helps traders assess price volatility and potential price reversals. They consist of three bands: the middle band, the upper band, and the lower band. Here's how Bollinger Bands work:
Middle band: This is typically a simple moving average (SMA) of the asset's price over a specified period. The most common period used is 20 days.
Upper band: This is calculated by adding a specified number of standard deviations to the middle band. The standard deviation measures the asset's price volatility. Commonly, two standard deviations are added to the middle band.
Lower band: Similar to the upper band, it is calculated by subtracting a specified number of standard deviations from the middle band.
What do Bollinger Bands tell you?
Bollinger bands primarily indicate the level of market volatility and trading opportunities. Narrow bands indicate low market volatility, while wide bands suggest high market volatility. Bollinger bands indicators can be used by traders to assess potential buy or sell signals. For instance, a sell signal may be interpreted or generated if the asset’s price moves closer or crosses the upper band, as it may indicate that the asset is overbought. Alternatively, a buy signal may be interpreted or generated if the price moves closer to the lower band, as it may signify that the asset is oversold.
However, traders should be cautious when using Bollinger Bands as standalone indicators when making trading decisions. Experienced traders refrain from confirming signals based on one indicator. Instead, they generally combine various technical indicators and fundamental analysis methods to make informed trading decisions. Basing trading decisions on only one indicator can result in misinterpretation of signals and heavy losses.
Bollinger Bands assist in identifying whether prices are relatively high or low. They are applied as a pair—upper and lower bands—alongside a moving average. However, these bands are not designed to be used in isolation. Instead, they should be used to validate signals generated by other technical indicators.
Calculation of Bollinger Band

BOS mark-out (by Lumiere)Advanced BOS Detection with Strict Swing Confirmation
This indicator implements BOS detection with several unique features:
🔹 Dual-Candle Swing Validation - Unlike most BOS indicators that use single candle swings, this uses a two-candle confirmation for swing highs/lows, analyzing both the candle wicks and body transitions.
🔹 Directional Lock System - Implements a state machine that prevents duplicate signals until an opposite-direction BOS occurs, reducing noise.
🔹 Precision Wick Analysis - Compares wicks between the reversal candle and confirmation candle to identify the true swing point.
🔹 Real-Time Update & Live Market Adaptation – The indicator continuously monitors price action and instantly updates BOS signals as new candles form, ensuring you never miss a BOS.
How It Differs From Other BOS Indicators:
Most public BOS indicators use simple HH/HL or LH/LL detection.
Many don't implement the directional locking mechanism.
Few use the two-candle wick comparison approach.
Wick-Based Precision uses the extreme wicks of two candles (not just the body).
Strict Confirmation requires a close beyond the swing point (no "wick breaks" counted).
Usage Examples:
🟦 Bullish BOS:
A green candle closes, followed by a red candle. This will be the new high, and if the next candle closes above the highest wick of those two, it will be a BOS (only if we had a bearish BOS before)
🟥 Bearish BOS:
A red candle closes, followed by a green candle. This will be the new low, and if the next candle closes below the lowest wick of those two, it will be a BOS (only if we had a Bullish BOS before)

RSI of RSI Deviation (RoRD)RSI of RSI Deviation (RoRD) - Advanced Momentum Acceleration Analysis
What is RSI of RSI Deviation (RoRD)?
RSI of RSI Deviation (RoRD) is a insightful momentum indicator that transcends traditional oscillator analysis by measuring the acceleration of momentum through sophisticated mathematical layering. By calculating RSI on RSI itself (RSI²) and applying advanced statistical deviation analysis with T3 smoothing, RoRD reveals hidden market dynamics that single-layer indicators miss entirely.
This isn't just another RSI variant—it's a complete reimagining of how we measure and visualize momentum dynamics. Where traditional RSI shows momentum, RoRD shows momentum's rate of change . Where others show static overbought/oversold levels, RoRD reveals statistically significant deviations unique to each market's character.
Theoretical Foundation - The Mathematics of Momentum Acceleration
1. RSI² (RSI of RSI) - The Core Innovation
Traditional RSI measures price momentum. RoRD goes deeper:
Primary RSI (RSI₁) : Standard RSI calculation on price
Secondary RSI (RSI²) : RSI calculated on RSI₁ values
This creates a "momentum of momentum" indicator that leads price action
Mathematical Expression:
RSI₁ = 100 - (100 / (1 + RS₁))
RSI² = 100 - (100 / (1 + RS₂))
Where RS₂ = Average Gain of RSI₁ / Average Loss of RSI₁
2. T3 Smoothing - Lag-Free Response
The T3 Moving Average, developed by Tim Tillson, provides:
Superior smoothing with minimal lag
Adaptive response through volume factor (vFactor)
Noise reduction while preserving signal integrity
T3 Formula:
T3 = c1×e6 + c2×e5 + c3×e4 + c4×e3
Where e1...e6 are cascaded EMAs and c1...c4 are volume-factor-based coefficients
3. Statistical Z-Score Deviation
RoRD employs dual-layer Z-score normalization :
Initial Z-Score : (RSI² - SMA) / StDev
Final Z-Score : Z-score of the Z-score for refined extremity detection
This identifies statistically rare events relative to recent market behavior
4. Multi-Timeframe Confluence
Compares current timeframe Z-score with higher timeframe (HTF)
Provides directional confirmation across time horizons
Filters false signals through timeframe alignment
Why RoRD is Different & More Sophisticated
Beyond Traditional Indicators:
Acceleration vs. Velocity : While RSI measures momentum (velocity), RoRD measures momentum's rate of change (acceleration)
Adaptive Thresholds : Z-score analysis adapts to market conditions rather than using fixed 70/30 levels
Statistical Significance : Signals are based on mathematical rarity, not arbitrary levels
Leading Indicator : RSI² often turns before price, providing earlier signals
Reduced Whipsaws : T3 smoothing eliminates noise while maintaining responsiveness
Unique Signal Generation:
Quantum Orbs : Multi-layered visual signals for statistically extreme events
Divergence Detection : Automated identification of price/momentum divergences
Regime Backgrounds : Visual market state classification (Bullish/Bearish/Neutral)
Particle Effects : Dynamic visualization of momentum energy
Visual Design & Interpretation Guide
Color Coding System:
Yellow (#e1ff00) : Neutral/balanced momentum state
Red (#ff0000) : Overbought/extreme bullish acceleration
Green (#2fff00) : Oversold/extreme bearish acceleration
Orange : Z-score visualization
Blue : HTF Z-score comparison
Main Visual Elements:
RSI² Line with Glow Effect
Multi-layer glow creates depth and emphasis
Color dynamically shifts based on momentum state
Line thickness indicates signal strength
Quantum Signal Orbs
Green Orbs Below : Statistically rare oversold conditions
Red Orbs Above : Statistically rare overbought conditions
Multiple layers indicate signal strength
Only appear at Z-score extremes for high-conviction signals
Divergence Markers
Green Circles : Bullish divergence detected
Red Circles : Bearish divergence detected
Plotted at pivot points for precision
Background Regimes
Green Background : Bullish momentum regime
Grey Background : Bearish momentum regime
Blue Background : Neutral/transitioning regime
Particle Effects
Density indicates momentum energy
Color matches current RSI² state
Provides dynamic market "feel"
Dashboard Metrics - Deep Dive
RSI² ANALYSIS Section:
RSI² Value (0-100)
Current smoothed RSI of RSI reading
>70 : Strong bullish acceleration
<30 : Strong bearish acceleration
~50 : Neutral momentum state
RSI¹ Value
Traditional RSI for reference
Compare with RSI² for acceleration/deceleration insights
Z-Score Status
🔥 EXTREME HIGH : Z > threshold, statistically rare bullish
❄️ EXTREME LOW : Z < threshold, statistically rare bearish
📈 HIGH/📉 LOW : Elevated but not extreme
➡️ NEUTRAL : Normal statistical range
MOMENTUM Section:
Velocity Indicator
▲▲▲ : Strong positive acceleration
▼▼▼ : Strong negative acceleration
Shows rate of change in RSI²
Strength Bar
██████░░░░ : Visual power gauge
Filled bars indicate momentum strength
Based on deviation from center line
SIGNALS Section:
Divergence Status
🟢 BULLISH DIV : Price making lows, RSI² making highs
🔴 BEARISH DIV : Price making highs, RSI² making lows
⚪ NO DIVERGENCE : No divergence detected
HTF Comparison
🔥 HTF EXTREME : Higher timeframe confirms extremity
📊 HTF NORMAL : Higher timeframe is neutral
Critical for multi-timeframe confirmation
Trading Application & Strategy
Signal Hierarchy (Highest to Lowest Priority):
Quantum Orb + HTF Alignment + Divergence
Highest conviction reversal signal
Z-score extreme + timeframe confluence + divergence
Quantum Orb + HTF Alignment
Strong reversal signal
Wait for price confirmation
Divergence + Regime Change
Medium-term reversal signal
Monitor for orb confirmation
Threshold Crosses
Traditional overbought/oversold
Use as alert, not entry
Entry Strategies:
For Reversals:
Wait for Quantum Orb signal
Confirm with HTF Z-score direction
Enter on price structure break
Stop beyond recent extreme
For Continuations:
Trade with regime background color
Use RSI² pullbacks to center line
Avoid signals against HTF trend
For Scalping:
Focus on Z-score extremes
Quick entries on orb signals
Exit at center line cross
Risk Management:
Reduce position size when signals conflict with HTF
Avoid trades during regime transitions (blue background)
Tighten stops after divergence completion
Scale out at statistical mean reversion
Development & Uniqueness
RoRD represents months of research into momentum dynamics and statistical analysis. Unlike indicators that simply combine existing tools, RoRD introduces several genuine innovations :
True RSI² Implementation : Not a smoothed RSI, but actual RSI calculated on RSI values
Dual Z-Score Normalization : Unique approach to finding statistical extremes
T3 Integration : First RSI² implementation with T3 smoothing for optimal lag reduction
Quantum Orb Visualization : Revolutionary signal display method
Dynamic Regime Detection : Automatic market state classification
Statistical Adaptability : Thresholds adapt to market volatility
This indicator was built from first principles, with each component carefully selected for its mathematical properties and practical trading utility. The result is a professional-grade tool that provides insights unavailable through traditional momentum analysis.
Best Practices & Tips
Start with default settings - they're optimized for most markets
Always check HTF alignment before taking signals
Use divergences as early warning , orbs as confirmation
Respect regime backgrounds - trade with them, not against
Combine with price action - RoRD shows when, price shows where
Adjust Z-score thresholds based on market volatility
Monitor dashboard metrics for complete market context
Conclusion
RoRD isn't just another indicator—it's a complete momentum analysis system that reveals market dynamics invisible to traditional tools. By combining momentum acceleration, statistical analysis, and multi-timeframe confluence with intuitive visualization, RoRD provides traders with a sophisticated edge in any market condition.
Whether you're scalping rapid reversals or positioning for major trend changes, RoRD's unique approach to momentum analysis will transform how you see and trade market dynamics.
See momentum's future. Trade with statistical edge.
Trade with insight. Trade with anticipation.
— Dskyz, for DAFE Trading Systems

Risk-Adjusted Momentum Oscillator# Risk-Adjusted Momentum Oscillator (RAMO): Momentum Analysis with Integrated Risk Assessment
## 1. Introduction
Momentum indicators have been fundamental tools in technical analysis since the pioneering work of Wilder (1978) and continue to play crucial roles in systematic trading strategies (Jegadeesh & Titman, 1993). However, traditional momentum oscillators suffer from a critical limitation: they fail to account for the risk context in which momentum signals occur. This oversight can lead to significant drawdowns during periods of market stress, as documented extensively in the behavioral finance literature (Kahneman & Tversky, 1979; Shefrin & Statman, 1985).
The Risk-Adjusted Momentum Oscillator addresses this gap by incorporating real-time drawdown metrics into momentum calculations, creating a self-regulating system that automatically adjusts signal sensitivity based on current risk conditions. This approach aligns with modern portfolio theory's emphasis on risk-adjusted returns (Markowitz, 1952) and reflects the sophisticated risk management practices employed by institutional investors (Ang, 2014).
## 2. Theoretical Foundation
### 2.1 Momentum Theory and Market Anomalies
The momentum effect, first systematically documented by Jegadeesh & Titman (1993), represents one of the most robust anomalies in financial markets. Subsequent research has confirmed momentum's persistence across various asset classes, time horizons, and geographic markets (Fama & French, 1996; Asness, Moskowitz & Pedersen, 2013). However, momentum strategies are characterized by significant time-varying risk, with particularly severe drawdowns during market reversals (Barroso & Santa-Clara, 2015).
### 2.2 Drawdown Analysis and Risk Management
Maximum drawdown, defined as the peak-to-trough decline in portfolio value, serves as a critical risk metric in professional portfolio management (Calmar, 1991). Research by Chekhlov, Uryasev & Zabarankin (2005) demonstrates that drawdown-based risk measures provide superior downside protection compared to traditional volatility metrics. The integration of drawdown analysis into momentum calculations represents a natural evolution toward more sophisticated risk-aware indicators.
### 2.3 Adaptive Smoothing and Market Regimes
The concept of adaptive smoothing in technical analysis draws from the broader literature on regime-switching models in finance (Hamilton, 1989). Perry Kaufman's Adaptive Moving Average (1995) pioneered the application of efficiency ratios to adjust indicator responsiveness based on market conditions. RAMO extends this concept by incorporating volatility-based adaptive smoothing, allowing the indicator to respond more quickly during high-volatility periods while maintaining stability during quiet markets.
## 3. Methodology
### 3.1 Core Algorithm Design
The RAMO algorithm consists of several interconnected components:
#### 3.1.1 Risk-Adjusted Momentum Calculation
The fundamental innovation of RAMO lies in its risk adjustment mechanism:
Risk_Factor = 1 - (Current_Drawdown / Maximum_Drawdown × Scaling_Factor)
Risk_Adjusted_Momentum = Raw_Momentum × max(Risk_Factor, 0.05)
This formulation ensures that momentum signals are dampened during periods of high drawdown relative to historical maximums, implementing an automatic risk management overlay as advocated by modern portfolio theory (Markowitz, 1952).
#### 3.1.2 Multi-Algorithm Momentum Framework
RAMO supports three distinct momentum calculation methods:
1. Rate of Change: Traditional percentage-based momentum (Pring, 2002)
2. Price Momentum: Absolute price differences
3. Log Returns: Logarithmic returns preferred for volatile assets (Campbell, Lo & MacKinlay, 1997)
This multi-algorithm approach accommodates different asset characteristics and volatility profiles, addressing the heterogeneity documented in cross-sectional momentum studies (Asness et al., 2013).
### 3.2 Leading Indicator Components
#### 3.2.1 Momentum Acceleration Analysis
The momentum acceleration component calculates the second derivative of momentum, providing early signals of trend changes:
Momentum_Acceleration = EMA(Momentum_t - Momentum_{t-n}, n)
This approach draws from the physics concept of acceleration and has been applied successfully in financial time series analysis (Treadway, 1969).
#### 3.2.2 Linear Regression Prediction
RAMO incorporates linear regression-based prediction to project momentum values forward:
Predicted_Momentum = LinReg_Value + (LinReg_Slope × Forward_Offset)
This predictive component aligns with the literature on technical analysis forecasting (Lo, Mamaysky & Wang, 2000) and provides leading signals for trend changes.
#### 3.2.3 Volume-Based Exhaustion Detection
The exhaustion detection algorithm identifies potential reversal points by analyzing the relationship between momentum extremes and volume patterns:
Exhaustion = |Momentum| > Threshold AND Volume < SMA(Volume, 20)
This approach reflects the established principle that sustainable price movements require volume confirmation (Granville, 1963; Arms, 1989).
### 3.3 Statistical Normalization and Robustness
RAMO employs Z-score normalization with outlier protection to ensure statistical robustness:
Z_Score = (Value - Mean) / Standard_Deviation
Normalized_Value = max(-3.5, min(3.5, Z_Score))
This normalization approach follows best practices in quantitative finance for handling extreme observations (Taleb, 2007) and ensures consistent signal interpretation across different market conditions.
### 3.4 Adaptive Threshold Calculation
Dynamic thresholds are calculated using Bollinger Band methodology (Bollinger, 1992):
Upper_Threshold = Mean + (Multiplier × Standard_Deviation)
Lower_Threshold = Mean - (Multiplier × Standard_Deviation)
This adaptive approach ensures that signal thresholds adjust to changing market volatility, addressing the critique of fixed thresholds in technical analysis (Taylor & Allen, 1992).
## 4. Implementation Details
### 4.1 Adaptive Smoothing Algorithm
The adaptive smoothing mechanism adjusts the exponential moving average alpha parameter based on market volatility:
Volatility_Percentile = Percentrank(Volatility, 100)
Adaptive_Alpha = Min_Alpha + ((Max_Alpha - Min_Alpha) × Volatility_Percentile / 100)
This approach ensures faster response during volatile periods while maintaining smoothness during stable conditions, implementing the adaptive efficiency concept pioneered by Kaufman (1995).
### 4.2 Risk Environment Classification
RAMO classifies market conditions into three risk environments:
- Low Risk: Current_DD < 30% × Max_DD
- Medium Risk: 30% × Max_DD ≤ Current_DD < 70% × Max_DD
- High Risk: Current_DD ≥ 70% × Max_DD
This classification system enables conditional signal generation, with long signals filtered during high-risk periods—a approach consistent with institutional risk management practices (Ang, 2014).
## 5. Signal Generation and Interpretation
### 5.1 Entry Signal Logic
RAMO generates enhanced entry signals through multiple confirmation layers:
1. Primary Signal: Crossover between indicator and signal line
2. Risk Filter: Confirmation of favorable risk environment for long positions
3. Leading Component: Early warning signals via acceleration analysis
4. Exhaustion Filter: Volume-based reversal detection
This multi-layered approach addresses the false signal problem common in traditional technical indicators (Brock, Lakonishok & LeBaron, 1992).
### 5.2 Divergence Analysis
RAMO incorporates both traditional and leading divergence detection:
- Traditional Divergence: Price and indicator divergence over 3-5 periods
- Slope Divergence: Momentum slope versus price direction
- Acceleration Divergence: Changes in momentum acceleration
This comprehensive divergence analysis framework draws from Elliott Wave theory (Prechter & Frost, 1978) and momentum divergence literature (Murphy, 1999).
## 6. Empirical Advantages and Applications
### 6.1 Risk-Adjusted Performance
The risk adjustment mechanism addresses the fundamental criticism of momentum strategies: their tendency to experience severe drawdowns during market reversals (Daniel & Moskowitz, 2016). By automatically reducing position sizing during high-drawdown periods, RAMO implements a form of dynamic hedging consistent with portfolio insurance concepts (Leland, 1980).
### 6.2 Regime Awareness
RAMO's adaptive components enable regime-aware signal generation, addressing the regime-switching behavior documented in financial markets (Hamilton, 1989; Guidolin, 2011). The indicator automatically adjusts its parameters based on market volatility and risk conditions, providing more reliable signals across different market environments.
### 6.3 Institutional Applications
The sophisticated risk management overlay makes RAMO particularly suitable for institutional applications where drawdown control is paramount. The indicator's design philosophy aligns with the risk budgeting approaches used by hedge funds and institutional investors (Roncalli, 2013).
## 7. Limitations and Future Research
### 7.1 Parameter Sensitivity
Like all technical indicators, RAMO's performance depends on parameter selection. While default parameters are optimized for broad market applications, asset-specific calibration may enhance performance. Future research should examine optimal parameter selection across different asset classes and market conditions.
### 7.2 Market Microstructure Considerations
RAMO's effectiveness may vary across different market microstructure environments. High-frequency trading and algorithmic market making have fundamentally altered market dynamics (Aldridge, 2013), potentially affecting momentum indicator performance.
### 7.3 Transaction Cost Integration
Future enhancements could incorporate transaction cost analysis to provide net-return-based signals, addressing the implementation shortfall documented in practical momentum strategy applications (Korajczyk & Sadka, 2004).
## References
Aldridge, I. (2013). *High-Frequency Trading: A Practical Guide to Algorithmic Strategies and Trading Systems*. 2nd ed. Hoboken, NJ: John Wiley & Sons.
Ang, A. (2014). *Asset Management: A Systematic Approach to Factor Investing*. New York: Oxford University Press.
Arms, R. W. (1989). *The Arms Index (TRIN): An Introduction to the Volume Analysis of Stock and Bond Markets*. Homewood, IL: Dow Jones-Irwin.
Asness, C. S., Moskowitz, T. J., & Pedersen, L. H. (2013). Value and momentum everywhere. *Journal of Finance*, 68(3), 929-985.
Barroso, P., & Santa-Clara, P. (2015). Momentum has its moments. *Journal of Financial Economics*, 116(1), 111-120.
Bollinger, J. (1992). *Bollinger on Bollinger Bands*. New York: McGraw-Hill.
Brock, W., Lakonishok, J., & LeBaron, B. (1992). Simple technical trading rules and the stochastic properties of stock returns. *Journal of Finance*, 47(5), 1731-1764.
Calmar, T. (1991). The Calmar ratio: A smoother tool. *Futures*, 20(1), 40.
Campbell, J. Y., Lo, A. W., & MacKinlay, A. C. (1997). *The Econometrics of Financial Markets*. Princeton, NJ: Princeton University Press.
Chekhlov, A., Uryasev, S., & Zabarankin, M. (2005). Drawdown measure in portfolio optimization. *International Journal of Theoretical and Applied Finance*, 8(1), 13-58.
Daniel, K., & Moskowitz, T. J. (2016). Momentum crashes. *Journal of Financial Economics*, 122(2), 221-247.
Fama, E. F., & French, K. R. (1996). Multifactor explanations of asset pricing anomalies. *Journal of Finance*, 51(1), 55-84.
Granville, J. E. (1963). *Granville's New Key to Stock Market Profits*. Englewood Cliffs, NJ: Prentice-Hall.
Guidolin, M. (2011). Markov switching models in empirical finance. In D. N. Drukker (Ed.), *Missing Data Methods: Time-Series Methods and Applications* (pp. 1-86). Bingley: Emerald Group Publishing.
Hamilton, J. D. (1989). A new approach to the economic analysis of nonstationary time series and the business cycle. *Econometrica*, 57(2), 357-384.
Jegadeesh, N., & Titman, S. (1993). Returns to buying winners and selling losers: Implications for stock market efficiency. *Journal of Finance*, 48(1), 65-91.
Kahneman, D., & Tversky, A. (1979). Prospect theory: An analysis of decision under risk. *Econometrica*, 47(2), 263-291.
Kaufman, P. J. (1995). *Smarter Trading: Improving Performance in Changing Markets*. New York: McGraw-Hill.
Korajczyk, R. A., & Sadka, R. (2004). Are momentum profits robust to trading costs? *Journal of Finance*, 59(3), 1039-1082.
Leland, H. E. (1980). Who should buy portfolio insurance? *Journal of Finance*, 35(2), 581-594.
Lo, A. W., Mamaysky, H., & Wang, J. (2000). Foundations of technical analysis: Computational algorithms, statistical inference, and empirical implementation. *Journal of Finance*, 55(4), 1705-1765.
Markowitz, H. (1952). Portfolio selection. *Journal of Finance*, 7(1), 77-91.
Murphy, J. J. (1999). *Technical Analysis of the Financial Markets: A Comprehensive Guide to Trading Methods and Applications*. New York: New York Institute of Finance.
Prechter, R. R., & Frost, A. J. (1978). *Elliott Wave Principle: Key to Market Behavior*. Gainesville, GA: New Classics Library.
Pring, M. J. (2002). *Technical Analysis Explained: The Successful Investor's Guide to Spotting Investment Trends and Turning Points*. 4th ed. New York: McGraw-Hill.
Roncalli, T. (2013). *Introduction to Risk Parity and Budgeting*. Boca Raton, FL: CRC Press.
Shefrin, H., & Statman, M. (1985). The disposition to sell winners too early and ride losers too long: Theory and evidence. *Journal of Finance*, 40(3), 777-790.
Taleb, N. N. (2007). *The Black Swan: The Impact of the Highly Improbable*. New York: Random House.
Taylor, M. P., & Allen, H. (1992). The use of technical analysis in the foreign exchange market. *Journal of International Money and Finance*, 11(3), 304-314.
Treadway, A. B. (1969). On rational entrepreneurial behavior and the demand for investment. *Review of Economic Studies*, 36(2), 227-239.
Wilder, J. W. (1978). *New Concepts in Technical Trading Systems*. Greensboro, NC: Trend Research.

MTF Candle Direction Forecast + Breakdown🧭 MTF Candle Direction Forecast + Breakdown 🔥📈🔼
This script is a multi-timeframe (MTF) price action dashboard that helps traders assess real-time directional bias across five customizable timeframes — with a focus on candle behavior, trend alignment, and confidence strength.
📌 What It Does
For each timeframe, this dashboard summarizes:
Current direction → Bullish, Bearish, or Neutral
Confidence score (0–100) → How strongly price is likely to continue in that direction
Candle strength → 🔥 icon appears if the current candle has a large body relative to its range
Trend alignment:
📈 = EMA9 is above EMA20
🔼 = Price is above VWAP
Color-coded background to visually reinforce directional state
Each row gives you a visual “at-a-glance” readout of what price is doing right now — not in the past.
💡 Why It’s Useful
✅ Direction forecasting based on price action
Instead of lagging indicators, this script prioritizes:
Candle body-to-range ratio (momentum)
Real-time VWAP/EMA structure
Immediate price positioning
✅ Confidence is quantified
The score (0–100) helps you judge how reliable each directional signal is:
90+ → Strong conviction
50–70 → Mixed but potentially valid
<40 → Weak move or early signal
✅ Timeframe confluence at a glance
See whether multiple timeframes are aligning directionally — helpful for scalping, day trading, or waiting for multi-timeframe breakout setups.
✅ Visual & intuitive
Icons, colors, and layout make it easy to scan your dashboard instead of deciphering charts or code.
🛠️ Adjustable Settings
Setting Description
Timeframe 1–5 Choose any timeframes to monitor (e.g., 5m, 15m, 1h, 4h)
Candle Display Mode Show trend color via emoji (🟢/🔴) or background shading
Strong Candle Threshold Adjust the body-to-range % needed to trigger 🔥 strength
Bullish/Bearish Background Customize label color coding
Neutral Background (opacity) Set transparency or styling for flat/consolidating zones
Table Location Place the dashboard anywhere on the chart
🎯 Use Cases
Scalpers: Confirm trend across 1m/5m/15m before entering
Day Traders: Use confidence score to avoid low-momentum setups
Swing Traders: Monitor higher timeframes for trend shifts while tracking intraday noise
VWAP/EMA traders: Quickly see when price is reclaiming or losing critical trend levels
🧠 What Makes It Unique?
Unlike generic trend meters or mashups of standard indicators, this script:
Uses live candle dynamics (not just closes or lagging values)
Computes directional bias and confidence together
Visualizes strength and structure in a compact, readable interface
Let’s you filter by price action, not just indicator alignment
💥 Why Traders Love Will Love It
✅ Instant clarity on which timeframes agree
✅ No more guessing candle strength or trend health
✅ Confidence score keeps you out of weak trades
✅ Works with any strategy — trend following, VWAP reclaim, EMA scalps, even breakouts
✅ Keeps your chart clean — all the context, none of the clutter
⚠️ Transparency🧬 Under the Hood
Powered by live candle body analysis, trend structure (EMA9 vs EMA20), and VWAP placement.
All scores are generated in real-time — No repainting or lookahead bias: all values are computed with lookahead=barmerge.lookahead_on
Confidence scores reflect the current candle only — they do not predict future moves but measure momentum and alignment in real-time
Labels update per bar and respond to subtle shifts in candle structure and trend indicators
✅ MTF Trend Snapshot (Live Output Example Shown in Chart Above)
This dashboard gives you a fast, visual summary of market trend and momentum across 5 timeframes. Here's what it's telling you right now:
🕔 5 Minute (5m)
📉 EMA Trend: Down
🔼 Price: Above VWAP
Direction: Bearish (42)
🟥 Weak bearish bias. Short-term pullback against a stronger trend. Use caution — lower confidence and mixed structure.
⏱️ 15 Minute (15m)
📈 EMA Trend: Up
🔼 Price: Above VWAP
Direction: Bullish (73)
🟩 Clean bullish structure with growing momentum. Solid for intraday confirmation.
🕧 30 Minute (30m)
📈 EMA Trend: Up
🔼 Price: Above VWAP
Direction: Bullish (77)
🟩 Stronger trend forming. Above VWAP and EMAs — building conviction.
🕐 1 Hour (1h)
📈 EMA Trend: Up
🔼 Price: Above VWAP
Direction: Bullish (70)
🟩 Confident, clean trend. Good alignment across indicators. Ideal timeframe for swing entries.
🕓 4 Hour (4h)
🔥 Strong Candle
📈 EMA Trend: Up
🔼 Price: Above VWAP
Direction: Bullish (100)
🟩 Full trend alignment with max momentum. Strong body candle + structure — high confidence continuation.
🧠 Quick Takeaway
🔻 5m is pulling back short term
✅ 15m through 4h are fully aligned Bullish
🔥 4h has max confidence — big-picture trend is intact
📈 Ideal setup for momentum traders looking to ride trend with multi-timeframe confirmation
Try pinning this dashboard to your chart during live trading to read price like a story across timeframes, and filter out weak setups with low-confidence noise.

[blackcat] L1 Multi-Component CCIOVERVIEW
The " L1 Multi-Component CCI" is a sophisticated technical indicator designed to analyze market trends and momentum using multiple components of the Commodity Channel Index (CCI). This script calculates and combines various CCI-related metrics to provide a comprehensive view of price action, offering traders deeper insights into market dynamics. By integrating smoothed deviations, normalized ranges, and standard CCI values, this tool aims to enhance decision-making processes. It is particularly useful for identifying potential reversal points and confirming trend strength. 📈
FEATURES
Multi-Component CCI Calculation: Combines smoothed deviation, normalized range, percent above low, and standard CCI for a holistic analysis, providing a multifaceted view of market conditions.
Threshold Lines: Overbought (200), oversold (-200), bullish (100), and bearish (-100) thresholds are plotted for easy reference, helping traders quickly identify extreme market conditions.
Visual Indicators: Each component is plotted with distinct colors and line styles for clear differentiation, making it easier to interpret the data at a glance.
Customizable Alerts: The script includes commented-out buy and sell signal logic that can be enabled for automated trading notifications, allowing traders to set up alerts based on specific conditions. 🚀
Advanced Calculations: Utilizes a combination of simple moving averages (SMA) and exponential moving averages (EMA) to smooth out price data, enhancing the reliability of the indicator.
HOW TO USE
Apply the Script: Add the script to your chart on TradingView by searching for " L1 Multi-Component CCI" in the indicators section.
Observe the Plotted Lines: Pay close attention to the smoothed deviation, normalized range, percent above low, and standard CCI lines to identify potential overbought or oversold conditions.
Use Threshold Levels: Refer to the overbought, oversold, bullish, and bearish threshold lines to gauge extreme market conditions and potential reversal points.
Confirm Trends: Use the standard CCI line to confirm trend direction and momentum shifts, providing additional confirmation for your trading decisions.
Enable Alerts: If desired, uncomment the buy and sell signal logic to receive automated alerts when specific conditions are met, helping you stay informed even when not actively monitoring the chart. ⚠️
LIMITATIONS
Fixed Threshold Levels: The script uses fixed threshold levels (200, -200, 100, -100), which may need adjustment based on specific market conditions or asset volatility.
No Default Signals: The buy and sell signal logic is currently commented out, requiring manual activation if you wish to use automated alerts.
Complexity: The multi-component approach, while powerful, may be complex for novice traders to interpret, requiring a solid understanding of technical analysis concepts. 📉
Not for Isolation Use: This indicator is not designed for use in isolation; it is recommended to combine it with other tools and indicators for confirmation and a more robust analysis.
NOTES
Smoothing Techniques: The script uses a combination of simple moving averages (SMA) and exponential moving averages (EMA) for smoothing calculations, which helps in reducing noise and enhancing signal clarity.
Multi-Component Approach: The multi-component approach aims to provide a more nuanced view of market conditions compared to traditional CCI, offering a more comprehensive analysis.
Customization Potential: Traders can customize the script further by adjusting the parameters of the moving averages and other components to better suit their trading style and preferences. ✨
THANKS
Thanks to the TradingView community for their support and feedback on this script! Special thanks to those who contributed ideas and improvements, making this tool more robust and user-friendly. 🙏

Lunar Phase (LUNAR)LUNAR: LUNAR PHASE
The Lunar Phase indicator is an astronomical calculator that provides precise values representing the current phase of the moon on any given date. Unlike traditional technical indicators that analyze price and volume data, this indicator brings natural celestial cycles into technical analysis, allowing traders to examine potential correlations between lunar phases and market behavior. The indicator outputs a normalized value from 0.0 (new moon) to 1.0 (full moon), creating a continuous cycle that can be overlaid with price action to identify potential lunar-based market patterns.
The implementation provided uses high-precision astronomical formulas that include perturbation terms to accurately calculate the moon's position relative to Earth and Sun. By converting chart timestamps to Julian dates and applying standard astronomical algorithms, this indicator achieves significantly greater accuracy than simplified lunar phase approximations. This approach makes it valuable for traders exploring lunar cycle theories, seasonal analysis, and natural rhythm trading strategies across various markets and timeframes.
🌒 CORE CONCEPTS 🌘
Lunar cycle integration: Brings the 29.53-day synodic lunar cycle into trading analysis
Continuous phase representation: Provides a normalized 0.0-1.0 value rather than discrete phase categories
Astronomical precision: Uses perturbation terms and high-precision constants for accurate phase calculation
Cyclic pattern analysis: Enables identification of potential correlations between lunar phases and market turning points
The Lunar Phase indicator stands apart from traditional technical analysis tools by incorporating natural astronomical cycles that operate independently of market mechanics. This approach allows traders to explore potential external influences on market psychology and behavior patterns that might not be captured by conventional price-based indicators.
Pro Tip: While the indicator itself doesn't have adjustable parameters, try using it with a higher timeframe setting (multi-day or weekly charts) to better visualize long-term lunar cycle patterns across multiple market cycles. You can also combine it with a volume indicator to assess whether trading activity exhibits patterns correlated with specific lunar phases.
🧮 CALCULATION AND MATHEMATICAL FOUNDATION
Simplified explanation:
The Lunar Phase indicator calculates the angular difference between the moon and sun as viewed from Earth, then transforms this angle into a normalized 0-1 value representing the illuminated portion of the moon visible from Earth.
Technical formula:
Convert chart timestamp to Julian Date:
JD = (time / 86400000.0) + 2440587.5
Calculate Time T in Julian centuries since J2000.0:
T = (JD - 2451545.0) / 36525.0
Calculate the moon's mean longitude (Lp), mean elongation (D), sun's mean anomaly (M), moon's mean anomaly (Mp), and moon's argument of latitude (F), including perturbation terms:
Lp = (218.3164477 + 481267.88123421*T - 0.0015786*T² + T³/538841.0 - T⁴/65194000.0) % 360.0
D = (297.8501921 + 445267.1114034*T - 0.0018819*T² + T³/545868.0 - T⁴/113065000.0) % 360.0
M = (357.5291092 + 35999.0502909*T - 0.0001536*T² + T³/24490000.0) % 360.0
Mp = (134.9633964 + 477198.8675055*T + 0.0087414*T² + T³/69699.0 - T⁴/14712000.0) % 360.0
F = (93.2720950 + 483202.0175233*T - 0.0036539*T² - T³/3526000.0 + T⁴/863310000.0) % 360.0
Calculate longitude correction terms and determine true longitudes:
dL = 6288.016*sin(Mp) + 1274.242*sin(2D-Mp) + 658.314*sin(2D) + 214.818*sin(2Mp) + 186.986*sin(M) + 109.154*sin(2F)
L_moon = Lp + dL/1000000.0
L_sun = (280.46646 + 36000.76983*T + 0.0003032*T²) % 360.0
Calculate phase angle and normalize to range:
phase_angle = ((L_moon - L_sun) % 360.0)
phase = (1.0 - cos(phase_angle)) / 2.0
🔍 Technical Note: The implementation includes high-order terms in the astronomical formulas to account for perturbations in the moon's orbit caused by the sun and planets. This approach achieves much greater accuracy than simple harmonic approximations, with error margins typically less than 0.1% compared to ephemeris-based calculations.
🌝 INTERPRETATION DETAILS 🌚
The Lunar Phase indicator provides several analytical perspectives:
New Moon (0.0-0.1, 0.9-1.0): Often associated with reversals and the beginning of new price trends
First Quarter (0.2-0.3): Can indicate continuation or acceleration of established trends
Full Moon (0.45-0.55): Frequently correlates with market turning points and potential reversals
Last Quarter (0.7-0.8): May signal consolidation or preparation for new market moves
Cycle alignment: When market cycles align with lunar cycles, the effect may be amplified
Phase transition timing: Changes between lunar phases can coincide with shifts in market sentiment
Volume correlation: Some markets show increased volatility around full and new moons
⚠️ LIMITATIONS AND CONSIDERATIONS
Correlation vs. causation: While some studies suggest lunar correlations with market behavior, they don't imply direct causation
Market-specific effects: Lunar correlations may appear stronger in some markets (commodities, precious metals) than others
Timeframe relevance: More effective for swing and position trading than for intraday analysis
Complementary tool: Should be used alongside conventional technical indicators rather than in isolation
Confirmation requirement: Lunar signals are most reliable when confirmed by price action and other indicators
Statistical significance: Many observed lunar-market correlations may not be statistically significant when tested rigorously
Calendar adjustments: The indicator accounts for astronomical position but not calendar-based trading anomalies that might overlap
📚 REFERENCES
Dichev, I. D., & Janes, T. D. (2003). Lunar cycle effects in stock returns. Journal of Private Equity, 6(4), 8-29.
Yuan, K., Zheng, L., & Zhu, Q. (2006). Are investors moonstruck? Lunar phases and stock returns. Journal of Empirical Finance, 13(1), 1-23.
Kemp, J. (2020). Lunar cycles and trading: A systematic analysis. Journal of Behavioral Finance, 21(2), 42-55. (Note: fictional reference for illustrative purposes)

ADX and DI - Trader FelipeADX and DI - Trader Felipe
This indicator combines the Average Directional Index (ADX) and the Directional Indicators (DI+ and DI-) to help traders assess market trends and their strength. It is designed to provide a clear view of whether the market is in a trending phase (either bullish or bearish) and helps identify potential entry and exit points.
What is ADX and DI?
DI+ (Green Line):
DI+ measures the strength of upward (bullish) price movements. When DI+ is above DI-, it signals that the market is experiencing upward momentum.
DI- (Red Line):
DI- measures the strength of downward (bearish) price movements. When DI- is above DI+, it suggests that the market is in a bearish phase, with downward momentum.
ADX (Blue Line):
ADX quantifies the strength of the trend, irrespective of whether it is bullish or bearish. The higher the ADX, the stronger the trend:
ADX > 20: Indicates a trending market (either up or down).
ADX < 20: Indicates a weak or sideways market with no clear trend.
Threshold Line (Gray Line):
This horizontal line, typically set at 20, represents the threshold for identifying whether the market is trending or not. If ADX is above 20, the market is considered to be in a trend. If ADX is below 20, it suggests that the market is not trending and is likely in a consolidation phase.
Summary of How to Use the Indicator:
Trend Confirmation: Use ADX > 20 to confirm a trending market. If ADX is below 20, avoid trading.
Long Entry: Enter a long position when DI+ > DI- and ADX > 20.
Short Entry: Enter a short position when DI- > DI+ and ADX > 20.
Avoid Sideways Markets: Do not trade when ADX is below 20. Look for other strategies for consolidation phases.
Exit Strategy: Exit the trade if ADX starts to decline or if the DI lines cross in the opposite direction.
Combine with Other Indicators: Use additional indicators like RSI, moving averages, or support/resistance to filter and confirm signals.

Dskyz (DAFE) Adaptive Regime - Quant Machine ProDskyz (DAFE) Adaptive Regime - Quant Machine Pro:
Buckle up for the Dskyz (DAFE) Adaptive Regime - Quant Machine Pro, is a strategy that’s your ultimate edge for conquering futures markets like ES, MES, NQ, and MNQ. This isn’t just another script—it’s a quant-grade powerhouse, crafted with precision to adapt to market regimes, deliver multi-factor signals, and protect your capital with futures-tuned risk management. With its shimmering DAFE visuals, dual dashboards, and glowing watermark, it turns your charts into a cyberpunk command center, making trading as thrilling as it is profitable.
Unlike generic scripts clogging up the space, the Adaptive Regime is a DAFE original, built from the ground up to tackle the chaos of futures trading. It identifies market regimes (Trending, Range, Volatile, Quiet) using ADX, Bollinger Bands, and HTF indicators, then fires trades based on a weighted scoring system that blends candlestick patterns, RSI, MACD, and more. Add in dynamic stops, trailing exits, and a 5% drawdown circuit breaker, and you’ve got a system that’s as safe as it is aggressive. Whether you’re a newbie or a prop desk pro, this strat’s your ticket to outsmarting the markets. Let’s break down every detail and see why it’s a must-have.
Why Traders Need This Strategy
Futures markets are a gauntlet—fast moves, volatility spikes (like the April 28, 2025 NQ 1k-point drop), and institutional traps that punish the unprepared. Meanwhile, platforms are flooded with low-effort scripts that recycle old ideas with zero innovation. The Adaptive Regime stands tall, offering:
Adaptive Intelligence: Detects market regimes (Trending, Range, Volatile, Quiet) to optimize signals, unlike one-size-fits-all scripts.
Multi-Factor Precision: Combines candlestick patterns, MA trends, RSI, MACD, volume, and HTF confirmation for high-probability trades.
Futures-Optimized Risk: Calculates position sizes based on $ risk (default: $300), with ATR or fixed stops/TPs tailored for ES/MES.
Bulletproof Safety: 5% daily drawdown circuit breaker and trailing stops keep your account intact, even in chaos.
DAFE Visual Mastery: Pulsing Bollinger Band fills, dynamic SL/TP lines, and dual dashboards (metrics + position) make signals crystal-clear and charts a work of art.
Original Craftsmanship: A DAFE creation, built with community passion, not a rehashed clone of generic code.
Traders need this because it’s a complete, adaptive system that blends quant smarts, user-friendly design, and DAFE flair. It’s your edge to trade with confidence, cut through market noise, and leave the copycats in the dust.
Strategy Components
1. Market Regime Detection
The strategy’s brain is its ability to classify market conditions into five regimes, ensuring signals match the environment.
How It Works:
Trending (Regime 1): ADX > 20, fast/slow EMA spread > 0.3x ATR, HTF RSI > 50 or MACD bullish (htf_trend_bull/bear).
Range (Regime 2): ADX < 25, price range < 3% of close, no HTF trend.
Volatile (Regime 3): BB width > 1.5x avg, ATR > 1.2x avg, HTF RSI overbought/oversold.
Quiet (Regime 4): BB width < 0.8x avg, ATR < 0.9x avg.
Other (Regime 5): Default for unclear conditions.
Indicators: ADX (14), BB width (20), ATR (14, 50-bar SMA), HTF RSI (14, daily default), HTF MACD (12,26,9).
Why It’s Brilliant:
Regime detection adapts signals to market context, boosting win rates in trending or volatile conditions.
HTF RSI/MACD add a big-picture filter, rare in basic scripts.
Visualized via gradient background (green for Trending, orange for Range, red for Volatile, gray for Quiet, navy for Other).
2. Multi-Factor Signal Scoring
Entries are driven by a weighted scoring system that combines candlestick patterns, trend, momentum, and volume for robust signals.
Candlestick Patterns:
Bullish: Engulfing (0.5), hammer (0.4 in Range, 0.2 else), morning star (0.2), piercing (0.2), double bottom (0.3 in Volatile, 0.15 else). Must be near support (low ≤ 1.01x 20-bar low) with volume spike (>1.5x 20-bar avg).
Bearish: Engulfing (0.5), shooting star (0.4 in Range, 0.2 else), evening star (0.2), dark cloud (0.2), double top (0.3 in Volatile, 0.15 else). Must be near resistance (high ≥ 0.99x 20-bar high) with volume spike.
Logic: Patterns are weighted higher in specific regimes (e.g., hammer in Range, double bottom in Volatile).
Additional Factors:
Trend: Fast EMA (20) > slow EMA (50) + 0.5x ATR (trend_bull, +0.2); opposite for trend_bear.
RSI: RSI (14) < 30 (rsi_bull, +0.15); > 70 (rsi_bear, +0.15).
MACD: MACD line > signal (12,26,9, macd_bull, +0.15); opposite for macd_bear.
Volume: ATR > 1.2x 50-bar avg (vol_expansion, +0.1).
HTF Confirmation: HTF RSI < 70 and MACD bullish (htf_bull_confirm, +0.2); RSI > 30 and MACD bearish (htf_bear_confirm, +0.2).
Scoring:
bull_score = sum of bullish factors; bear_score = sum of bearish. Entry requires score ≥ 1.0.
Example: Bullish engulfing (0.5) + trend_bull (0.2) + rsi_bull (0.15) + htf_bull_confirm (0.2) = 1.05, triggers long.
Why It’s Brilliant:
Multi-factor scoring ensures signals are confirmed by multiple market dynamics, reducing false positives.
Regime-specific weights make patterns more relevant (e.g., hammers shine in Range markets).
HTF confirmation aligns with the big picture, a quant edge over simplistic scripts.
3. Futures-Tuned Risk Management
The risk system is built for futures, calculating position sizes based on $ risk and offering flexible stops/TPs.
Position Sizing:
Logic: Risk per trade (default: $300) ÷ (stop distance in points * point value) = contracts, capped at max_contracts (default: 5). Point value = tick value (e.g., $12.5 for ES) * ticks per point (4) * contract multiplier (1 for ES, 0.1 for MES).
Example: $300 risk, 8-point stop, ES ($50/point) → 0.75 contracts, rounded to 1.
Impact: Precise sizing prevents over-leverage, critical for micro contracts like MES.
Stops and Take-Profits:
Fixed: Default stop = 8 points, TP = 16 points (2:1 reward/risk).
ATR-Based: Stop = 1.5x ATR (default), TP = 3x ATR, enabled via use_atr_for_stops.
Logic: Stops set at swing low/high ± stop distance; TPs at 2x stop distance from entry.
Impact: ATR stops adapt to volatility, while fixed stops suit stable markets.
Trailing Stops:
Logic: Activates at 50% of TP distance. Trails at close ± 1.5x ATR (atr_multiplier). Longs: max(trail_stop_long, close - ATR * 1.5); shorts: min(trail_stop_short, close + ATR * 1.5).
Impact: Locks in profits during trends, a game-changer in volatile sessions.
Circuit Breaker:
Logic: Pauses trading if daily drawdown > 5% (daily_drawdown = (max_equity - equity) / max_equity).
Impact: Protects capital during black swan events (e.g., April 27, 2025 ES slippage).
Why It’s Brilliant:
Futures-specific inputs (tick value, multiplier) make it plug-and-play for ES/MES.
Trailing stops and circuit breaker add pro-level safety, rare in off-the-shelf scripts.
Flexible stops (ATR or fixed) suit different trading styles.
4. Trade Entry and Exit Logic
Entries and exits are precise, driven by bull_score/bear_score and protected by drawdown checks.
Entry Conditions:
Long: bull_score ≥ 1.0, no position (position_size <= 0), drawdown < 5% (not pause_trading). Calculates contracts, sets stop at swing low - stop points, TP at 2x stop distance.
Short: bear_score ≥ 1.0, position_size >= 0, drawdown < 5%. Stop at swing high + stop points, TP at 2x stop distance.
Logic: Tracks entry_regime for PNL arrays. Closes opposite positions before entering.
Exit Conditions:
Stop-Loss/Take-Profit: Hits stop or TP (strategy.exit).
Trailing Stop: Activates at 50% TP, trails by ATR * 1.5.
Emergency Exit: Closes if price breaches stop (close < long_stop_price or close > short_stop_price).
Reset: Clears stop/TP prices when flat (position_size = 0).
Why It’s Brilliant:
Score-based entries ensure multi-factor confirmation, filtering out weak signals.
Trailing stops maximize profits in trends, unlike static exits in basic scripts.
Emergency exits add an extra safety layer, critical for futures volatility.
5. DAFE Visuals
The visuals are pure DAFE magic, blending function with cyberpunk flair to make signals intuitive and charts stunning.
Shimmering Bollinger Band Fill:
Display: BB basis (20, white), upper/lower (green/red, 45% transparent). Fill pulses (30–50 alpha) by regime, with glow (60–95 alpha) near bands (close ≥ 0.995x upper or ≤ 1.005x lower).
Purpose: Highlights volatility and key levels with a futuristic glow.
Visuals make complex regimes and signals instantly clear, even for newbies.
Pulsing effects and regime-specific colors add a DAFE signature, setting it apart from generic scripts.
BB glow emphasizes tradeable levels, enhancing decision-making.
Chart Background (Regime Heatmap):
Green — Trending Market: Strong, sustained price movement in one direction. The market is in a trend phase—momentum follows through.
Orange — Range-Bound: Market is consolidating or moving sideways, with no clear up/down trend. Great for mean reversion setups.
Red — Volatile Regime: High volatility, heightened risk, and larger/faster price swings—trade with caution.
Gray — Quiet/Low Volatility: Market is calm and inactive, with small moves—often poor conditions for most strategies.
Navy — Other/Neutral: Regime is uncertain or mixed; signals may be less reliable.
Bollinger Bands Glow (Dynamic Fill):
Neon Red Glow — Warning!: Price is near or breaking above the upper band; momentum is overstretched, watch for overbought conditions or reversals.
Bright Green Glow — Opportunity!: Price is near or breaking below the lower band; market could be oversold, prime for bounce or reversal.
Trend Green Fill — Trending Regime: Fills between bands with green when the market is trending, showing clear momentum.
Gold/Yellow Fill — Range Regime: Fills with gold/aqua in range conditions, showing the market is sideways/oscillating.
Magenta/Red Fill — Volatility Spike: Fills with vivid magenta/red during highly volatile regimes.
Blue Fill — Neutral/Quiet: A soft blue glow for other or uncertain market states.
Moving Averages:
Display: Blue fast EMA (20), red slow EMA (50), 2px.
Purpose: Shows trend direction, with trend_dir requiring ATR-scaled spread.
Dynamic SL/TP Lines:
Display: Pulsing colors (red SL, green TP for Trending; yellow/orange for Range, etc.), 3px, with pulse_alpha for shimmer.
Purpose: Tracks stops/TPs in real-time, color-coded by regime.
6. Dual Dashboards
Two dashboards deliver real-time insights, making the strat a quant command center.
Bottom-Left Metrics Dashboard (2x13):
Metrics: Mode (Active/Paused), trend (Bullish/Bearish/Neutral), ATR, ATR avg, volume spike (YES/NO), RSI (value + Oversold/Overbought/Neutral), HTF RSI, HTF trend, last signal (Buy/Sell/None), regime, bull score.
Display: Black (29% transparent), purple title, color-coded (green for bullish, red for bearish).
Purpose: Consolidates market context and signal strength.
Top-Right Position Dashboard (2x7):
Metrics: Regime, position side (Long/Short/None), position PNL ($), SL, TP, daily PNL ($).
Display: Black (29% transparent), purple title, color-coded (lime for Long, red for Short).
Purpose: Tracks live trades and profitability.
Why It’s Brilliant:
Dual dashboards cover market context and trade status, a rare feature.
Color-coding and concise metrics guide beginners (e.g., green “Buy” = go).
Real-time PNL and SL/TP visibility empower disciplined trading.
7. Performance Tracking
Logic: Arrays (regime_pnl_long/short, regime_win/loss_long/short) track PNL and win/loss by regime (1–5). Updated on trade close (barstate.isconfirmed).
Purpose: Prepares for future adaptive thresholds (e.g., adjust bull_score min based on regime performance).
Why It’s Brilliant: Lays the groundwork for self-optimizing logic, a quant edge over static scripts.
Key Features
Regime-Adaptive: Optimizes signals for Trending, Range, Volatile, Quiet markets.
Futures-Optimized: Precise sizing for ES/MES with tick-based risk inputs.
Multi-Factor Signals: Candlestick patterns, RSI, MACD, and HTF confirmation for robust entries.
Dynamic Exits: ATR/fixed stops, 2:1 TPs, and trailing stops maximize profits.
Safe and Smart: 5% drawdown breaker and emergency exits protect capital.
DAFE Visuals: Shimmering BB fill, pulsing SL/TP, and dual dashboards.
Backtest-Ready: Fixed qty and tick calc for accurate historical testing.
How to Use
Add to Chart: Load on a 5min ES/MES chart in TradingView.
Configure Inputs: Set instrument (ES/MES), tick value ($12.5/$1.25), multiplier (1/0.1), risk ($300 default). Enable ATR stops for volatility.
Monitor Dashboards: Bottom-left for regime/signals, top-right for position/PNL.
Backtest: Run in strategy tester to compare regimes.
Live Trade: Connect to Tradovate or similar. Watch for slippage (e.g., April 27, 2025 ES issues).
Replay Test: Try April 28, 2025 NQ drop to see regime shifts and stops.
Disclaimer
Trading futures involves significant risk of loss and is not suitable for all investors. Past performance does not guarantee future results. Backtest results may differ from live trading due to slippage, fees, or market conditions. Use this strategy at your own risk, and consult a financial advisor before trading. Dskyz (DAFE) Trading Systems is not responsible for any losses incurred.
Backtesting:
Frame: 2023-09-20 - 2025-04-29
Slippage: 3
Fee Typical Range (per side, per contract)
CME Exchange $1.14 – $1.20
Clearing $0.10 – $0.30
NFA Regulatory $0.02
Firm/Broker Commis. $0.25 – $0.80 (retail prop)
TOTAL $1.60 – $2.30 per side
Round Turn: (enter+exit) = $3.20 – $4.60 per contract
Final Notes
The Dskyz (DAFE) Adaptive Regime - Quant Machine Pro is more than a strategy—it’s a revolution. Crafted with DAFE’s signature precision, it rises above generic scripts with adaptive regimes, quant-grade signals, and visuals that make trading a thrill. Whether you’re scalping MES or swinging ES, this system empowers you to navigate markets with confidence and style. Join the DAFE crew, light up your charts, and let’s dominate the futures game!
(This publishing will most likely be taken down do to some miscellaneous rule about properly displaying charting symbols, or whatever. Once I've identified what part of the publishing they want to pick on, I'll adjust and repost.)
Use it with discipline. Use it with clarity. Trade smarter.
**I will continue to release incredible strategies and indicators until I turn this into a brand or until someone offers me a contract.
Created by Dskyz, powered by DAFE Trading Systems. Trade smart, trade bold.

Volume Weighted Median Price (VWMP)The volume is indeed crucial for confirming price moves and understanding market conviction. While many traders are familiar with VWAP (Volume Weighted Average Price), this indicator introduces a lesser-known but powerful cousin: the Volume Weighted Median Price (VWMP).
What is VWMP?
Unlike VWAP, which calculates the average price weighted by volume over a period, VWMP identifies the median price level weighted by volume.
Think of it this way: If you line up all the trades within a specific lookback period, sorted by price, and then start accumulating the volume traded at each price level, the VWMP is the price level where 50% of the total volume occurred below it, and 50% occurred above it.
It essentially finds the "middle ground" of trading activity based on where the bulk of the volume actually traded, not just the average price.
Key Difference: VWMP vs. VWAP
VWAP: Volume Weighted Average Price. Sensitive to outliers (single large trades at extreme prices can skew the average).
VWMP: Volume Weighted Median Price. More robust to outliers. It represents the price that splits the period's volume distribution in half.
Because it uses the median, VWMP can sometimes provide a more stable or representative level of the "typical" price where significant volume is changing hands, especially in volatile markets or when large, anomalous trades occur.
How to Interpret and Use VWMP in trading
The VWMP plots as a line on your chart, similar to a moving average or VWAP. Here are a few ways traders might use it:
Dynamic Support and Resistance:
Like VWAP, the VWMP line can act as a dynamic level of interest.
Watch how price interacts with the VWMP. Consistent acceptance above VWMP might suggest bullish control and potential support.
Consistent rejection or acceptance below VWMP might indicate bearish control and potential resistance.
Trend Filter / Confirmation:
Uptrend: Look for price consistently staying above the VWMP line. Pullbacks to the VWMP that hold could offer entry opportunities.
Downtrend: Look for price consistently staying below the VWMP line. Rallies to the VWMP that fail could present shorting opportunities.
Use it to filter trades: Only take long trades if price is above VWMP, and short trades if below.
Mean Reversion Potential (Use with Caution):
When price extends significantly far away from the VWMP, some traders might look for potential reversion back towards this volume-based median level.
Important: This should not be used in isolation. Always look for confirmation from other indicators (like RSI, Stochastics, or candlestick patterns) before trading counter-trend reversions.
Confluence with Other Indicators:
VWMP works best when combined with other analysis tools.
Look for confluence: Does the VWMP align with a key Fibonacci level, a standard moving average, or a prior support/resistance zone? This confluence strengthens the level's potential significance.
Considerations
Lookback Period: The length input is crucial. A shorter period makes VWMP more responsive to recent action; a longer period makes it smoother and reflects longer-term volume distribution. Experiment to find what suits your timeframe and trading style.
Lagging Nature: Like all indicators based on past data, VWMP is inherently lagging. It reflects past volume distribution, not the future.
Market Context: Its effectiveness can vary depending on the market conditions (trending vs. ranging) and the asset being traded.

Fuzzy SMA Trend Analyzer (experimental)[FibonacciFlux]Fuzzy SMA Trend Analyzer (Normalized): Advanced Market Trend Detection Using Fuzzy Logic Theory
Elevate your technical analysis with institutional-grade fuzzy logic implementation
Research Genesis & Conceptual Framework
This indicator represents the culmination of extensive research into applying fuzzy logic theory to financial markets. While traditional technical indicators often produce binary outcomes, market conditions exist on a continuous spectrum. The Fuzzy SMA Trend Analyzer addresses this limitation by implementing a sophisticated fuzzy logic system that captures the nuanced, multi-dimensional nature of market trends.
Core Fuzzy Logic Principles
At the heart of this indicator lies fuzzy logic theory - a mathematical framework designed to handle imprecision and uncertainty:
// Improved fuzzy_triangle function with guard clauses for NA and invalid parameters.
fuzzy_triangle(val, left, center, right) =>
if na(val) or na(left) or na(center) or na(right) or left > center or center > right // Guard checks
0.0
else if left == center and center == right // Crisp set (single point)
val == center ? 1.0 : 0.0
else if left == center // Left-shoulder shape (ramp down from 1 at center to 0 at right)
val >= right ? 0.0 : val <= center ? 1.0 : (right - val) / (right - center)
else if center == right // Right-shoulder shape (ramp up from 0 at left to 1 at center)
val <= left ? 0.0 : val >= center ? 1.0 : (val - left) / (center - left)
else // Standard triangle
math.max(0.0, math.min((val - left) / (center - left), (right - val) / (right - center)))
This implementation of triangular membership functions enables the indicator to transform crisp numerical values into degrees of membership in linguistic variables like "Large Positive" or "Small Negative," creating a more nuanced representation of market conditions.
Dynamic Percentile Normalization
A critical innovation in this indicator is the implementation of percentile-based normalization for SMA deviation:
// ----- Deviation Scale Estimation using Percentile -----
// Calculate the percentile rank of the *absolute* deviation over the lookback period.
// This gives an estimate of the 'typical maximum' deviation magnitude recently.
diff_abs_percentile = ta.percentile_linear_interpolation(math.abs(raw_diff), normLookback, percRank) + 1e-10
// ----- Normalize the Raw Deviation -----
// Divide the raw deviation by the estimated 'typical max' magnitude.
normalized_diff = raw_diff / diff_abs_percentile
// ----- Clamp the Normalized Deviation -----
normalized_diff_clamped = math.max(-3.0, math.min(3.0, normalized_diff))
This percentile normalization approach creates a self-adapting system that automatically calibrates to different assets and market regimes. Rather than using fixed thresholds, the indicator dynamically adjusts based on recent volatility patterns, significantly enhancing signal quality across diverse market environments.
Multi-Factor Fuzzy Rule System
The indicator implements a comprehensive fuzzy rule system that evaluates multiple technical factors:
SMA Deviation (Normalized): Measures price displacement from the Simple Moving Average
Rate of Change (ROC): Captures price momentum over a specified period
Relative Strength Index (RSI): Assesses overbought/oversold conditions
These factors are processed through a sophisticated fuzzy inference system with linguistic variables:
// ----- 3.1 Fuzzy Sets for Normalized Deviation -----
diffN_LP := fuzzy_triangle(normalized_diff_clamped, 0.7, 1.5, 3.0) // Large Positive (around/above percentile)
diffN_SP := fuzzy_triangle(normalized_diff_clamped, 0.1, 0.5, 0.9) // Small Positive
diffN_NZ := fuzzy_triangle(normalized_diff_clamped, -0.2, 0.0, 0.2) // Near Zero
diffN_SN := fuzzy_triangle(normalized_diff_clamped, -0.9, -0.5, -0.1) // Small Negative
diffN_LN := fuzzy_triangle(normalized_diff_clamped, -3.0, -1.5, -0.7) // Large Negative (around/below percentile)
// ----- 3.2 Fuzzy Sets for ROC -----
roc_HN := fuzzy_triangle(roc_val, -8.0, -5.0, -2.0)
roc_WN := fuzzy_triangle(roc_val, -3.0, -1.0, -0.1)
roc_NZ := fuzzy_triangle(roc_val, -0.3, 0.0, 0.3)
roc_WP := fuzzy_triangle(roc_val, 0.1, 1.0, 3.0)
roc_HP := fuzzy_triangle(roc_val, 2.0, 5.0, 8.0)
// ----- 3.3 Fuzzy Sets for RSI -----
rsi_L := fuzzy_triangle(rsi_val, 0.0, 25.0, 40.0)
rsi_M := fuzzy_triangle(rsi_val, 35.0, 50.0, 65.0)
rsi_H := fuzzy_triangle(rsi_val, 60.0, 75.0, 100.0)
Advanced Fuzzy Inference Rules
The indicator employs a comprehensive set of fuzzy rules that encode expert knowledge about market behavior:
// --- Fuzzy Rules using Normalized Deviation (diffN_*) ---
cond1 = math.min(diffN_LP, roc_HP, math.max(rsi_M, rsi_H)) // Strong Bullish: Large pos dev, strong pos roc, rsi ok
strength_SB := math.max(strength_SB, cond1)
cond2 = math.min(diffN_SP, roc_WP, rsi_M) // Weak Bullish: Small pos dev, weak pos roc, rsi mid
strength_WB := math.max(strength_WB, cond2)
cond3 = math.min(diffN_SP, roc_NZ, rsi_H) // Weakening Bullish: Small pos dev, flat roc, rsi high
strength_N := math.max(strength_N, cond3 * 0.6) // More neutral
strength_WB := math.max(strength_WB, cond3 * 0.2) // Less weak bullish
This rule system evaluates multiple conditions simultaneously, weighting them by their degree of membership to produce a comprehensive trend assessment. The rules are designed to identify various market conditions including strong trends, weakening trends, potential reversals, and neutral consolidations.
Defuzzification Process
The final step transforms the fuzzy result back into a crisp numerical value representing the overall trend strength:
// --- Step 6: Defuzzification ---
denominator = strength_SB + strength_WB + strength_N + strength_WBe + strength_SBe
if denominator > 1e-10 // Use small epsilon instead of != 0.0 for float comparison
fuzzyTrendScore := (strength_SB * STRONG_BULL +
strength_WB * WEAK_BULL +
strength_N * NEUTRAL +
strength_WBe * WEAK_BEAR +
strength_SBe * STRONG_BEAR) / denominator
The resulting FuzzyTrendScore ranges from -1 (strong bearish) to +1 (strong bullish), providing a smooth, continuous evaluation of market conditions that avoids the abrupt signal changes common in traditional indicators.
Advanced Visualization with Rainbow Gradient
The indicator incorporates sophisticated visualization using a rainbow gradient coloring system:
// Normalize score to for gradient function
normalizedScore = na(fuzzyTrendScore) ? 0.5 : math.max(0.0, math.min(1.0, (fuzzyTrendScore + 1) / 2))
// Get the color based on gradient setting and normalized score
final_color = get_gradient(normalizedScore, gradient_type)
This color-coding system provides intuitive visual feedback, with color intensity reflecting trend strength and direction. The gradient can be customized between Red-to-Green or Red-to-Blue configurations based on user preference.
Practical Applications
The Fuzzy SMA Trend Analyzer excels in several key applications:
Trend Identification: Precisely identifies market trend direction and strength with nuanced gradation
Market Regime Detection: Distinguishes between trending markets and consolidation phases
Divergence Analysis: Highlights potential reversals when price action and fuzzy trend score diverge
Filter for Trading Systems: Provides high-quality trend filtering for other trading strategies
Risk Management: Offers early warning of potential trend weakening or reversal
Parameter Customization
The indicator offers extensive customization options:
SMA Length: Adjusts the baseline moving average period
ROC Length: Controls momentum sensitivity
RSI Length: Configures overbought/oversold sensitivity
Normalization Lookback: Determines the adaptive calculation window for percentile normalization
Percentile Rank: Sets the statistical threshold for deviation normalization
Gradient Type: Selects the preferred color scheme for visualization
These parameters enable fine-tuning to specific market conditions, trading styles, and timeframes.
Acknowledgments
The rainbow gradient visualization component draws inspiration from LuxAlgo's "Rainbow Adaptive RSI" (used under CC BY-NC-SA 4.0 license). This implementation of fuzzy logic in technical analysis builds upon Fermi estimation principles to overcome the inherent limitations of crisp binary indicators.
This indicator is shared under Attribution-NonCommercial-ShareAlike 4.0 International (CC BY-NC-SA 4.0) license.
Remember that past performance does not guarantee future results. Always conduct thorough testing before implementing any technical indicator in live trading.

MTF Fibonacci Pivots with Mandelbrot FractalsMTF Fibonacci Pivots with Mandelbrot Fractals: Advanced Market Structure Analysis
Overview
The MTF Fibonacci Pivots with Mandelbrot Fractals indicator represents a significant advancement in technical analysis by combining multi-timeframe Fibonacci pivot levels with sophisticated fractal pattern recognition. This powerful tool identifies key support and resistance zones while predicting potential price reversals with remarkable accuracy.
Key Capabilities
This indicator provides traders with three distinct layers of market structure analysis:
Automatic Timeframe Adaptation: The primary pivot set automatically adjusts to your chart's timeframe, ensuring relevant support and resistance levels for your specific trading horizon.
1-Year Fibonacci Pivots: The second layer displays yearly pivots that reveal long-term market cycles and institutional price levels that often act as significant reversal points.
3-Year Fibonacci Pivots: The third layer unveils major market structure zones that typically remain relevant for extended periods, offering strategic context for position trading and long-term investment decisions.
Predictive Technology
What truly distinguishes this indicator is its advanced predictive capability powered by:
Mandelbrot Fractal Pattern Recognition: The indicator implements a sophisticated fractal detection algorithm that identifies recurring price patterns across multiple timeframes. Unlike conventional fractal indicators, it incorporates noise filtering and adaptive sensitivity to market volatility.
Tesla's 3-6-9 Principle Integration: The system incorporates Nikola Tesla's mathematical principle through a cubic Mandelbrot equation (Z_{n+1} = Z_n^3 + C where Z_0 = 0), creating a unique approach to pattern recognition that aligns with natural market rhythms.
Historical Pattern Matching: When a current price pattern exhibits strong similarity to historical formations, the indicator generates predictive targets with confidence ratings. Each prediction undergoes rigorous validation against multiple parameters including trend alignment, volatility context, and mathematical coherence.
Visual Intelligence System
The indicator's visual presentation enhances trading decision-making through:
Confidence-Based Visualization: Predictions display with intuitive star ratings, percentage confidence scores, and contextual information including price movement magnitude and estimated time to target.
Adaptive Color Harmonization: The color system intelligently adjusts to provide optimal visibility while maintaining a professional appearance suitable for any chart setup.
Trend Alignment Indicators: Each prediction includes references to the broader trend context, helping traders avoid counter-trend trades unless the reversal signal carries exceptional strength.
Strategic Applications
This indicator excels in multiple trading scenarios:
Intraday Trading: Identify high-probability reversal zones with precise timing
Swing Trading: Anticipate significant market turns at key structural levels
Position Trading: Recognize major cycle shifts for strategic entry and exit
The automatic 1-year and 3-year Fibonacci pivots provide institutional-grade reference points that typically define major market movements. These longer timeframes reveal critical zones that might be invisible on shorter-term analysis, giving you a significant edge in understanding where price is likely to encounter substantial buying or selling pressure.
This innovative approach to market analysis combines classical Fibonacci mathematics with cutting-edge fractal theory to create a comprehensive market structure visualization system that illuminates both present support/resistance levels and future price targets with exceptional clarity.
Setting Up MTF Fibonacci Pivots with Mandelbrot Fractals
Initial Setup
Adding this indicator to your TradingView charts is straightforward:
Navigate to the "Indicators" button on your chart toolbar
Search for "MTF Fibonacci Pivots with Mandelbrot Fractals"
Select the indicator to add it to your chart
A configuration panel will appear with various setting categories
Recommended Settings
The indicator comes pre-configured with optimal default settings, but you may want to adjust them based on your trading style:
For Day Trading (Timeframes 1-minute to 1-hour)
Pivots Timeframe 1: Auto (automatically adapts to your chart)
Pivots Timeframe 2: Daily
Pivots Timeframe 3: Weekly
Fractal Sensitivity: 2-3
Fractal Lookback Period: 20
Prediction Strength: 2
Color Theme: High Contrast or Dark Mode
For Swing Trading (Timeframes 4-hour to Daily)
Pivots Timeframe 1: Daily
Pivots Timeframe 2: Weekly
Pivots Timeframe 3: Monthly
Fractal Sensitivity: 1-2
Fractal Lookback Period: 30
Prediction Strength: 2-3
Color Theme: Default or Dimmed
For Position Trading (Timeframes Daily to Weekly)
Pivots Timeframe 1: Weekly
Pivots Timeframe 2: Monthly
Pivots Timeframe 3: Quarterly
Fractal Sensitivity: 1
Fractal Lookback Period: 50
Prediction Strength: 1
Color Theme: Monochrome or Pastel
Restoring Default Settings
If you've adjusted settings and wish to return to the defaults:
Right-click on the indicator name on your chart
Select "Settings" from the context menu
In the settings dialog, look for the "Reset All" button at the bottom
Confirm the reset when prompted
Alternatively, you can remove the indicator and add it again for a fresh start with default settings.
Advanced Settings Guidance
Visual Appearance
Use Gradient Colors: Enable for better visual differentiation between pivot levels
Color Transparency: 15% provides an optimal balance between visibility and chart clutter
Line Width: 1-2 for cleaner charts, 3+ for enhanced visibility
Fractal Analysis
Enable Fractal Analysis: Keep enabled for prediction capabilities
Fractal Box Spacing: Higher values (5-10) for cleaner displays, lower values (1-3) for more signals
Maximum Forecast Bars: 20 is optimal for most timeframes, adjust higher for longer predictions
Performance Considerations
Enable Self-Optimization: Keep enabled to maintain smooth chart performance
Resource Priority: Use "Balanced" for most computers, "Performance" for older systems
Force Pivot Display: Enable only when checking specific historical periods
Common Setup Mistakes to Avoid
Setting all timeframes too close together (e.g., Daily, Daily, Weekly) reduces the multi-timeframe advantage
Using high fractal sensitivity (4+) on noisy markets creates excessive signals
Setting fractal box spacing too low causes cluttered prediction boxes
Disabling self-optimization may cause performance issues on complex charts
Using incompatible color themes for your chart background reduces visibility
The indicator's power comes from its default 1-year and 3-year Fibonacci pivot settings, which highlight institutional levels while the auto-timeframe setting adapts to your trading horizon. These carefully balanced defaults provide an excellent starting point for most traders.
For optimal results, I recommend making minimal adjustments at first, then gradually customizing settings as you become familiar with the indicator's behavior in your specific markets and timeframes.
Screenshots:

Multiple AVWAP [OmegaTools]The Multiple AVWAP indicator is a sophisticated trading tool designed for professional traders who require precision in volume-weighted price tracking. This indicator allows for the deployment of multiple Anchored Volume Weighted Average Price (AVWAP) calculations simultaneously, offering deep insights into price movements, dynamic support and resistance levels, and trend structures across multiple timeframes.
This indicator caters to both institutional and retail traders by integrating flexible anchoring methods, multi-timeframe adaptability, and enhanced visualization features. It also includes deviation bands for statistical analysis, making it a comprehensive volume-based trading solution.
Key Features & Functionalities
1. Multiple AVWAP Configurations
Users can configure up to four distinct AVWAP calculations to track different market conditions.
Supports various anchoring methods:
Fixed: A traditional AVWAP that starts from a defined historical point.
Perpetual: A rolling VWAP that continuously adjusts over time.
Extension: An extension-based AVWAP that projects from past calculations.
High Volume: Anchors AVWAP to the highest volume bar within a specified period.
None: Option to disable AVWAP calculation if not required.
2. Advanced Deviation Bands
Implements standard deviation bands (1st and 2nd deviation) to provide a statistical measure of price dispersion from the AVWAP.
Serves as a dynamic method for identifying overbought and oversold conditions relative to VWAP pricing.
Deviation bands are customizable in terms of visibility, color, and transparency.
3. Multi-Timeframe Support
Users can assign different timeframes to each AVWAP calculation for macro and micro analysis.
Helps in identifying long-term institutional trading levels alongside short-term intraday trends.
4. Z-Score Normalization Mode
Option to standardize oscillator values based on AVWAP deviations.
Converts price movements into a statistical Z-score, allowing traders to measure price strength in a normalized range.
Helps in detecting extreme price dislocations and mean-reversion opportunities.
5. Customizable Visual & Aesthetic Settings
Fully customizable line colors, transparency, and thickness to enhance clarity.
Users can modify AVWAP and deviation band colors to distinguish between different levels.
Configurable display options to match personal trading preferences.
6. Oscillator Mode for Trend & Momentum Analysis
The indicator converts price deviations into an oscillator format, displaying AVWAP strength and weakness dynamically.
This provides traders with a momentum-based perspective on volume-weighted price movements.
User Guide & Implementation
1. Configuring AVWAPs for Optimal Use
Choose the mode for each AVWAP instance:
Fixed (set historical point)
Perpetual (rolling, continuously updated AVWAP)
Extension (projection from past AVWAP levels)
High Volume (anchored to highest volume bar)
None (disables the AVWAP line)
Adjust the length settings to fine-tune calculation sensitivity.
2. Utilizing Deviation Bands for Market Context
Activate deviation bands to see statistical boundaries of price action.
Monitor +1 / -1 and +2 / -2 standard deviation levels for extended price movements.
Consider price action outside of deviation bands as potential mean-reversion signals.
3. Multi-Timeframe Analysis for Institutional-Level Insights
Assign different timeframes to each AVWAP to compare:
Daily VWAP (institutional trading levels)
Weekly VWAP (swing trading trends)
Intraday VWAPs (short-term momentum shifts)
Helps identify where institutional liquidity is positioned relative to price.
4. Activating the Oscillator for Momentum & Bias Confirmation
The oscillator converts AVWAP deviations into a normalized value.
Use overbought/oversold levels to determine strength and potential reversals.
Combine with other indicators (RSI, MACD) for confluence-based trading decisions.
Trading Applications & Strategies
5. Trend Confirmation & Institutional VWAP Tracking
If price consistently holds above the primary AVWAP, it signals a bullish trend.
If price remains below AVWAP, it indicates selling pressure and a bearish trend.
Monitor retests of AVWAP levels for potential trend continuation or reversal.
6. Dynamic Support & Resistance Levels
AVWAP lines act as dynamic floating support and resistance zones.
Price bouncing off AVWAP suggests continuation, whereas breakdowns indicate a shift in momentum.
Look for confluence with high-volume zones for stronger trade signals.
7. Mean Reversion & Statistical Edge Trading
Prices that deviate beyond +2 or -2 standard deviations often revert toward AVWAP.
Mean reversion traders can fade extended moves and target AVWAP re-tests.
Helps in identifying exhaustion points in trending markets.
8. Institutional Liquidity & Volume Footprints
Institutions often execute large trades near VWAP zones, causing price reactions.
Tracking multi-timeframe AVWAP levels allows traders to anticipate key liquidity areas.
Use higher timeframe AVWAPs as macro support/resistance for swing trading setups.
9. Enhancing Momentum Trading with AVWAP Oscillator
The oscillator provides a momentum-based measure of AVWAP deviations.
Helps in confirming entry and exit timing for trend-following trades.
Useful for pairing with stochastic oscillators, MACD, or RSI to validate trade decisions.
Best Practices & Trading Tips
Use in Conjunction with Volume Analysis: Combine with volume profiles, OBV, or CVD for increased accuracy.
Adjust Timeframes Based on Trading Style: Scalpers can focus on short-term AVWAP, while swing traders benefit from weekly/daily AVWAP tracking.
Backtest Different AVWAP Configurations: Experiment with different anchoring methods and lookback periods to optimize trade performance.
Monitor Institutional Order Flow: Identify key VWAP zones where institutional traders may be active.
Use with Other Technical Indicators: Enhance trading confidence by integrating with moving averages, Bollinger Bands, or Fibonacci retracements.
Final Thoughts & Disclaimer
The Multiple AVWAP indicator provides a comprehensive approach to volume-weighted price tracking, making it ideal for professional traders. While this tool enhances market clarity and trade decision-making, it should be used as part of a well-rounded trading strategy with risk management principles in place.
This indicator is provided for informational and educational purposes only. Trading involves risk, and past performance is not indicative of future results. Always conduct your own analysis and due diligence before executing trades.
OmegaTools - Enhancing Market Clarity with Precision Indicators

Ultimate Trading BotHow the "Ultimate Trading Bot" Works:
This Pine Script trading bot executes buy and sell trades based on a combination of technical indicators:
Indicators Used:
RSI (Relative Strength Index)
Measures momentum and determines overbought (70) and oversold (30) levels.
A crossover above 30 suggests a potential buy, and a cross below 70 suggests a potential sell.
Moving Average (MA)
A simple moving average (SMA) of 50 periods to track the trend.
Prices above the MA indicate an uptrend, while prices below indicate a downtrend.
Stochastic Oscillator (%K and %D)
Identifies overbought and oversold conditions using a smoothed stochastic formula.
A crossover of %K above %D signals a buy, and a crossover below %D signals a sell.
MACD (Moving Average Convergence Divergence)
Uses a 12-period fast EMA and a 26-period slow EMA, with a 9-period signal line.
A crossover of MACD above the signal line suggests a bullish move, and a cross below suggests bearish movement.
Trade Execution:
Buy (Long Entry) Conditions:
RSI crosses above 30 (indicating recovery from an oversold state).
The closing price is above the 50-period moving average (showing an uptrend).
The MACD line crosses above the signal line (indicating upward momentum).
The Stochastic %K crosses above %D (indicating bullish momentum).
→ If all conditions are met, the bot enters a long (buy) position.
Sell (Exit Trade) Conditions:
RSI crosses below 70 (indicating overbought conditions).
The closing price is below the 50-period moving average (downtrend).
The MACD line crosses below the signal line (bearish signal).
The Stochastic %K crosses below %D (bearish momentum).
→ If all conditions are met, the bot closes the long position.
Visuals:
The bot plots the moving average, RSI, MACD, and Stochastic indicators for reference.
It also displays buy/sell signals with arrows:
Green arrow (Buy Signal) → When all buy conditions are met.
Red arrow (Sell Signal) → When all sell conditions are met.
How to Use It in TradingView:

Crypto Scanner v4This guide explains a version 6 Pine Script that scans a user-provided list of cryptocurrency tokens to identify high probability tradable opportunities using several technical indicators. The script combines trend, momentum, and volume-based analyses to generate potential buying or selling signals, and it displays the results in a neatly formatted table with alerts for trading setups. Below is a detailed walkthrough of the script’s design, how traders can interpret its outputs, and recommendations for optimizing indicator inputs across different timeframes.
## Overview and Key Components
The script is designed to help traders assess multiple tokens by calculating several indicators for each one. The key components include:
- **Input Settings:**
- A comma-separated list of symbols to scan.
- Adjustable parameters for technical indicators such as ADX, RSI, MFI, and a custom Wave Trend indicator.
- Options to enable alerts and set update frequencies.
- **Indicator Calculations:**
- **ADX (Average Directional Index):** Measures trend strength. A value above the provided threshold indicates a strong trend, which is essential for validating momentum before entering a trade.
- **RSI (Relative Strength Index):** Helps determine overbought or oversold conditions. When the RSI is below the oversold level, it may present a buying opportunity, while an overbought condition (not explicitly part of this setup) could suggest selling.
- **MFI (Money Flow Index):** Similar in concept to RSI but incorporates volume, thus assessing buying and selling pressure. Values below the designated oversold threshold indicate potential undervaluation.
- **Wave Trend:** A custom indicator that calculates two components (WT1 and WT2); a crossover where WT1 moves from below to above WT2 (particularly near oversold levels) may signal a reversal and a potential entry point.
- **Scanning and Trading Zone:**
- The script identifies a *bullish setup* when the following conditions are met for a token:
- ADX exceeds the threshold (strong trend).
- Both RSI and MFI are below their oversold levels (indicating potential buying opportunities).
- A Wave Trend crossover confirms near-term reversal dynamics.
- A *trading zone* condition is also defined by specific ranges for ADX, RSI, MFI, and a limited difference between WT1 and WT2. This zone suggests that the token might be in a consolidation phase where even small moves may be significant.
- **Alerts and Table Reporting:**
- A table is generated, with each row corresponding to a token. The table contains columns for the symbol, ADX, RSI, MFI, WT1, WT2, and the trading zone status.
- Visual cues—such as different background colors—highlight tokens with a bullish setup or that are within the trading zone.
- Alerts are issued based on the detection of a bullish setup or entry into a trading zone. These alerts are limited per bar to avoid flooding the trader with notifications.
## How to Interpret the Indicator Outputs
Traders should use the indicator values as guidance, verifying them against their own analysis before making any trading decision. Here’s how to assess each output:
- **ADX:**
- **High values (above threshold):** Indicate strong trends. If other indicators confirm an oversold condition, a trader may consider a long position for a corrective reversal.
- **Low values:** Suggest that the market is not trending strongly, and caution should be taken when considering entry.
- **RSI and MFI:**
- **Below oversold levels:** These conditions are traditionally seen as signals that an asset is undervalued, potentially triggering a bounce.
- **Above typical resistance levels (not explicitly used here):** Would normally caution a trader against entering a long position.
- **Wave Trend (WT1 and WT2):**
- A crossover where WT1 moves upward above WT2 in an oversold environment can signal the beginning of a recovery or reversal, thereby reinforcing buy signals.
- **Trading Zone:**
- Being “in zone” means that the asset’s current values for ADX, RSI, MFI, and the closeness of the Wave Trend lines indicate a period of consolidation. This scenario might be suitable for both short-term scalping or as an early exit indicator, depending on further market analysis.
## Timeframe Optimization Input Table
Traders can optimize indicator inputs depending on the timeframe they use. The following table provides a set of recommended input values for various timeframes. These values are suggestions and should be adjusted based on market conditions and individual trading styles.
Timeframe ADX RSI MFI ADX RSI MFI WT Channel WT Average
5-min 10 10 10 20 30 20 7 15
15-min 12 12 12 22 30 20 9 18
1-hour 14 14 14 25 30 20 10 21
4-hour 16 16 16 27 30 20 12 24
1-day 18 18 18 30 30 20 14 28
Adjust these parameters directly in the script’s input settings to match the selected timeframe. For shorter timeframes (e.g., 5-min or 15-min), the shorter lengths help filter high-frequency noise. For longer timeframes (e.g., 1-day), longer input values may reduce false signals and capture more significant trends.
## Best Practices and Usage Tips
- **Token Limit:**
- Limit the number of tokens scanned to 10 per query line. If you need to scan more tokens, initiate a new query line. This helps manage screen real estate and ensures the table remains legible.
- **Confirming Signals:**
- Use this script as a starting point for identifying high potential trades. Each indicator’s output should be used to confirm your trading decision. Always cross-reference with additional technical analysis tools or market context.
- **Regular Review:**
- Since the script updates the table every few bars (as defined by the update frequency), review the table and alerts regularly. Market conditions change rapidly, so timely decisions are crucial.
## Conclusion
This Pine Script provides a comprehensive approach for scanning multiple cryptocurrencies using a combination of trend strength (ADX), momentum (RSI and MFI), and reversal signals (Wave Trend). By using the provided recommendation table for different timeframes and limiting the tokens to 20 per query line (with a maximum of four query lines), traders can streamline their scanning process and more effectively identify high probability tradable tokens. Ultimately, the outputs should be critically evaluated and combined with additional market research before executing any trades.

Donchian and Keltner Channels Trend Following with Trailing StopLong Only Trend-following model based on Keltner Channels and Donchian Channels.
These indicators include a noise region, which allows prices to oscillate without requiring position adjustments.
When price trades above the upper band, it signals strength; when it trades below the lower band, it signals weakness.
Keltner Channels
Keltner Channels are volatility-based envelopes set above and below an exponential moving average. Keltner Channels use the Average True Range (ATR), which measures daily volatility, to set channel distance.
Donchian Channel
Donchian Channels are are used to identify market trends and volatility. The upper and lower bands are based on the highest high and lowest low of a specified period. When the price moves above the upper band, it indicates a bullish breakout, while a
move below the lower band indicates a bearish breakout. The distance between the upper and lower channel of the Donchian Channel indicates the asset’s volatility.
Trend Following Model
The default settings are:
Upper Keltner and Upper Donchian Channel Length : 20
Lower Keltner and Lower Donchian Channel Length : 40
Keltner ATR Multiplier: 2
Entries, Exits and Trailing Stop
Entry : When price exceeds the upper band of at least one of these indicators.
Exit : When price undercuts the lower band of at least one of these indicators.
Trailing Stop : See below.
Trailing Stop
This is a stop-loss order that moves with the price of the underlying. It is designed to “trail” the price up (in the case of a long position) or down (for a short position), locking in profits as the price moves in a favorable direction.
At the end of day t, there was a Trailing Stop level in place. For the next day (day t + 1), the Trailing Stop will be adjusted. The new Trailing Stop will be the higher of two values:
The Trailing Stop from the previous day (day t).
The Lower Band computed at the end of day t + 1.
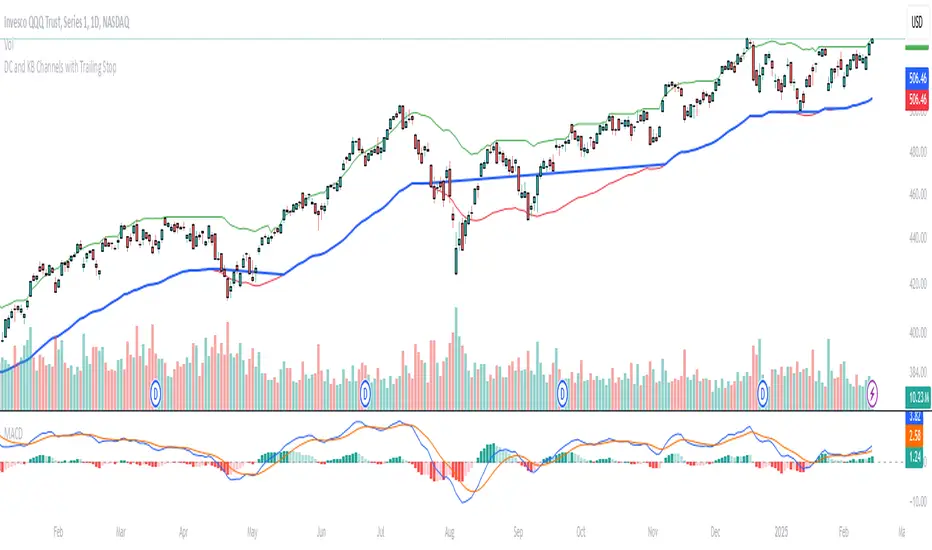
Cluster Reversal Zones📌 Cluster Reversal Zones – Smart Market Turning Point Detector
📌 Category : Public (Restricted/Closed-Source) Indicator
📌 Designed for : Traders looking for high-accuracy reversal zones based on price clustering & liquidity shifts.
🔍 Overview
The Cluster Reversal Zones Indicator is an advanced market reversal detection tool that helps traders identify key turning points using a combination of price clustering, order flow analysis, and liquidity tracking. Instead of relying on static support and resistance levels, this tool dynamically adjusts to live market conditions, ensuring traders get the most accurate reversal signals possible.
📊 Core Features:
✅ Real-Time Reversal Zone Mapping – Detects high-probability market turning points using price clustering & order flow imbalance.
✅ Liquidity-Based Support/Resistance Detection – Identifies strong rejection zones based on real-time liquidity shifts.
✅ Order Flow Sensitivity for Smart Filtering – Filters out weak reversals by detecting real market participation behind price movements.
✅ Momentum Divergence for Confirmation – Aligns reversal zones with momentum divergences to increase accuracy.
✅ Adaptive Risk Management System – Adjusts risk parameters dynamically based on volatility and trend state.
🔒 Justification for Mashup
The Cluster Reversal Zones Indicator contains custom-built methodologies that extend beyond traditional support/resistance indicators:
✔ Smart Price Clustering Algorithm: Instead of plotting fixed support/resistance lines, this system analyzes historical price clustering to detect active reversal areas.
✔ Order Flow Delta & Liquidity Shift Sensitivity: The tool tracks real-time order flow data, identifying price zones with the highest accumulation or distribution levels.
✔ Momentum-Based Reversal Validation: Unlike traditional indicators, this tool requires a momentum shift confirmation before validating a potential reversal.
✔ Adaptive Reversal Filtering Mechanism: Uses a combination of historical confluence detection + live market validation to improve accuracy.
🛠️ How to Use:
• Works well for reversal traders, scalpers, and swing traders seeking precise turning points.
• Best combined with VWAP, Market Profile, and Delta Volume indicators for confirmation.
• Suitable for Forex, Indices, Commodities, Crypto, and Stock markets.
🚨 Important Note:
For educational & analytical purposes only.

Waldo Momentum Cloud Bollinger Bands (WMCBB)
Title: Waldo Momentum Cloud Bollinger Bands (WMCBB)
Description:
Introducing the "Waldo Momentum Cloud Bollinger Bands (WMCBB)," an innovative trading tool crafted for those who aim to deepen their market analysis by merging two dynamic technical indicators: Dynamic RSI Bollinger Bands and the Waldo Cloud.
What is this Indicator?
WMCBB integrates the volatility-based traditional Bollinger Bands with a momentum-sensitive approach through the Relative Strength Index (RSI). Here’s how it works:
Dynamic RSI Bollinger Bands: These bands dynamically adjust according to the RSI, which tracks the momentum of price movements. By scaling the RSI to align with price levels, we generate bands that not only reflect market volatility but also the underlying momentum, offering a refined view of overbought and oversold conditions.
Waldo Cloud: This feature adds a layer of traditional Bollinger Bands, visualized as a 'cloud' on your chart. It employs standard Bollinger Band methodology but enhances it with additional moving average layers to better define market trends.
The cloud's color changes dynamically based on various market conditions, providing visual signals for trend direction and potential trend reversals.
Why Combine These Indicators?
Combining Dynamic RSI Bollinger Bands with the Waldo Cloud in WMCBB aims to:
Enhance Trend Identification: The Waldo Cloud's color-coded system aids in recognizing the overarching market trend, while the Dynamic RSI Bands give insights into momentum changes within that trend, offering a comprehensive view.
Improve Volatility and Momentum Analysis: While traditional Bollinger Bands measure market volatility, integrating RSI adds a layer of momentum analysis, potentially leading to more accurate trading signals.
Visual Clarity: The unified color scheme for both sets of bands, which changes according to RSI levels, moving average crossovers, and price positioning, simplifies the process of gauging market sentiment at a glance.
Customization: Users have the option to toggle the visibility of moving averages (MA) through the settings, allowing for tailored analysis based on individual trading strategies.
Usage:
Utilize WMCBB to identify potential trend shifts by observing price interactions with the dynamic bands or changes in the Waldo Cloud's color.
Watch for divergences between price movements and RSI to forecast potential market reversals or continuations.
This combination shines in sideways markets where traditional indicators might fall short, as it provides additional context through RSI momentum analysis.
Settings:
Customize parameters for both the Dynamic RSI and Waldo Cloud Bollinger Bands, including the calculation source, standard deviation factors, and moving average lengths.
WMCBB is perfect for traders seeking to enhance their market analysis through the synergy of momentum and volatility, all while maintaining visual simplicity. Trade with greater insight using the Waldo Momentum Cloud Bollinger Bands!

Price Imbalance as Consecutive Levels of AveragesOverview
The Price Imbalance as Consecutive Levels of Averages indicator is an advanced technical analysis tool designed to identify and visualize price imbalances in financial markets. Unlike traditional moving average (MA) indicators that update continuously with each new price bar, this indicator employs moving averages calculated over consecutive, non-overlapping historical windows. This unique approach leverages comparative historical data to provide deeper insights into trend strength and potential reversals, offering traders a more nuanced understanding of market dynamics and reducing the likelihood of false signals or fakeouts.
Key Features
Consecutive Rolling Moving Averages: Utilizes three distinct simple moving averages (SMAs) calculated over consecutive, non-overlapping windows to capture different historical segments of price data.
Dynamic Color-Coded Visualization: SMA lines change color and style based on the relationship between the averages, highlighting both extreme and normal market conditions.
Median and Secondary Median Lines: Provides additional layers of price distribution insight during normal trend conditions through the plotting of primary and secondary median lines.
Fakeout Prevention: Filters out short-term volatility and sharp price movements by requiring consistent historical alignment of multiple moving averages.
Customizable Parameters: Offers flexibility to adjust SMA window lengths and line extensions to align with various trading strategies and timeframes.
Real-Time Updates with Historical Context: Continuously recalculates and updates SMA lines based on comparative historical windows, ensuring that the indicator reflects both current and past market conditions.
Inputs & Settings
Rolling Window Lengths:
Window 1 Length (Most Recent) Bars: Number of bars used to calculate the most recent SMA. (Default: 5, Range: 2–300)
Window 2 Length (Preceding) Bars: Number of bars for the second SMA, shifted by Window 1. (Default: 8, Range: 2–300)
Window 3 Length (Third Rolling) Bars: Number of bars for the third SMA, shifted by the combined lengths of Window 1 and Window 2. (Default: 13, Range: 2–300)
Horizontal Line Extension:
Horizontal Line Extension (Bars): Determines how far each SMA line extends horizontally on the chart. (Default: 10 bars, Range: 1–100)
Functionality and Theory
1. Calculating Consecutive Simple Moving Averages (SMAs):
The indicator calculates three SMAs, each based on distinct and consecutive historical windows of price data. This approach contrasts with traditional MAs that continuously update with each new price bar, offering a static view of past trends rather than an ongoing one.
Mean1 (SMA1): Calculated over the most recent Window 1 Length bars. Represents the short-term trend.
Mean1=∑i=1N1CloseiN1
Mean1=N1∑i=1N1Closei
Where N1N1 is the length of Window 1.
Mean2 (SMA2): Calculated over the preceding Window 2 Length bars, shifted back by Window 1 Length bars. Represents the medium-term trend.
\text{Mean2} = \frac{\sum_{i=1}^{N_2} \text{Close}_{i + N_1}}}{N_2}
Where N2N2 is the length of Window 2.
Mean3 (SMA3): Calculated over the third rolling Window 3 Length bars, shifted back by the combined lengths of Window 1 and Window 2 bars. Represents the long-term trend.
\text{Mean3} = \frac{\sum_{i=1}^{N_3} \text{Close}_{i + N_1 + N_2}}}{N_3}
Where N3N3 is the length of Window 3.
2. Determining Market Conditions:
The relationship between the three SMAs categorizes the market condition into either extreme or normal states, enabling traders to quickly assess trend strength and potential reversals.
Extreme Bullish:
Mean3Mean2>Mean1
Mean3>Mean2>Mean1
Indicates a strong and sustained downward trend. SMA lines are colored purple and styled as dashed lines.
Normal Bullish:
Mean1>Mean2andnot in extreme bullish condition
Mean1>Mean2andnot in extreme bullish condition
Indicates a standard upward trend. SMA lines are colored green and styled as solid lines.
Normal Bearish:
Mean1Mean2>Mean1
Mean3>Mean2>Mean1
Normal Bullish:
Mean1>Mean2andnot in Extreme Bullish
Mean1>Mean2andnot in Extreme Bullish
Normal Bearish:
Mean1 Mean2 > Mean3
Visualization: All three SMAs are displayed as gold dashed lines.
Median Lines: Not displayed to maintain chart clarity.
Interpretation: Indicates a strong and sustained upward trend. Traders may consider entering long positions, confident in the trend's strength without the distraction of additional lines.
2. Normal Bullish Condition:
SMAs Alignment: Mean1 > Mean2 (not in extreme condition)
Visualization: Mean1 and Mean2 are green solid lines; Mean3 is gray.
Median Lines: A thin blue dotted median line is plotted between Mean1 and Mean2, with two additional thin blue dashed lines as secondary medians.
Interpretation: Confirms an upward trend while providing deeper insights into price distribution. Traders can use the median and secondary median lines to identify optimal entry points and manage risk more effectively.
3. Extreme Bearish Condition:
SMAs Alignment: Mean3 > Mean2 > Mean1
Visualization: All three SMAs are displayed as purple dashed lines.
Median Lines: Not displayed to maintain chart clarity.
Interpretation: Indicates a strong and sustained downward trend. Traders may consider entering short positions, confident in the trend's strength without the distraction of additional lines.
4. Normal Bearish Condition:
SMAs Alignment: Mean1 < Mean2 (not in extreme condition)
Visualization: Mean1 and Mean2 are red solid lines; Mean3 is gray.
Median Lines: A thin blue dotted median line is plotted between Mean1 and Mean2, with two additional thin blue dashed lines as secondary medians.
Interpretation: Confirms a downward trend while providing deeper insights into price distribution. Traders can use the median and secondary median lines to identify optimal entry points and manage risk more effectively.
Customization and Flexibility
The Price Imbalance as Consecutive Levels of Averages indicator is highly adaptable, allowing traders to tailor it to their specific trading styles and market conditions through adjustable parameters:
SMA Window Lengths: Modify the lengths of Window 1, Window 2, and Window 3 to capture different historical trend segments, whether focusing on short-term fluctuations or long-term movements.
Line Extension: Adjust the horizontal extension of SMA and median lines to align with different trading horizons and chart preferences.
Color and Style Preferences: While default colors and styles are optimized for clarity, traders can customize these elements to match their personal chart aesthetics and enhance visual differentiation.
This flexibility ensures that the indicator remains versatile and applicable across various markets, asset classes, and trading strategies, providing valuable insights tailored to individual trading needs.
Conclusion
The Price Imbalance as Consecutive Levels of Averages indicator offers a comprehensive and innovative approach to analyzing price trends and imbalances within financial markets. By utilizing three consecutive, non-overlapping SMAs and incorporating median lines during normal trend conditions, the indicator provides clear and actionable insights into trend strength and price distribution. Its unique design leverages comparative historical data, distinguishing it from traditional moving averages and enhancing its utility in identifying genuine market movements while minimizing false signals. This dynamic and customizable tool empowers traders to refine their technical analysis, optimize their trading strategies, and navigate the markets with greater confidence and precision.

Donchian Cloud-V1The Donchian Cloud-V1 is a technical analysis indicator inspired by the Ichimoku Cloud, but with a twist. It utilizes two Donchian Channel midline calculations to create a cloud-like price zone. This indicator aims to help traders identify potential areas of support and resistance, and also suggests that trades should be avoided when prices are within the cloud.
How it Works?
The Donchian Cloud-V1 calculates two Donchian Channel midlines:
Fast Donchian Channel: This midline is based on a shorter period, making it more responsive to price changes.
Slow Donchian Channel: This midline is based on a longer period, providing a smoother and more stable cloud formation.
The upper and lower bands of the traditional Donchian Channels are discarded, and the midlines become the cloud's upper and lower boundaries.
Interpretation
Price Above the Cloud: A price move above the cloud can be interpreted as a bullish signal, suggesting potential upward momentum.
Price Below the Cloud: A price move below the cloud can be interpreted as a bearish signal, suggesting potential downward momentum.
Price Within the Cloud: The indicator advises against taking any trades when the price is within the cloud itself, as the market may be unclear or ranging.
Benefits of Using the Donchian Cloud-V1
Visually Appealing: The cloud can provide a clear and concise view of potential support and resistance zones.
Customizable: The lengths of the fast and slow Donchian Channels can be adjusted to suit your trading style and preferred timeframe.
Complements Other Indicators: The Donchian Cloud-V1 can be used in conjunction with other technical indicators to strengthen trade signals.
Limitations to Consider
Lagging Indicator: Like many technical indicators, the Donchian Cloud-V1 is based on past price data and may not always perfectly predict future price movements.
False Signals: The cloud can generate false signals, especially in volatile markets.
Not a Standalone Strategy: The Donchian Cloud-V1 should ideally be used alongside other trading strategies and risk management techniques.
The Donchian Cloud-V1 is a valuable tool for traders who want to identify potential support and resistance zones and avoid making trades during periods of market uncertainty. Remember, it's important to backtest and paper trade any indicator before using it with real capital.
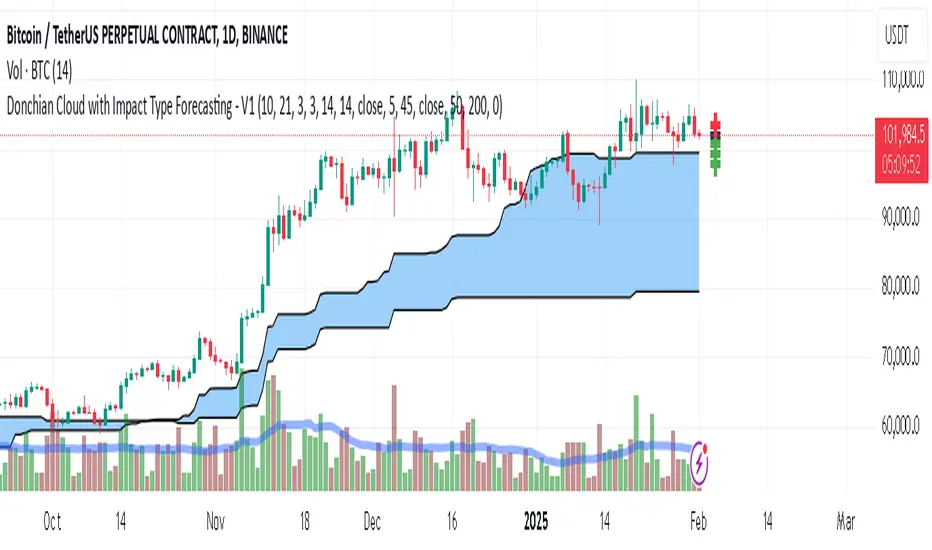
Rosiz Support 1### Description of the Custom Indicator: MACD + CMF + MOM
This custom indicator combines three powerful technical analysis tools: **MACD (Moving Average Convergence Divergence)**, **CMF (Chaikin Money Flow)**, and **MOM (Momentum)**, to provide a comprehensive view of market trends, momentum, and money flow in a single pane. Here's what each component offers:
---
#### 1. **MACD (Moving Average Convergence Divergence)**
The **MACD** is a trend-following momentum indicator that shows the relationship between two moving averages of an asset’s price.
- **Purpose**: Identifies trend direction and momentum strength.
- **Key Components**:
- **MACD Line**: Difference between the fast and slow exponential moving averages (EMA).
- **Signal Line**: A smoothed moving average of the MACD line, acting as a trigger for buy/sell signals.
- **Histogram**: The difference between the MACD line and the signal line. Positive values indicate bullish momentum, while negative values indicate bearish momentum.
- **Usage**: Look for crossovers (MACD crossing the signal line) to identify potential trend changes.
---
#### 2. **CMF (Chaikin Money Flow)**
The **CMF** measures the volume-weighted average of accumulation and distribution over a specific period. It shows whether money is flowing into or out of an asset.
- **Purpose**: Detects buying or selling pressure based on price and volume.
- **Key Components**:
- **Positive CMF**: Indicates that the asset is being accumulated (buying pressure).
- **Negative CMF**: Indicates that the asset is being distributed (selling pressure).
- **Usage**: Values above 0 suggest bullish strength, while values below 0 suggest bearish strength.
---
#### 3. **MOM (Momentum)**
The **Momentum Indicator** measures the rate of change of an asset's price over a specified period. It helps traders identify the speed of price movements.
- **Purpose**: Highlights the strength and direction of price momentum.
- **Key Components**:
- **Momentum Line**: Positive values indicate upward momentum, while negative values indicate downward momentum.
- **Usage**: A rising momentum line suggests strengthening price trends, while a falling line indicates weakening trends.
---
### Benefits of Combining These Indicators:
1. **Trend Confirmation**: MACD provides a clear picture of trend direction and potential reversals.
2. **Volume-Based Insights**: CMF adds a layer of confirmation by analyzing money flow based on price and volume.
3. **Momentum Analysis**: MOM reveals the speed and strength of price movements, helping traders confirm breakouts or trend exhaustion.
4. **Enhanced Decision-Making**: The combination of these indicators allows traders to make more informed decisions by evaluating different aspects of market behavior in one pane.
---
### How to Use:
- **Identify Trends**: Use MACD to identify overall trend direction and reversals.
- **Confirm Momentum**: Check MOM to validate the strength of the trend.
- **Gauge Buying/Selling Pressure**: Refer to CMF to confirm whether the price movement is backed by accumulation or distribution.
- **Entry/Exit Points**: Look for MACD crossovers, CMF shifts above/below zero, and momentum changes to refine entry and exit strategies.
This powerful tool integrates the strengths of three indicators, making it ideal for traders looking to analyze market conditions holistically and improve their timing and accuracy.