The Ultimate Price Action & SMC Toolkit: Delta Zones, MTF IndicaThis is an All-in-One Pine Script indicator that seamlessly combines three advanced trading concepts:
Delta Zones (Wick Pressure): Uses Standard Deviation to identify extreme buying/selling pressure within the candlestick wicks, signaling potential stop hunts or liquidity absorption. These are plotted as critical Buy/Sell Boxes.
Multi-Timeframe (MTF) Indicators: Confirms signals using popular indicators (RSI, CCI, Stochastic) calculated from a separate, user-selected Timeframe or the current chart timeframe. This adds a crucial layer of context and momentum confirmation.
Smart Money Concepts (SMC): Automatically detects and plots Orderblocks (OBs) and Breaker Blocks based on confirmed Market Structure Breaks (MSB). This helps locate high-probability Supply and Demand zones.
Key Features:
Integrated plotting for combined indicator signals.
Flexible MTF selection for all standard oscillators.
Automatic Swing High/Low detection for SMC analysis.
Comprehensive Alert system for Delta Pressure, Orderblocks, and Breaker Zones.
Option 2: Focusing on SMC and Flow (Concise)
Title: "SMC Delta Flow: Advanced Orderblock, Breaker, and Wick Reversal Zones with MTF Filter."
Description:
An essential tool for sophisticated SMC traders. This indicator provides high-precision zones:
Smart Money Blocks: Plots Orderblocks and Breaker Blocks following Market Structure Shifts (MSS). Includes a "Chop Control" feature to invalidate re-used or weak Breakers.
Delta Reversal Zones: Pinpoints candles showing extreme high-deviation wick pressure. Use these zones to confirm reversals and identify precise entry points where liquidity was captured.
MTF Confirmation: Incorporates configurable Multi-Timeframe (MTF) RSI, CCI, and Stochastic indicators to act as a momentum filter or confirmation tool.
Add this indicator to unify your analysis of Liquidity, Market Structure, and Momentum on a single chart!
SMC, SmartMoneyConcepts, Orderblock, BreakerBlock, MTF, MultiTimeframe, Delta, Wick, Liquidity, PriceAction, RSI, Stochastic, CCI
在腳本中搜尋"liquidity"

cd_sfp_CxGeneral:
This indicator is designed to assist users who trade the Swing Failure Pattern ( SFP ).
In technical literature (various definitions exist), an SFP is a situation where the price violates a previous swing level but fails to close beyond that level.
• (Liquidity Sweep)
• (Buyer or seller dominance)
• (Stop hunt)
• (Turtle Soup)
The general strategy is built upon seeking trade opportunities after an SFP is formed and conviction is established that the market direction has changed.
Components used to gather confirmation:
• Determining Bias: Periodic SAR
• Obtaining Breakout/Reversal Confirmation: Change in State Delivery (CISD)
• Defining the Buyer/Seller Block (Supply/Demand Zones): Mitg Blocks (Mitigation Blocks), FVG (Fair Value Gaps), and Standard Deviation Projection
• Key Levels: Previous HTF (Higher Time Frame) levels
• Setting Targets: Standard Deviation Projection
• Trade Management: Anchored VWAP and opposing blocks
• Time-Based Context: Session Killzone times
• Notifications: An alarm/alert system will be utilized to stay informed.
________________________________________
Details:
Swing and Swing Failure Pattern:
Swing Sweep Types (Liquidity Sweep):
1. Single
2. Consecutive (The liquidity of the entity that swept the liquidity is being swept)
Bias Determination
We need to filter out the numerous SFPs that occur across all time frames. Our first strong filter will be the Bias. We will only look for trades aligned with our bias.
We will use Periodic SAR (Stop and Reverse) to determine the bias. We compare the price with the SAR value from a Higher Time Frame than the one we are trading on.
• Price > SAR => Bullish Bias
• Price < SAR => Bearish Bias
Depending on the pair, H1 SAR may be chosen for scalp trades, and Daily/Weekly SAR for intraday and swing trades.
Key Levels
Strategies looking for trades after a liquidity grab generally state that the sweep / stop hunt movement should occur at a significant price level.
The most fundamental Key Level levels are (User can customize):
• Previous Week High & Low
• Previous Day High & Low
• Previous H4 High & Low
• Previous H1 High & Low
• Asia Killzone High & Low
• London Killzone High & Low
• New York Killzone High & Low
• Monday Range High & Low values
We will prefer SFP formations that occur when these levels are swept. When Key Levels are violated, an information label appears on the screen.
Blocks / Zones
To strengthen our hand, we will use three types of blocks/zones, either with Key Levels or separately. When an SFP structure is formed in these areas (along with bias and breakout confirmation), our expectation is for the price to continue in our desired direction. These regions are:
1. Mitigation Blocks (Mtg)
o (Details can be found in the cd_VWAP_mtg_Cx indicator)
o In short: A second candle, following a bullish candle, crosses its high but fails to close above it. We call this a sweep / SFP. When the price, which was expected to go to the low, instead makes a new high/close, an Mtg block is formed. (Buyers are dominant)
2. FVGs (Fair Value Gaps)
o We use classic FVG structures.
3. Standard Deviation Projection Boxes
o When we get an SFP structure + breakout confirmation (CISD), we use the Standard Deviation Projection to determine our profit-taking and take-profit levels.
o Based on the idea that the price often respects the range between -2 and -2.5 of the projection values, we box this range and use it as our area of interest. (Our expectation is for the price to reverse after reaching this target).
o Let's mark it on the chart.
Confirmation
To summarize what has been explained so far: we look for the price to form an SFP structure in levels/zones we deem important, aligned with our bias, and for the breakout to be confirmed with a CISD.
No single component is strong on its own, but the success rate increases when they occur together.
We observe the following as additional confirmation along with the CISD: a new Mtg block forming in the direction of the breakout, high-volume movement (with FVG and a large body), and respect for VWAPs, the resistance/support line, and the defense block.
Additional Confirmations with Breakouts:
• Defence block, new mtg and VWAP
• Resistance / Support Line:
Indicator Signals
The indicator marks all formed sweeps, selected key levels, blocks, the projection, and CISD confirmations on the screen. The candle where the CISD confirmation occurs is indicated by an arrow.
• Arrows with double short lines signify a CISD that follows an SFP occurring at a Key Level.
• All other CISD candle indications are shown with single-line arrows.
Trade Management
When selecting profit targets in trades (preferably), the projection, opposing blocks, and structures that have formed are taken into account. Do not neglect to look at the structures that have formed against you when entering a trade.
Menu Settings:
• For Mtg blocks, the trading timeframe or a higher timeframe can be selected.
• FVGs formed in the current timeframe are displayed when the price creates an SFP (in "Fvg" option).
• Deviation boxes are displayed when the price creates an SFP (in box).
• The SAR HTF setting (H1) for scalp trades may vary depending on the pair. Users trying trades on higher timeframes should increase the HTF setting.
o Example: If you are looking for a trade with an SFP structure on H1, the SAR HTF setting should be H4 or higher.
• VWAP lines are refreshed starting from the candle that executed the sweep when the price forms an SFP. The only setting to adjust is the source selection setting (hlc3 is selected).
• Time frames and Killzone / Special Zone settings for Key Levels can be changed/should be checked.
Alarms / Alerts:
The conditions that will trigger an alert can be selected from the menu.
• To receive an alert aligned with the bias, the "Alignment with bias" checkbox must be selected.
• The alert should be set on the timeframe where you plan to enter the trade.
• The display options do not affect the alarm conditions. (Example: FVGs are monitored even when the menu selection is "off").
• If the necessary conditions are met, the alarm is triggered on the new candle that opens after the CISD confirmation.
• The alarm will not be triggered more than once at the same Key Level.
The user can preferably select alerts:
• Bias-aligned or Bias-independent
• Sweep (without waiting for CISD)
• Sweep + CISD (without looking for other conditions)
• Sweep + Key Level + CISD (the swept level is a Key Level)
• Sweep + Mtg / Fvg / Dev. + CISD (SFP formed in any of the blocks)
• Sweep + Mtg + CISD (SFP formed in the Mtg block)
• Sweep + Fvg + CISD (SFP formed inside the FVG)
• Sweep + Deviation Box + CISD (SFP formed inside the Dev. Box)
• Sweep + Key Level + Mtg / Fvg / Dev. + CISD (SFP formed simultaneously at a Key Level and any of the blocks)
Trade Example:
• Conditions: Bias-aligned + Sweep + Mtg/Fvg/Dev (at least one) + CISD
• Extra Confirmations: Respect for the Defense Block + Respect for VWAP
• Target (TP): Projection between -2 and -2.5
I welcome your thoughts and suggestions regarding my indicator, which I believe will be successful in the long run by adhering to uncompromising risk management and a strict trading plan.
Happy Trading!

Quantura - Session High/LowIntroduction
“Quantura – Session High/Low” is a professional-grade session mapping indicator that automatically identifies and visualizes the highs, lows, and ranges of key global trading sessions — London, New York, and Asia. It helps traders understand when and where liquidity tends to accumulate, allowing for better market structure analysis and session-based strategy alignment.
Originality & Value
This indicator unifies the three most influential global sessions into a single, adaptive visualization tool. Unlike typical session indicators, it dynamically updates live session highs and lows in real time while marking session boundaries and transitions. Its multi-session management system allows for immediate recognition of overlapping liquidity zones — a crucial feature for institutional and intraday traders.
The value and originality come from:
Real-time tracking of session highs, lows, and developing ranges.
Simultaneous visualization of multiple global sessions.
Optional vertical range lines for clearer visual segmentation.
Customizable session times, colors, and time zone offset for global accuracy.
Automatically extending and updating lines as each session progresses.
Functionality & Core Logic
Detects the start and end of each trading session (London, New York, Asia) using built-in time logic and user-defined UTC offsets.
Initializes session-specific high and low variables at the start of each new session.
Continuously updates session high/low levels as new candles form.
Draws color-coded horizontal lines for each session’s high and low.
Optionally adds vertical dotted lines to visually connect session range extremes.
Locks each session’s range once it ends, preserving historical structure for review.
Parameters & Customization
New York Session: Enable/disable, customize time (default 15:30–21:30), and set color.
London Session: Enable/disable, customize time (default 09:00–16:30), and set color.
Asia Session: Enable/disable, customize time (default 02:30–08:00), and set color.
Vertical Line: Toggle dotted vertical lines connecting session high and low levels.
UTC Offset: Adjust session timing to align with your chart’s local time zone.
Visualization & Display
Each session is color-coded for quick identification (default: blue for London, red for New York, green for Asia).
Horizontal lines track evolving session highs and lows in real time.
Once a session closes, the lines remain fixed to mark historical range boundaries.
Vertical dotted lines (optional) visually connect the session’s high and low for clarity.
Supports full overlay display without interfering with other technical indicators.
Use Cases
Identify liquidity zones and range extremes formed during active trading sessions.
Observe session overlaps (London–New York) to anticipate volatility spikes.
Combine with volume or market structure tools for session-based confluence.
Track how price interacts with prior session highs/lows to detect potential reversals.
Analyze session-specific performance patterns for algorithmic or discretionary systems.
Limitations & Recommendations
The indicator is designed for intraday analysis and may not provide meaningful output on daily or higher timeframes.
Adjust session times and UTC offset based on your broker’s or exchange’s timezone.
Does not provide trading signals — it visualizes session structure only.
Combine with liquidity and volatility indicators for full contextual understanding.
Markets & Timeframes
Compatible with all asset classes — including crypto, forex, indices, and commodities — and optimized for intraday timeframes (1m–4h). Particularly useful for traders analyzing session overlaps and volatility transitions.
Author & Access
Developed 100% by Quantura. Published as a Open-source script indicator. Access is free.
Compliance Note
This description fully complies with TradingView’s Script Publishing Rules and House Rules . It provides a detailed explanation of functionality, parameters, and realistic use cases without making any performance or predictive claims.

Clean Market Structures This indicator marks out the highs and lows on the chart, allowing traders to easily follow the market structure and identify potential liquidity zones.
Highs are plotted when an up candle is followed by a down candle, marking the highest wick of that two-candle formation.
Lows are plotted when a down candle is followed by an up candle, marking the lowest wick of that two-candle formation.
These levels often act as liquidity pools, since liquidity typically rests above previous highs and below previous lows .
By highlighting these areas, the indicator helps traders visualize where price may seek liquidity and react, making it useful for structure-based and liquidity-driven trading strategies.

Session Highs and LowsThis indicator highlights the New York, London, and Asian trading sessions — plotting each session’s highs and lows directly on your chart to help visualize intraday ranges and liquidity levels.
⸻
✨ Features
• Session Range Visualization
Automatically marks the high and low of each trading session with colored lines.
This makes it easy to identify where price expanded, consolidated, or built liquidity during each market phase.
• Session Background Zones (Optional)
Toggle background fills to highlight active sessions for clearer visual separation of NY, London, and Asian trading hours.
• Customizable Settings
• Enable or disable each session independently
• Adjust session times and colors
• Choose whether to fill session backgrounds
• Timezone Aware
All sessions are aligned to New York time by default, ensuring consistent mapping across instruments.
⸻
🎯 Use Case
A perfect tool for traders who track session-based liquidity, breaks of structure, or session-to-session continuity.
Quickly spot the Asian range, London expansion, and New York reversal windows — key components in intraday strategy development.
⸻
⚙️ Inputs
• Toggle sessions: NY / London / Asian
• Background fill on/off
• Label color customization
• Adjustable session times
⸻
📈 Why Use It
Understanding where each session establishes its range high and low provides critical context for liquidity grabs, session overlaps, and structural shifts throughout the day.
This simple yet powerful visual map enhances precision for ICT-style, smart money, or price action-based trading models.

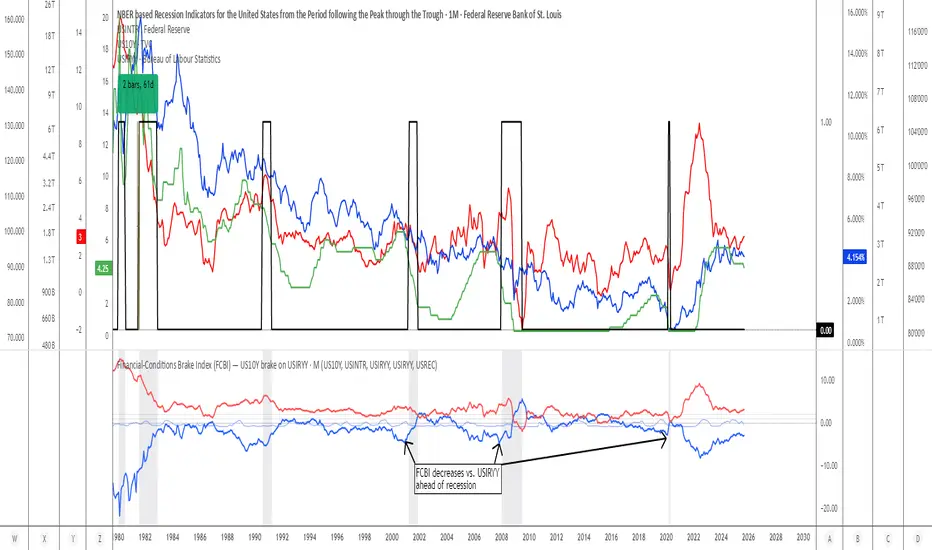
Financial-Conditions Brake Index (FCBI) — US10Y brake on USIRYYFinancial-Conditions Brake Index (FCBI) – US10Y Brake on USIRYY
Concept
The Financial-Conditions Brake Index (FCBI) measures how U.S. long-term yields (US10Y) interact with the Federal Funds Rate (USINTR) and inflation (CPI YoY) to shape real-rate conditions (USIRYY).
It visualizes whether the bond market is tightening or loosening overall financial conditions relative to the Federal Reserve’s policy stance.
Formula
FCBI = (US10Y) − (USINTR) − (CPI YoY)
How It Works
The FCBI expresses the difference between the long-term yield curve and short-term policy rates, adjusted for inflation. It shows whether the long end of the curve is amplifying or counteracting the Fed’s stance.
FCBI > +2 → Strong brake → Long yields remain elevated despite easing → tight conditions → recession delayed.
FCBI +1 to +2 → Mild brake → Financial transmission slower; lag ≈ 12–18 months.
FCBI 0 to +1 → Neutral → Typical early post-cut environment.
FCBI < 0 → Accelerator → Long yields and inflation expectations falling → liquidity flows freely → recession often follows within 6–14 months.
How to Read the Chart
Blue line (FCBI) shows the strength of the financial brake.
Red line (USIRYY) represents the real yield baseline.
Recession shading (gray) marks NBER recessions for comparison.
FCBI < USIRYY → Brake engaged → financial conditions tighter than real-rate baseline.
FCBI > USIRYY → Brake released → long end easing faster than policy → liquidity surge → late-cycle setup.
Historically, U.S. recessions begin on average about 14 months after the first Fed rate cut, and a decline of the FCBI below zero often precedes that window.
Practical Use
Use the FCBI to identify when policy transmission is blocked (brake engaged) or flowing (brake released).
Cross-check with yield-curve inversions, Fed policy shifts, and inflation expectations to estimate macro timing windows.
Current Example (Oct 2025)
FCBI ≈ −3.1, USIRYY ≈ +3.0 → Brake still engaged.
Once FCBI rises above USIRYY and crosses positive, it signals the “brake released” phase — historically the final liquidity surge before a U.S. recession.
Summary
FCBI shows how tight the brake is.
USIRYY shows how fast the car is moving.
When FCBI rises above USIRYY, the brake is released — liquidity accelerates and the historical recession countdown begins.
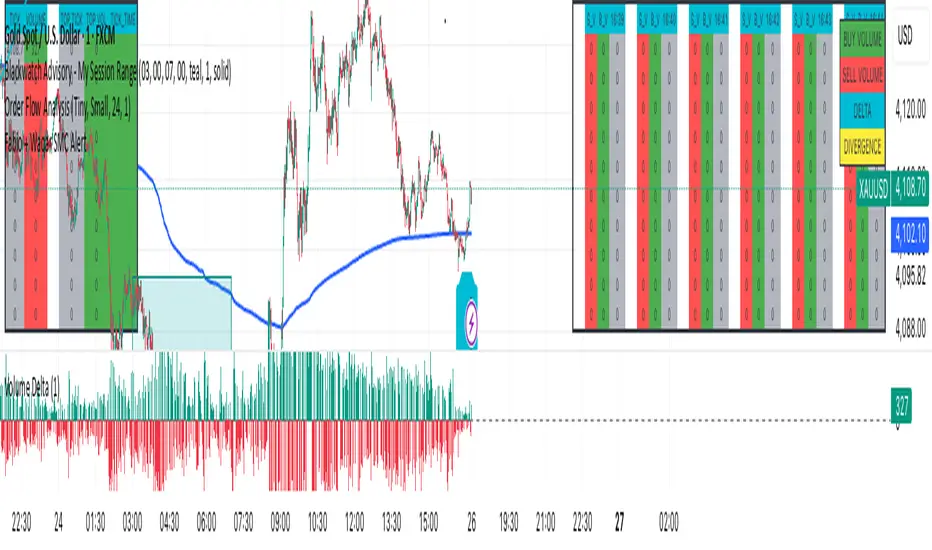
F & W SMC Alerthis script is a custom TradingView indicator designed to combine elements of a trend‑following VWAP approach (inspired by the “Fabio” strategy) with a smart‑money‑concepts framework (inspired by Waqar Asim). Here’s what it does:
* **Directional bias:** It calculates a 15‑minute VWAP and compares the current 15‑minute close to it. When price is above the 15‑minute VWAP, the script assumes a long bias; when below, a short bias. This reflects the trend‑following aspect of the Fabio strategy.
* **Liquidity sweeps:** Using recent pivot highs and lows on the current timeframe, it identifies when price takes out a recent high (for potential longs) or low (for potential shorts). This represents a “liquidity sweep” — a fake breakout that collects stops and signals a possible reversal or continuation.
* **Break of structure (BOS):** After a sweep, the script confirms that price is breaking away from the swept level (i.e., higher than recent highs for longs or lower than recent lows for shorts). This BOS confirmation helps avoid false signals.
* **Entry filters:** For a long setup, the bias must be long, there must be a liquidity sweep followed by a BOS, and price must reclaim the current‑timeframe VWAP. For a short setup, the opposite conditions apply (short bias, sweep + BOS to the downside, and price rejecting the VWAP).
* **Alerts and plot:** It provides two alert conditions (“Fabio‑Waqar Long Setup” and “Fabio‑Waqar Short Setup”) that you can attach to notifications. It also plots the intraday VWAP on your chart for visual reference.
In short, this script watches for a confluence of trend direction, liquidity sweeps, structural shifts, and VWAP reclaim/rejection, and then notifies you when those conditions align. You can use it as an alerting tool to identify high‑probability setups based on these combined strategies.

Fabio + Waqar SMC AlertThis script is a custom TradingView indicator designed to combine elements of a trend‑following VWAP approach (inspired by the “Fabio” strategy) with a smart‑money‑concepts framework (inspired by Waqar Asim). Here’s what it does:
* **Directional bias:** It calculates a 15‑minute VWAP and compares the current 15‑minute close to it. When price is above the 15‑minute VWAP, the script assumes a long bias; when below, a short bias. This reflects the trend‑following aspect of the Fabio strategy.
* **Liquidity sweeps:** Using recent pivot highs and lows on the current timeframe, it identifies when price takes out a recent high (for potential longs) or low (for potential shorts). This represents a “liquidity sweep” — a fake breakout that collects stops and signals a possible reversal or continuation.
* **Break of structure (BOS):** After a sweep, the script confirms that price is breaking away from the swept level (i.e., higher than recent highs for longs or lower than recent lows for shorts). This BOS confirmation helps avoid false signals.
* **Entry filters:** For a long setup, the bias must be long, there must be a liquidity sweep followed by a BOS, and price must reclaim the current‑timeframe VWAP. For a short setup, the opposite conditions apply (short bias, sweep + BOS to the downside, and price rejecting the VWAP).
* **Alerts and plot:** It provides two alert conditions (“Fabio‑Waqar Long Setup” and “Fabio‑Waqar Short Setup”) that you can attach to notifications. It also plots the intraday VWAP on your chart for visual reference.
In short, this script watches for a confluence of trend direction, liquidity sweeps, structural shifts, and VWAP reclaim/rejection, and then notifies you when those conditions align. You can use it as an alerting tool to identify high‑probability setups based on these combined strategies.
Smart Structure Pro - Market Structure & Smart Money Concepts═══════════════════════════════════════════════════════════════════════════════
SMART STRUCTURE PRO
═══════════════════════════════════════════════════════════════════════════════
A comprehensive market structure analysis tool that identifies institutional trading
patterns and smart money concepts for improved trade timing and decision-making.
═══════════════════════════════════════════════════════════════════════════════
📊 WHAT IT DOES
═══════════════════════════════════════════════════════════════════════════════
This indicator automatically detects and visualizes key market structure elements:
🔹 BOS (Break of Structure)
- Identifies trend continuation patterns
- Marks when price breaks above previous highs (bullish) or below previous lows (bearish)
- Confirms trend strength and momentum
🔹 CHoCH (Change of Character)
- Detects potential trend reversals
- Alerts when market structure shifts from bullish to bearish or vice versa
- Helps identify early reversal opportunities
🔹 Order Blocks
- Highlights institutional entry zones
- Identifies the last opposite candle before a structure break
- Shows areas where smart money likely entered positions
🔹 Fair Value Gaps (FVG)
- Detects price imbalances and inefficiencies
- Shows areas where price moved rapidly leaving gaps
- Often act as support/resistance when retested
🔹 Liquidity Zones
- Marks swing high and low levels
- Identifies areas where stop losses likely cluster
- Shows potential stop hunt and liquidity grab zones
═══════════════════════════════════════════════════════════════════════════════
🎯 HOW TO USE
═══════════════════════════════════════════════════════════════════════════════
BULLISH SETUP:
1. Wait for Bullish CHoCH (trend reversal signal) or BOS ↑ (continuation)
2. Look for price to pull back into an Order Block or Fair Value Gap
3. Enter long when price bounces from these zones
4. Place stop loss below the Order Block
5. Target the next liquidity zone or resistance level
BEARISH SETUP:
1. Wait for Bearish CHoCH (trend reversal signal) or BOS ↓ (continuation)
2. Look for price to retrace into an Order Block or Fair Value Gap
3. Enter short when price rejects from these zones
4. Place stop loss above the Order Block
5. Target the next liquidity zone or support level
DASHBOARD INTERPRETATION:
• Trend: Current market direction (Bullish/Bearish)
• Volume: Confirmation strength (High volume = stronger signals)
• Signal: Latest structure break detected
• Key High/Low: Critical levels for the current trend
• Position: Price location (Premium = expensive, Discount = cheap)
═══════════════════════════════════════════════════════════════════════════════
⚙️ SETTINGS GUIDE
═══════════════════════════════════════════════════════════════════════════════
STRUCTURE DETECTION:
• Pivot Length (Default: 10)
- Lower values = More signals but potentially weaker
- Higher values = Fewer signals but stronger/more reliable
- Recommended: 8-12 for intraday, 10-15 for higher timeframes
• Structure Line Extension
- Visual preference for how far lines extend
- Does not affect signal detection
SMART MONEY CONCEPTS:
• Order Block Extension: How long OB boxes remain visible
• FVG Extension: How long gap boxes remain visible
• Min FVG Size: Filter out small gaps (0 = show all)
- Set to 10-20% to reduce noise
- Set to 0 to see all gaps
VOLUME FILTER:
• Volume Confirmation (Recommended: ON)
- Filters weak signals without volume support
- Reduces false breakouts
• Volume Multiplier (Default: 1.5)
- Higher = Stricter filtering (fewer but stronger signals)
- Lower = More signals (but may include weak ones)
DISPLAY:
• Dashboard: Toggle information panel
• Trend Background: Subtle color tint showing current trend
• Dashboard Position: Choose corner placement
═══════════════════════════════════════════════════════════════════════════════
🔔 ALERTS
═══════════════════════════════════════════════════════════════════════════════
Available alert conditions:
✓ Bullish BOS - Uptrend continuation confirmed
✓ Bearish BOS - Downtrend continuation confirmed
✓ Bullish CHoCH - Reversal to uptrend detected
✓ Bearish CHoCH - Reversal to downtrend detected
✓ Structure Break - Any significant market structure change
To set up alerts:
1. Click the "⏰" alert icon
2. Select "Smart Structure Pro"
3. Choose your desired condition
4. Configure notification method
5. Click "Create"
═══════════════════════════════════════════════════════════════════════════════
⚠️ IMPORTANT DISCLOSURES
═══════════════════════════════════════════════════════════════════════════════
REPAINTING BEHAVIOR:
• Pivot points WILL repaint until confirmed (this is by design and unavoidable)
• Structure breaks (BOS/CHoCH) use CLOSED candles and do NOT repaint after confirmation
• Order Blocks and FVGs are drawn on confirmed signals and do NOT repaint
• All signals wait for candle close before triggering
BEST PRACTICES:
• Use on higher timeframes (15min+) for more reliable signals
• Combine with other analysis (support/resistance, volume profile, etc.)
• Wait for candle close confirmation before acting on signals
• Use proper risk management - this is not a standalone trading system
• Backtest on your preferred instrument and timeframe
PERFORMANCE:
• Limited to 100 boxes, 100 lines, 100 labels for optimal performance
• Older objects automatically removed as new ones appear
• Works on all markets (Forex, Crypto, Stocks, Indices, Commodities)
═══════════════════════════════════════════════════════════════════════════════
📚 CONCEPTS EXPLAINED
═══════════════════════════════════════════════════════════════════════════════
MARKET STRUCTURE:
Market structure refers to the pattern of price movements creating swing highs
and lows. Understanding structure helps identify trend direction and potential
reversal points.
SMART MONEY CONCEPTS:
These are trading techniques based on tracking institutional order flow and
understanding where large players (banks, funds, institutions) enter and exit
positions.
ORDER BLOCKS:
The last opposing candle before a strong directional move. Institutions often
leave unfilled orders in these zones, which can act as support/resistance when
price returns.
FAIR VALUE GAPS:
Areas where price moved so quickly that it left an imbalance. These gaps often
get "filled" as price returns to find equilibrium, creating trading opportunities.
═══════════════════════════════════════════════════════════════════════════════
🎓 EDUCATIONAL VALUE
═══════════════════════════════════════════════════════════════════════════════
This indicator helps traders:
✓ Understand market structure mechanics
✓ Identify institutional trading patterns
✓ Improve trade timing and entry precision
✓ Recognize trend continuation vs reversal
✓ Learn smart money concepts through visualization
═══════════════════════════════════════════════════════════════════════════════
📋 TECHNICAL DETAILS
═══════════════════════════════════════════════════════════════════════════════
• Version: 1.0.0
• Pine Script Version: 5
• Indicator Type: Overlay
• No Repainting: Structure breaks use confirmed candles
• Performance Optimized: Limited drawing objects
• Works On: All markets and timeframes
• Alerts: Yes, fully customizable
═══════════════════════════════════════════════════════════════════════════════
👤 AUTHOR
═══════════════════════════════════════════════════════════════════════════════
Created by: Zakaria Safri
Original Work: All code and concepts are original implementations
Based On: ICT (Inner Circle Trader) educational concepts
License: © 2024 Zakaria Safri - Personal Use Only
═══════════════════════════════════════════════════════════════════════════════
⚖️ DISCLAIMER
═══════════════════════════════════════════════════════════════════════════════
This indicator is for educational and informational purposes only. It does not
constitute financial advice. Trading involves substantial risk of loss. Past
performance does not guarantee future results. Always conduct your own research
and consult with a licensed financial advisor before making trading decisions.
The author is not responsible for any losses incurred from using this indicator.
═══════════════════════════════════════════════════════════════════════════════
If you find this indicator helpful, please:
👍 Like and favorite
⭐ Leave a review
📢 Share with other traders
💬 Comment with feedback or suggestions
Happy Trading! 📈

US30 Quarter Levels (125-point grid) by FxMogul🟦 US30 Quarter Levels — Trade the Index Like the Banks
Discover the Dow’s hidden rhythm.
This indicator reveals the institutional quarter levels that govern US30 — spaced every 125 points, e.g. 45125, 45250, 45375, 45500, 45625, 45750, 45875, 46000, and so on.
These are the liquidity magnets and reaction zones where smart money executes — now visualized directly on your chart.
💼 Why You Need It
See institutional precision: The Dow respects 125-point cycles — this tool exposes them.
Catch reversals before retail sees them: Every impulse and retracement begins at one of these zones.
Build confluence instantly: Perfectly aligns with your FVGs, OBs, and session highs/lows.
Trade like a professional: Turn chaos into structure, and randomness into rhythm.
⚙️ Key Features
Automatically plots US30 quarter levels (…125 / …250 / …375 / …500 / …625 / …750 / …875 / …000).
Color-coded hierarchy:
🟨 xx000 / xx500 → major institutional levels
⚪ xx250 / xx750 → medium-impact levels
⚫ xx125 / xx375 / xx625 / xx875 → intraday liquidity pockets
Customizable window size, label spacing, and line extensions.
Works across all timeframes — from 1-minute scalps to 4-hour macro swings.
Optimized for clean visualization with no clutter.
🎯 How to Use It
Identify liquidity sweeps: Smart money hunts stops at these quarter zones.
Align structure: Combine with session opens, order blocks, or FVGs.
Set precision entries & exits: Trade reaction-to-reaction with tight risk.
Plan daily bias: Watch how New York respects these 125-point increments.
🧭 Designed For
Scalpers, day traders, and swing traders who understand that US30 doesn’t move randomly — it moves rhythmically.
Perfect for traders using ICT, SMC, or liquidity-based frameworks.
⚡ Creator’s Note
“Every 125 points, the Dow breathes. Every 1000, it shifts direction.
Once you see the rhythm, you’ll never unsee it.”
— FxMogul

USDJPY Fair Value Gap + Session Strategy🎯 Overview
This strategy combines Fair Value Gaps (FVGs) with session-based order flow analysis, specifically optimized for USDJPY. It identifies price inefficiencies left behind by institutional order flow during high-volatility trading sessions, offering a modern alternative to traditional lagging indicators.
🔬 What Are Fair Value Gaps?
Fair Value Gaps represent areas where aggressive institutional buying or selling created "gaps" in the market structure:
Bullish FVG: Price moves up so aggressively that it leaves unfilled buy orders behind
Bearish FVG: Price moves down so quickly that it leaves unfilled sell orders behind
Research shows approximately 80% of FVGs get "filled" (price returns to the gap) within 20-60 bars, making them highly predictable trading zones.
(see the generated image above)
(see the generated image above)
FVG Detection Logic:
text
// Bullish FVG: Gap between high and current low
bullishFVG = low > high and high > high
// Bearish FVG: Gap between low and current high
bearishFVG = high < low and low < low
🌏 Session-Based Trading
Why Sessions Matter for USDJPY
(see the generated image above)
Tokyo Session (00:00-09:00 UTC)
Highest volatility during first hour (00:00-01:00 UTC)
Average movement: 51-60 pips
Best for breakout strategies
London/NY Overlap (13:00-16:00 UTC)
Maximum liquidity and institutional participation
Tightest spreads and most reliable FVG formations
Optimal for continuation trades
Monday Premium Effect
USDJPY moves 120+ pips on Mondays due to weekend positioning
Enhanced FVG formation during session opens
📊 Strategy Components
(see the generated image above)
1. Fair Value Gap Detection
Identifies bullish and bearish FVGs automatically
Age limit: FVGs expire after 20 bars to avoid stale setups
Size filter: Minimum gap size to filter out noise
2. Session Filtering
Tokyo Open focus: Trades during first hour of Asian session
London/NY Overlap: Captures high-liquidity institutional flows
Weekend gap strategy: Enhanced signals on Monday opens
3. Volume Confirmation
Requires 1.5x average volume spike
Confirms institutional participation
Reduces false signals
4. Trend Alignment
50 EMA filter ensures trades align with higher timeframe trend
Long trades above EMA, short trades below
Prevents costly counter-trend trades
5. Risk Management
2:1 Risk/Reward minimum ensures profitability with 40%+ win rate
Percentage-based stops adapt to USDJPY volatility (0.3% default)
Configurable position sizing
🎯 Entry Conditions
(see the generated image above)
Long Entry (BUY)
✅ Bullish FVG detected in previous bars
✅ Price returns to FVG zone during active trading session
✅ Volume spike above 1.5x average
✅ Price above 50 EMA (trend confirmation)
✅ Bullish candle closes within FVG zone
✅ Trading during Tokyo open OR London/NY overlap
Short Entry (SELL)
✅ Bearish FVG detected in previous bars
✅ Price returns to FVG zone during active trading session
✅ Volume spike above 1.5x average
✅ Price below 50 EMA (trend confirmation)
✅ Bearish candle closes within FVG zone
✅ Trading during Tokyo open OR London/NY overlap
📈 Expected Performance
Backtesting Results (Based on Similar Strategies):
Win Rate: 44-59% (profitable due to high R:R ratio)
Average Winner: 60-90 pips during London/NY sessions
Average Loser: 30-40 pips (tight stops at FVG boundaries)
Risk/Reward: 2:1 minimum, often 3:1 during strong trends
Best Performance: Monday Tokyo opens and Wednesday London/NY overlaps
Why This Works for USDJPY:
90% correlation with US-Japan bond yield spreads
High volatility provides sufficient pip movement
Heavy institutional/central bank participation creates clear FVGs
Consistent volatility patterns across trading sessions
⚙️ Configurable Parameters
Session Settings:
Trade Tokyo Session (Enable/Disable)
Trade London/NY Overlap (Enable/Disable)
FVG Settings:
FVG Minimum Size (Filter small gaps)
Maximum FVG Age (20 bars default)
Show FVG Markers (Visual display)
Volume Settings:
Use Volume Filter (Enable/Disable)
Volume Multiplier (1.5x default)
Volume Average Period (20 bars)
Trend Settings:
Use Trend Filter (Enable/Disable)
Trend EMA Period (50 default)
Risk Management:
Risk/Reward Ratio (2.0 default)
Stop Loss Percentage (0.3% default)
🎨 Visual Indicators
🟡 Yellow Line: 50 EMA trend filter
🟢 Green Triangles: Long entry signals
🔴 Red Triangles: Short entry signals
🟢 Green Dots: Bullish FVG zones
🔴 Red Dots: Bearish FVG zones
🟦 Blue Background: Tokyo open session
🟧 Orange Background: London/NY overlap
📊 Recommended Settings
Optimal Timeframes:
Primary: 5-minute charts (scalping)
Secondary: 15-minute charts (swing trading)
Parameter Optimization:
Conservative: Stop Loss 0.2%, R:R 2:1, Volume 2.0x
Balanced: Stop Loss 0.3%, R:R 2:1, Volume 1.5x (default)
Aggressive: Stop Loss 0.4%, R:R 1.5:1, Volume 1.2x
Risk Management:
Maximum 1-2% of account per trade
Daily loss limit: Stop after 3-5 consecutive losses
Use fixed percentage position sizing
⚠️ Important Considerations
Avoid Trading During:
Major news events (BOJ interventions, NFP, FOMC)
Holiday periods with reduced liquidity
Low volatility Asian afternoon sessions
When US-Japan yield differential narrows sharply
Best Practices:
Limit to 2-3 trades per session maximum
Always respect the 50 EMA trend filter
Never risk more than planned per trade
Paper trade for 2-4 weeks before live implementation
Track performance by session and day of week
🚀 How to Use
Add the script to your USDJPY chart
Set timeframe to 5-minute or 15-minute
Adjust parameters based on your risk tolerance
Enable strategy alerts for automated notifications
Wait for visual signals (triangles) to appear
Enter trades according to your risk management rules
📚 Strategy Foundation
This strategy is based on:
Smart Money Concepts (SMC): Institutional order flow tracking
Market Microstructure: Understanding how FVGs form in electronic trading
Quantified Risk Management: Statistical edge through proper R:R ratios
Session Liquidity Patterns: Exploiting predictable volatility cycles

Fractals & SweepThe Fractals & Sweep indicator is designed to identify key market structure points (fractals) and detect potential liquidity sweeps around those areas. It visually highlights both Bill Williams fractals and regular fractals, and alerts the user when the market sweeps liquidity above or below the most recent fractal levels.
Fractal Recognition:
Detects both bullish (low) and bearish (high) fractals on the price chart.
Users can choose between:
Bill Williams fractal logic (default), or
Regular fractal logic (when the “Filter Bill Williams Fractals” option is enabled).
Fractals are plotted directly on the chart as red downward triangles for highs and green upward triangles for lows.
Fractal Tracking:
The indicator stores the most recent high and low fractal levels to serve as reference points for potential sweep detection.
Sweep Detection:
A bearish sweep is triggered when the price wicks above the last fractal high but closes below it — suggesting a liquidity grab above resistance.
A bullish sweep is triggered when the price wicks below the last fractal low but closes above it — suggesting a liquidity grab below support.
When a sweep occurs, the indicator draws a horizontal line from the previous fractal point to the current bar.
Alert System:
Custom alerts notify the trader when a bearish sweep or bullish sweep occurs, allowing for timely reactions to potential reversals or liquidity traps.

Trend Pivots Profile [BigBeluga]🔵 OVERVIEW
The Trend Pivots Profile is a dynamic volume profile tool that builds profiles around pivot points to reveal where liquidity accumulates during trend shifts. When the market is in an uptrend , the indicator generates profiles at low pivots . In a downtrend , it builds them at high pivots . Each profile is constructed using lower timeframe volume data for higher resolution, making it highly precise even in limited space. A colored trendline helps traders instantly recognize the prevailing trend and anticipate which type of profile (bullish or bearish) will form.
🔵 CONCEPTS
Pivot-Driven Profiles : Profiles are only created when a new pivot forms, aligning liquidity analysis with market structure shifts.
Trend-Contextual : Profiles form at low pivots in uptrends and at high pivots in downtrends.
Lower Timeframe Data : Volume and close values are pulled from smaller timeframes to provide detailed, high-resolution profiles inside larger pivot windows.
Adaptive Bin Sizing : Bin size is automatically calculated relative to ATR, ensuring consistent precision across different markets and volatility conditions.
Point of Control (PoC) : The highest-volume level within each profile is marked with a PoC line that extends until the next pivot forms.
Trendline Visualization : A wide, semi-transparent line follows the rolling average of highs and lows, colored blue in uptrends and orange in downtrends.
🔵 FEATURES
Pivot Length Control : Adjust how far back the script looks to detect pivots (e.g., length 5 → profiles cover 10 bars after pivot).
Pivot Profile toggle :
On → draw the filled pivot profile + PoC + pivot label.
Off → hide profiles; show only PoC level (clean S/R mode).
Trend Length Filter : Smooths trendline detection to ensure reliable up/down bias.
Precise Volume Distribution : Volume is aggregated into bins, creating a smooth volume curve around the pivot range.
PoC Extension : Automatically extends the most active price level until a new pivot is confirmed.
Profile Visualization : Profiles appear as filled shapes anchored at the pivot candle, colored based on trend.
Trendline Overlay : Thick, semi-transparent trendline provides visual guidance on directional bias.
Automatic Cleanup : Old profiles are deleted once they exceed the chart’s capacity (default 25 stored profiles).
🔵 HOW TO USE
Spotting Trend Liquidity : In an uptrend, monitor profiles at low pivots to see where buyers concentrated. In downtrends, use high-pivot profiles to spot sell-side pressure.
Watch the PoC : The PoC line highlights the strongest traded level of the pivot structure—expect reactions when price retests it.
Anticipate Trend Continuation/Reversal : Use the trendline (blue = bullish, orange = bearish) together with pivot profiles to forecast directional momentum.
Combine with HTF Context : Overlay with higher timeframe structure (order blocks, liquidity zones, or FVGs) for confluence.
Fine-Tune with Inputs : Adjust Pivot Length for sensitivity and Trend Length for smoother or faster trend shifts.
🔵 CONCLUSION
The Trend Pivots Profile blends pivot-based structure with precise volume profiling. By dynamically plotting profiles on pivots aligned with the prevailing trend, highlighting PoCs, and overlaying a directional trendline, it equips traders with a clear view of liquidity clusters and directional momentum—ideal for anticipating reactions, pullbacks, or breakouts.

Volume Based Sampling [BackQuant]Volume Based Sampling
What this does
This indicator converts the usual time-based stream of candles into an event-based stream of “synthetic” bars that are created only when enough trading activity has occurred . You choose the activity definition:
Volume bars : create a new synthetic bar whenever the cumulative number of shares/contracts traded reaches a threshold.
Dollar bars : create a new synthetic bar whenever the cumulative traded dollar value (price × volume) reaches a threshold.
The script then keeps an internal ledger of these synthetic opens, highs, lows, closes, and volumes, and can display them as candles, plot a moving average calculated over the synthetic closes, mark each time a new sample is formed, and optionally overlay the native time-bars for comparison.
Why event-based sampling matters
Markets do not release information on a clock: activity clusters during news, opens/closes, and liquidity shocks. Event-based bars normalize for that heteroskedastic arrival of information: during active periods you get more bars (finer resolution); during quiet periods you get fewer bars (coarser resolution). Research shows this can reduce microstructure pathologies and produce series that are closer to i.i.d. and more suitable for statistical modeling and ML. In particular:
Volume and dollar bars are a common event-time alternative to time bars in quantitative research and are discussed extensively in Advances in Financial Machine Learning (AFML). These bars aim to homogenize information flow by sampling on traded size or value rather than elapsed seconds.
The Volume Clock perspective models market activity in “volume time,” showing that many intraday phenomena (volatility, liquidity shocks) are better explained when time is measured by traded volume instead of seconds.
Related market microstructure work on flow toxicity and liquidity highlights that the risk dealers face is tied to information intensity of order flow, again arguing for activity-based clocks.
How the indicator works (plain English)
Choose your bucket type
Volume : accumulate volume until it meets a threshold.
Dollar Bars : accumulate close × volume until it meets a dollar threshold.
Pick the threshold rule
Dynamic threshold : by default, the script computes a rolling statistic (mean or median) of recent activity to set the next bucket size. This adapts bar size to changing conditions (e.g., busier sessions produce more frequent synthetic bars).
Fixed threshold : optionally override with a constant target (e.g., exactly 100,000 contracts per synthetic bar, or $5,000,000 per dollar bar).
Build the synthetic bar
While a bucket fills, the script tracks:
o_s: first price of the bucket (synthetic open)
h_s: running maximum price (synthetic high)
l_s: running minimum price (synthetic low)
c_s: last price seen (synthetic close)
v_s: cumulative native volume inside the bucket
d_samples: number of native bars consumed to complete the bucket (a proxy for “how fast” the threshold filled)
Emit a new sample
Once the bucket meets/exceeds the threshold, a new synthetic bar is finalized and stored. If overflow occurs (e.g., a single native bar pushes you past the threshold by a lot), the code will emit multiple synthetic samples to account for the extra activity.
Maintain a rolling history efficiently
A ring buffer can overwrite the oldest samples when you hit your Max Stored Samples cap, keeping memory usage stable.
Compute synthetic-space statistics
The script computes an SMA over the last N synthetic closes and basic descriptors like average bars per synthetic sample, mean and standard deviation of synthetic returns, and more. These are all in event time , not clock time.
Inputs and options you will actually use
Data Settings
Sampling Method : Volume or Dollar Bars.
Rolling Lookback : window used to estimate the dynamic threshold from recent activity.
Filter : Mean or Median for the dynamic threshold. Median is more robust to spikes.
Use Fixed? / Fixed Threshold : override dynamic sizing with a constant target.
Max Stored Samples : cap on synthetic history to keep performance snappy.
Use Ring Buffer : turn on to recycle storage when at capacity.
Indicator Settings
SMA over last N samples : moving average in synthetic space . Because its index is sample count, not minutes, it adapts naturally: more updates in busy regimes, fewer in quiet regimes.
Visuals
Show Synthetic Bars : plot the synthetic OHLC candles.
Candle Color Mode :
Green/Red: directional close vs open
Volume Intensity: opacity scales with synthetic size
Neutral: single color
Adaptive: graded by how large the bucket was relative to threshold
Mark new samples : drop a small marker whenever a new synthetic bar prints.
Comparison & Research
Show Time Bars : overlay the native time-based candles to visually compare how the two sampling schemes differ.
How to read it, step by step
Turn on “Synthetic Bars” and optionally overlay “Time Bars.” You will see that during high-activity bursts, synthetic bars print much faster than time bars.
Watch the synthetic SMA . Crosses in synthetic space can be more meaningful because each update represents a roughly comparable amount of traded information.
Use the “Avg Bars per Sample” in the info table as a regime signal. Falling average bars per sample means activity is clustering, often coincident with higher realized volatility.
Try Dollar Bars when price varies a lot but share count does not; they normalize by dollar risk taken in each sample. Volume Bars are ideal when share count is a better proxy for information flow in your instrument.
Quant finance background and citations
Event time vs. clock time : Easley, López de Prado, and O’Hara advocate measuring intraday phenomena on a volume clock to better align sampling with information arrival. This framing helps explain volatility bursts and liquidity droughts and motivates volume-based bars.
Flow toxicity and dealer risk : The same authors show how adverse selection risk changes with the intensity and informativeness of order flow, further supporting activity-based clocks for modeling and risk management.
AFML framework : In Advances in Financial Machine Learning , event-driven bars such as volume, dollar, and imbalance bars are presented as superior sampling units for many ML tasks, yielding more stationary features and fewer microstructure distortions than fixed time bars. ( Alpaca )
Practical use cases
1) Regime-aware moving averages
The synthetic SMA in event time is not fooled by quiet periods: if nothing of consequence trades, it barely updates. This can make trend filters less sensitive to calendar drift and more sensitive to true participation.
2) Breakout logic on “equal-information” samples
The script exposes simple alerts such as breakout above/below the synthetic SMA . Because each bar approximates a constant amount of activity, breakouts are conditioned on comparable informational mass, not arbitrary time buckets.
3) Volatility-adaptive backtests
If you use synthetic bars as your base data stream, most signal rules become self-paced : entry and exit opportunities accelerate in fast markets and slow down in quiet regimes, which often improves the realism of slippage and fill modeling in research pipelines (pair this indicator with strategy code downstream).
4) Regime diagnostics
Avg Bars per Sample trending down: activity is dense; expect larger realized ranges.
Return StdDev (synthetic) rising: noise or trend acceleration in event time; re-tune risk.
Interpreting the info panel
Method : your sampling choice and current threshold.
Total Samples : how many synthetic bars have been formed.
Current Vol/Dollar : how much of the next bucket is already filled.
Bars in Bucket : native bars consumed so far in the current bucket.
Avg Bars/Sample : lower means higher trading intensity.
Avg Return / Return StdDev : return stats computed over synthetic closes .
Research directions you can build from here
Imbalance and run bars
Extend beyond pure volume or dollar thresholds to imbalance bars that trigger on directional order flow imbalance (e.g., buy volume minus sell volume), as discussed in the AFML ecosystem. These often further homogenize distributional properties used in ML. alpaca.markets
Volume-time indicators
Re-compute classical indicators (RSI, MACD, Bollinger) on the synthetic stream. The premise is that signals are updated by traded information , not seconds, which may stabilize indicator behavior in heteroskedastic regimes.
Liquidity and toxicity overlays
Combine synthetic bars with proxies of flow toxicity to anticipate spread widening or volatility clustering. For instance, tag synthetic bars that surpass multiples of the threshold and test whether subsequent realized volatility is elevated.
Dollar-risk parity sampling for portfolios
Use dollar bars to align samples across assets by notional risk, enabling cleaner cross-asset features and comparability in multi-asset models (e.g., correlation studies, regime clustering). AFML discusses the benefits of event-driven sampling for cross-sectional ML feature engineering.
Microstructure feature set
Compute duration in native bars per synthetic sample , range per sample , and volume multiple of threshold as inputs to state classifiers or regime HMMs . These features are inherently activity-aware and often predictive of short-horizon volatility and trend persistence per the event-time literature. ( Alpaca )
Tips for clean usage
Start with dynamic thresholds using Median over a sensible lookback to avoid outlier distortion, then move to Fixed thresholds when you know your instrument’s typical activity scale.
Compare time bars vs synthetic bars side by side to develop intuition for how your market “breathes” in activity time.
Keep Max Stored Samples reasonable for performance; the ring buffer avoids memory creep while preserving a rolling window of research-grade data.

$ - HTF Sweeps & PO3HTF Sweeps & PO3 Indicator
The HTF Sweeps & PO3 indicator is a powerful tool designed for traders to visualise higher timeframe (HTF) candles, identify liquidity sweeps, and track key price levels on a lower timeframe (LTF) chart. Built for TradingView using Pine Script v6, it overlays HTF candle data and highlights significant price movements, such as sweeps of previous highs or lows, to help traders identify potential liquidity sweep and reversal points. The indicator is highly customisable, offering a range of visual and alert options to suit various trading strategies.
Features
Higher Timeframe (HTF) Candle Visualisation:
- Displays up to three user-defined HTF candles (e.g., 15m, 1H, 4H) overlaid on the LTF chart.
- Customisable candle appearance with adjustable size (Tiny to Huge), offset, spacing, and colours for bullish/bearish candles and wicks.
- Option to show timeframe labels above or below HTF candles with configurable size and position.
Liquidity Sweep Detection:
- Identifies bullish and bearish sweeps when price moves beyond the high or low of a previous HTF candle and meets specific conditions.
- Displays sweeps on both LTF and HTF with customisable line styles (Solid, Dashed, Dotted), widths, and colours.
- Option to show only the most recent sweep per candle to reduce chart clutter.
Invalidated Sweep Tracking:
- Detects and visualises invalidated sweeps (when price moves past a sweep level in the opposite direction).
- Configurable display for invalidated sweeps on LTF and HTF with distinct line styles and colours.
Previous High/Low Lines:
- Plots horizontal lines at the high and low of the previous HTF candle, extending on both LTF and HTF.
- Customisable line style, width, and color for easy identification of key levels.
- Real-Time Sweep Detection:
-Optional real-time sweep visualisation for active candles, enabling traders to monitor developing price action.
Alert System:
- Triggers alerts for sweep formation (when a new sweep is detected).
- Triggers alerts for sweep invalidation (when a sweep is no longer valid).
- Alerts include details such as timeframe, ticker, and price level for precise notifications.
Performance Optimisation:
- Efficiently manages resources with configurable limits for lines, labels, boxes, and bars (up to 500 each).
- Cleans up outdated visual elements to maintain chart clarity.
Flexible Configuration:
- Supports multiple timeframes for HTF candles with user-defined settings for visibility and number of candles displayed (1–60).
- Toggle visibility for HTF candles, sweeps, invalidated sweeps, and high/low lines independently for LTF and HTF.
This indicator is ideal for traders focusing on liquidity hunting, order block analysis, or price action strategies, providing clear visual cues and alerts to enhance decision-making.

FU + SMI Validator (Proper FU, 30m)Overview
The FU + SMI Validator is a sophisticated technical analysis indicator designed to detect Proper FU (Fakeouts or Liquidity Sweeps) on the 30-minute timeframe. This tool aims to help traders identify high-probability reversal setups that occur when price briefly breaks key levels (sweeping liquidity), then reverses with momentum confirmation.
Fakeouts are common market events where price action “hunts stops” before reversing direction. Correctly identifying these events can offer excellent entry points with defined risk. This indicator combines price action logic with momentum and volatility filters to provide reliable signals.
Core Concepts
Proper FU (Fakeout) Detection
At its core, the script identifies proper fakeouts by checking if the current bar’s price:
For bullish fakeouts: dips below the previous bar’s low (sweeping stops) and then closes above the previous bar’s high
For bearish fakeouts: spikes above the previous bar’s high and then closes below the previous bar’s low
This ensures that the breakout is a true sweep rather than just a one-sided close.
Optionally, the script can require one additional confirmation bar after the FU, ensuring that the momentum is sustained and reducing false signals.
SMI-style Momentum Validation
To improve the quality of signals, the indicator uses a proxy for the Stochastic Momentum Index (SMI) by calculating the difference between current and past linear regression slopes of price. This momentum check helps ensure that fakeouts occur alongside actual directional strength.
Key points:
Momentum must be increasing in the direction of the FU signal.
Momentum filters can be enabled or disabled based on user preference.
Squeeze Condition to Avoid Low-Volatility Traps
The script includes a volatility filter based on a squeeze-like condition:
It compares Bollinger Bands (BB) and Keltner Channels (KC).
When BB bands contract inside KC bands, the market is in a squeeze state, signaling low volatility.
Fakeouts during squeeze conditions are often unreliable; the script can filter these out to reduce false alarms.
Killzone Session Timing Filter
Recognizing that liquidity and volatility vary by session, this tool supports optional filtering for:
London Killzone: 09:00 to 10:30 (UK time)
New York Killzone: 13:00 to 14:30 (UK time)
Signals only trigger during these high-activity windows if enabled, helping traders focus on periods with the best liquidity and market participation.
Note: For Killzone filtering to work accurately, your TradingView chart must be set to the UK timezone.
Features & Benefits
Robust FU detection ensures the breakout price action is meaningful, reducing noise.
Momentum filter via linear regression slope captures trend strength in a smooth, mathematically sound way.
Low-volatility squeeze avoidance helps reduce false signals in choppy or range-bound markets.
Killzone timing filter focuses your attention on the most liquid and active market hours.
Optional confirmation bar increases signal reliability.
Raw FU markers allow visualization of all detected fakeouts for pattern recognition and manual analysis.
Alerts built-in for both valid buy and sell FU setups, enabling real-time notification and quicker decision-making.
Customization Options
Killzone usage: Enable or disable the session timing filter.
Sessions: Configure London and New York killzone time ranges.
Momentum alignment: Enable or disable momentum filter based on SMI proxy.
Volatility filter: Avoid signals during squeeze or low-volatility conditions.
FU confirmation: Option to require one additional confirming candle after the initial FU.
Squeeze and momentum parameters: Adjust Bollinger Bands length and multiplier, Keltner Channel length and ATR multiplier.
Raw FU markers: Show or hide all detected fakeouts regardless of filters.
How to Use This Indicator
Apply to 30-minute charts for forex pairs, indices, cryptocurrencies, or other instruments.
Set your chart timezone to UK time if using Killzone filters.
Adjust input parameters based on your preferred sessions and risk tolerance.
Look for green “VALID BUY FU” labels below bars for bullish fakeout entries.
Look for red “VALID SELL FU” labels above bars for bearish fakeout entries.
Use the alert system to receive notifications on setups.
Combine with your existing analysis or risk management strategy for entries, stops, and profit targets.
Why Use FU + SMI Validator?
Fakeouts are some of the most lucrative but tricky setups for many traders. Without proper filters, they can lead to false entries and losses. This script integrates price action, momentum, volatility, and session timing into one package, providing a robust tool to spot high-quality fakeout opportunities and improve trading confidence.
Limitations
Requires chart to be set to UK timezone for session filters.
Designed specifically for 30-minute timeframe — performance on other timeframes may vary.
Momentum is a proxy, not a direct SMI calculation.
Like all indicators, best used in conjunction with sound risk management and other analysis tools.
Potential Enhancements
Conversion into a full strategy script for backtesting entries and exits.
Addition of other momentum indicators (RSI, MACD) or volume filters.
Customizable time zones or auto time zone detection.
Multi-timeframe analysis capabilities.
Visual dashboard for summary of signal stats.

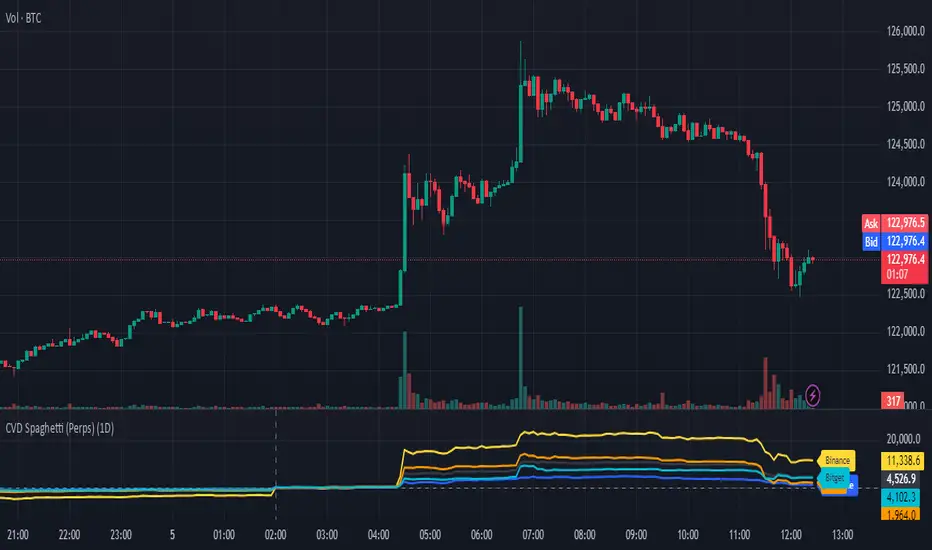
CVD Spaghetti - Multi-Exchange (Perpetuals)CVD Spaghetti – Multi-Exchange (Perpetuals) is designed to track and visualize Cumulative Volume Delta (CVD) across multiple cryptocurrency perpetual futures exchanges in one consolidated view. This indicator provides traders with a clearer perspective on buying and selling pressure by monitoring how order flow develops on different venues simultaneously.
What it does
The script calculates the CVD for each enabled exchange and plots them as separate lines on a single chart, creating a “spaghetti” style visualization. This allows traders to identify relative strength or weakness between major exchanges, which can often hint at institutional positioning, liquidity shifts, and potential market imbalances.
Why it’s useful
Order flow and liquidity dynamics can differ significantly between exchanges. By aggregating and comparing these flows, traders can:
Detect which venue is leading during trend development.
Spot divergences between exchanges, which may indicate inefficiencies or arbitrage-driven movements.
Gauge overall sentiment strength by comparing multiple sources instead of relying on a single dataset.
Technical details
Anchor Period Reset: The cumulative calculation resets based on the user-defined Anchor Period (default: daily), keeping data relevant for the chosen trading horizon.
Dynamic Resolution: The script automatically selects an appropriate lower timeframe for data requests based on the chart timeframe to maintain responsiveness and accuracy.
Normalization: Not all exchanges report volume in the same way—some use quote currency (USD), others in contracts or ticks. To ensure comparability, this indicator normalizes volumes where necessary:
Bybit USD and OKX contracts are divided by price to approximate base-coin terms.
Single-contract venues (e.g., Deribit) are normalized similarly.
Exchanges already reporting in the base currency remain unchanged.
Multi-Exchange Coverage: Supports major venues including Binance, Bybit, OKX, Bitget, Coinbase, and optional secondary exchanges like Blofin, Whitebit, and Deribit.
Visual Aids:
Zero baseline for directional reference.
Vertical session markers at each reset point.
Optional exchange labels positioned dynamically on the last bar for quick identification.
How traders might use it
Trend confirmation: Strong synchronized CVD across all major exchanges supports continuation; fragmentation may suggest weakening conviction.
Cross-exchange divergence: When one exchange’s CVD diverges from others, it can signal localized liquidity shocks or large player activity.
High-frequency strategies: On lower timeframes, the spaghetti view can highlight which venue is absorbing or providing liquidity fastest, aiding short-term decision-making.
Technical Summary VWAP | RSI | VolatilityTechnical Summary VWAP | RSI | Volatility
The Quantum Trading Matrix is a multi-dimensional market-analysis dashboard designed as an educational and idea-generation tool to help traders read price structure, participation, momentum and volatility in one compact view. It is not an automated execution system; rather, it aggregates lightweight “quantum” signals — VWAP position, momentum oscillator behaviour, multi-EMA trend scoring, volume flow and institutional activity heuristics, market microstructure pivots and volatility measures — and synthesizes them into a single, transparent score and signal recommendation. The primary goal is to make explicit why a given market looks favourable or unfavourable by showing the individual ingredients and how they combine, enabling traders to learn, test and form rules based on observable market mechanics.
Each module of the matrix answers a distinct market question. VWAP and its percentage distance indicate whether the current price is trading above or below the intraday volume-weighted average — a proxy for intraday institutional control and value. The quantum momentum oscillator (fast and slow EMA difference scaled to percent) captures short-to-intermediate momentum shifts, providing a quickly responsive view of directional pressure. Multi-EMA trend scoring (8/21/50) produces a simple, transparent trend score by counting conditions such as price above EMAs and cross-EMAs ordering; this score is used to categorize market trend into descriptive buckets (e.g., STRONG UP, WEAK UP, NEUTRAL, DOWN). Volume analysis compares current volume to a recent moving average and computes a Z-score to detect spikes and unusual participation; additional buy/sell pressure heuristics (buyingPressure, sellingPressure, flowRatio) estimate whether upside or downside participation dominates the bar. Institutional activity is approximated by flagging large orders relative to volume baseline (e.g., volume > 2.5× MA) and estimating a dark pool proxy; this is a heuristic to highlight bars that likely had large players involved.
The dashboard also performs market-structure detection with small pivot windows to identify recent local support/resistance areas and computes price position relative to the daily high/low (dailyMid, pricePosition). Volatility is measured via ATR divided by price and bucketed into LOW/NORMAL/HIGH/EXTREME categories to help you adapt stop sizing and expectational horizons. Finally, all these pieces feed an interpretable scoring function that rewards alignment: VWAP above, strong flow ratio, bullish trend score, bullish momentum, and favorable RSI zone add to the overall score which is presented as a 0–100 metric and a colored emoji indicator for at-a-glance assessment.
The mashup is purposeful: each indicator covers a failure mode of the other. For example, momentum readings can be misleading during volatility spikes; VWAP informs whether institutions are on the bid or offer; volume Z-score detects abnormal participation that can validate a breakout; multi-EMA score mitigates single-EMA whipsaws by requiring a combination of price/EMA conditions. Combining these signals increases information content while keeping each component explainable — a key compliance requirement. The script intentionally emphasizes transparency: when it shows a BUY/SELL/HOLD recommendation, the dashboard shows the underlying sub-components so a trader can see whether VWAP, momentum, volume, trend or structure primarily drove the score.
For practical use, adopt a clear workflow: (1) check the matrix score and read the component tiles (VWAP position, momentum, trend and volume) to understand the drivers; (2) confirm market-structure support/resistance and pricePosition relative to the daily range; (3) require at least two corroborating components (for example, VWAP ABOVE + Momentum BULLISH or Volume spike + Trend STRONG UP) before considering entries; (4) use ATR-based stops or daily pivot distance for stop placement and size positions such that the trade risks a small, pre-defined percent of capital; (5) for intraday scalps shorten holding time and tighten stops, for swing trades increase lookback lengths and require multi-timeframe (higher TF) agreement. Treat the matrix as an idea filter and replay lab: when an alert triggers, replay the bars and observe which components anticipated the move and which lagged.
Parameter tuning matters. Shortening the momentum length makes the oscillator more sensitive (useful for scalping), while lengthening it reduces noise for swing contexts. Volume profile bars and MA length should match the instrument’s liquidity — increase the MA for low-liquidity stocks to reduce false institutional flags. The trend multiplier and signal sensitivity parameters let you calibrate how aggressively the matrix counts micro evidence into the score. Always backtest parameter sets across multiple periods and instruments; run walk-forward tests and keep a simple out-of-sample validation window to reduce overfitting risk.
Limitations and failure modes are explicit: institutional flags and dark-pool estimates are heuristics and cannot substitute for true tape or broker-level order flow; volume split by price range is an approximation and will not perfectly reflect signed volume; pivot detection with small windows may miss larger structural swings; VWAP is typically intraday-centric and less meaningful across multi-day swing contexts; the score is additive and may not capture non-linear relationships between features in extreme market regimes (e.g., flash crashes, circuit breaker events, or overnight gaps). The matrix is also susceptible to false signals during major news releases when price and volume behavior dislocate from typical patterns. Users should explicitly test behavior around earnings, macro data and low-liquidity periods.
To learn with the matrix, perform these experiments: (A) collect all BUY/SELL alerts over a 6-month period and measure median outcome at 5, 20 and 60 bars; (B) require additional gating conditions (e.g., only accept BUY when flowRatio>60 and trendScore≥4) and compare expectancy; (C) vary the institutional threshold (2×, 2.5×, 3× volumeMA) to see how many true positive spikes remain; (D) perform multi-instrument tests to ensure parameters are not tuned to a single ticker. Document every test and prefer robust, slightly lower returns with clearer logic rather than tuned “optimal” results that fail out of sample.
Originality statement: This script’s originality lies in the curated combination of intraday value (VWAP), multi-EMA trend scoring, momentum percent oscillator, volume Z-score plus buy/sell flow heuristics and a compact, interpretable scoring system. The script is not a simple indicator mashup; it is a didactic ensemble specifically designed to make internal rationale visible so traders can learn how each market characteristic contributes to actionable probability. The tool’s novelty is its emphasis on interpretability — showing the exact contributing signals behind a composite score — enabling reproducible testing and educational value.
Finally, for TradingView publication, include a clear description listing the modules, a short non-technical summary of how they interact, the tunable inputs, limitations and a risk disclaimer. Remove any promotional content or external contact links. If you used trademark symbols, either provide registration details or remove them. This transparent documentation satisfies TradingView’s requirement that mashups justify their composition and teach users how to use them.
Quantum Trading Matrix — multi-factor intraday dashboard (educational use only).
Purpose: Combines intraday VWAP position, a fast/slow EMA momentum percent oscillator, multi-EMA trend scoring (8/21/50), volume Z-score and buy/sell flow heuristics, pivot-based microstructure detection, and ATR-based volatility buckets to produce a transparent, componentized market score and trade-idea indicator. The mashup is intentional: VWAP identifies intraday value, momentum detects short bursts, EMAs provide structural trend bias, and volume/flow confirm participation. Signals require alignment of at least two components (for example, VWAP ABOVE + Momentum BULLISH + positive flow) for higher confidence.
Inputs: momentum period, volume MA/profile length, EMA configuration (8/21/50), trend multiplier, signal sensitivity, color and display options. Use shorter momentum lengths for scalps and longer for swing analysis. Increase volume MA for thinly traded instruments.
Limitations: Institutional/dark-pool estimates and flow heuristics are approximations, not actual exchange tape. VWAP is intraday-focused. Expect false signals during major news or low-liquidity sessions. Backtest and paper-trade before applying real capital.
Risk Disclaimer: For education and analysis only. Not financial advice. Use proper risk management. The author is not responsible for trading losses.
________________________________________
Risk & Misuse Disclaimer
This indicator is provided for education, analysis and idea generation only. It is not investment or financial advice and does not guarantee profits. Institutional activity flags, dark-pool estimates and flow heuristics are approximations and should not be treated as exchange tape. Backtest thoroughly and use demo/paper accounts before trading real capital. Always apply appropriate position sizing and stop-loss rules. The author is not responsible for any trading losses resulting from the use or misuse of this tool.
________________________________________
Risk Disclaimer: This tool is provided for education and analysis only. It is not financial advice and does not guarantee returns. Users assume all risk for trades made based on this script. Back test thoroughly and use proper risk management.

ATAI Volume analysis with price action V 1.00ATAI Volume Analysis with Price Action
1. Introduction
1.1 Overview
ATAI Volume Analysis with Price Action is a composite indicator designed for TradingView. It combines per‑side volume data —that is, how much buying and selling occurs during each bar—with standard price‑structure elements such as swings, trend lines and support/resistance. By blending these elements the script aims to help a trader understand which side is in control, whether a breakout is genuine, when markets are potentially exhausted and where liquidity providers might be active.
The indicator is built around TradingView’s up/down volume feed accessed via the TradingView/ta/10 library. The following excerpt from the script illustrates how this feed is configured:
import TradingView/ta/10 as tvta
// Determine lower timeframe string based on user choice and chart resolution
string lower_tf_breakout = use_custom_tf_input ? custom_tf_input :
timeframe.isseconds ? "1S" :
timeframe.isintraday ? "1" :
timeframe.isdaily ? "5" : "60"
// Request up/down volume (both positive)
= tvta.requestUpAndDownVolume(lower_tf_breakout)
Lower‑timeframe selection. If you do not specify a custom lower timeframe, the script chooses a default based on your chart resolution: 1 second for second charts, 1 minute for intraday charts, 5 minutes for daily charts and 60 minutes for anything longer. Smaller intervals provide a more precise view of buyer and seller flow but cover fewer bars. Larger intervals cover more history at the cost of granularity.
Tick vs. time bars. Many trading platforms offer a tick / intrabar calculation mode that updates an indicator on every trade rather than only on bar close. Turning on one‑tick calculation will give the most accurate split between buy and sell volume on the current bar, but it typically reduces the amount of historical data available. For the highest fidelity in live trading you can enable this mode; for studying longer histories you might prefer to disable it. When volume data is completely unavailable (some instruments and crypto pairs), all modules that rely on it will remain silent and only the price‑structure backbone will operate.
Figure caption, Each panel shows the indicator’s info table for a different volume sampling interval. In the left chart, the parentheses “(5)” beside the buy‑volume figure denote that the script is aggregating volume over five‑minute bars; the center chart uses “(1)” for one‑minute bars; and the right chart uses “(1T)” for a one‑tick interval. These notations tell you which lower timeframe is driving the volume calculations. Shorter intervals such as 1 minute or 1 tick provide finer detail on buyer and seller flow, but they cover fewer bars; longer intervals like five‑minute bars smooth the data and give more history.
Figure caption, The values in parentheses inside the info table come directly from the Breakout — Settings. The first row shows the custom lower-timeframe used for volume calculations (e.g., “(1)”, “(5)”, or “(1T)”)
2. Price‑Structure Backbone
Even without volume, the indicator draws structural features that underpin all other modules. These features are always on and serve as the reference levels for subsequent calculations.
2.1 What it draws
• Pivots: Swing highs and lows are detected using the pivot_left_input and pivot_right_input settings. A pivot high is identified when the high recorded pivot_right_input bars ago exceeds the highs of the preceding pivot_left_input bars and is also higher than (or equal to) the highs of the subsequent pivot_right_input bars; pivot lows follow the inverse logic. The indicator retains only a fixed number of such pivot points per side, as defined by point_count_input, discarding the oldest ones when the limit is exceeded.
• Trend lines: For each side, the indicator connects the earliest stored pivot and the most recent pivot (oldest high to newest high, and oldest low to newest low). When a new pivot is added or an old one drops out of the lookback window, the line’s endpoints—and therefore its slope—are recalculated accordingly.
• Horizontal support/resistance: The highest high and lowest low within the lookback window defined by length_input are plotted as horizontal dashed lines. These serve as short‑term support and resistance levels.
• Ranked labels: If showPivotLabels is enabled the indicator prints labels such as “HH1”, “HH2”, “LL1” and “LL2” near each pivot. The ranking is determined by comparing the price of each stored pivot: HH1 is the highest high, HH2 is the second highest, and so on; LL1 is the lowest low, LL2 is the second lowest. In the case of equal prices the newer pivot gets the better rank. Labels are offset from price using ½ × ATR × label_atr_multiplier, with the ATR length defined by label_atr_len_input. A dotted connector links each label to the candle’s wick.
2.2 Key settings
• length_input: Window length for finding the highest and lowest values and for determining trend line endpoints. A larger value considers more history and will generate longer trend lines and S/R levels.
• pivot_left_input, pivot_right_input: Strictness of swing confirmation. Higher values require more bars on either side to form a pivot; lower values create more pivots but may include minor swings.
• point_count_input: How many pivots are kept in memory on each side. When new pivots exceed this number the oldest ones are discarded.
• label_atr_len_input and label_atr_multiplier: Determine how far pivot labels are offset from the bar using ATR. Increasing the multiplier moves labels further away from price.
• Styling inputs for trend lines, horizontal lines and labels (color, width and line style).
Figure caption, The chart illustrates how the indicator’s price‑structure backbone operates. In this daily example, the script scans for bars where the high (or low) pivot_right_input bars back is higher (or lower) than the preceding pivot_left_input bars and higher or lower than the subsequent pivot_right_input bars; only those bars are marked as pivots.
These pivot points are stored and ranked: the highest high is labelled “HH1”, the second‑highest “HH2”, and so on, while lows are marked “LL1”, “LL2”, etc. Each label is offset from the price by half of an ATR‑based distance to keep the chart clear, and a dotted connector links the label to the actual candle.
The red diagonal line connects the earliest and latest stored high pivots, and the green line does the same for low pivots; when a new pivot is added or an old one drops out of the lookback window, the end‑points and slopes adjust accordingly. Dashed horizontal lines mark the highest high and lowest low within the current lookback window, providing visual support and resistance levels. Together, these elements form the structural backbone that other modules reference, even when volume data is unavailable.
3. Breakout Module
3.1 Concept
This module confirms that a price break beyond a recent high or low is supported by a genuine shift in buying or selling pressure. It requires price to clear the highest high (“HH1”) or lowest low (“LL1”) and, simultaneously, that the winning side shows a significant volume spike, dominance and ranking. Only when all volume and price conditions pass is a breakout labelled.
3.2 Inputs
• lookback_break_input : This controls the number of bars used to compute moving averages and percentiles for volume. A larger value smooths the averages and percentiles but makes the indicator respond more slowly.
• vol_mult_input : The “spike” multiplier; the current buy or sell volume must be at least this multiple of its moving average over the lookback window to qualify as a breakout.
• rank_threshold_input (0–100) : Defines a volume percentile cutoff: the current buyer/seller volume must be in the top (100−threshold)%(100−threshold)% of all volumes within the lookback window. For example, if set to 80, the current volume must be in the top 20 % of the lookback distribution.
• ratio_threshold_input (0–1) : Specifies the minimum share of total volume that the buyer (for a bullish breakout) or seller (for bearish) must hold on the current bar; the code also requires that the cumulative buyer volume over the lookback window exceeds the seller volume (and vice versa for bearish cases).
• use_custom_tf_input / custom_tf_input : When enabled, these inputs override the automatic choice of lower timeframe for up/down volume; otherwise the script selects a sensible default based on the chart’s timeframe.
• Label appearance settings : Separate options control the ATR-based offset length, offset multiplier, label size and colors for bullish and bearish breakout labels, as well as the connector style and width.
3.3 Detection logic
1. Data preparation : Retrieve per‑side volume from the lower timeframe and take absolute values. Build rolling arrays of the last lookback_break_input values to compute simple moving averages (SMAs), cumulative sums and percentile ranks for buy and sell volume.
2. Volume spike: A spike is flagged when the current buy (or, in the bearish case, sell) volume is at least vol_mult_input times its SMA over the lookback window.
3. Dominance test: The buyer’s (or seller’s) share of total volume on the current bar must meet or exceed ratio_threshold_input. In addition, the cumulative sum of buyer volume over the window must exceed the cumulative sum of seller volume for a bullish breakout (and vice versa for bearish). A separate requirement checks the sign of delta: for bullish breakouts delta_breakout must be non‑negative; for bearish breakouts it must be non‑positive.
4. Percentile rank: The current volume must fall within the top (100 – rank_threshold_input) percent of the lookback distribution—ensuring that the spike is unusually large relative to recent history.
5. Price test: For a bullish signal, the closing price must close above the highest pivot (HH1); for a bearish signal, the close must be below the lowest pivot (LL1).
6. Labeling: When all conditions above are satisfied, the indicator prints “Breakout ↑” above the bar (bullish) or “Breakout ↓” below the bar (bearish). Labels are offset using half of an ATR‑based distance and linked to the candle with a dotted connector.
Figure caption, (Breakout ↑ example) , On this daily chart, price pushes above the red trendline and the highest prior pivot (HH1). The indicator recognizes this as a valid breakout because the buyer‑side volume on the lower timeframe spikes above its recent moving average and buyers dominate the volume statistics over the lookback period; when combined with a close above HH1, this satisfies the breakout conditions. The “Breakout ↑” label appears above the candle, and the info table highlights that up‑volume is elevated relative to its 11‑bar average, buyer share exceeds the dominance threshold and money‑flow metrics support the move.
Figure caption, In this daily example, price breaks below the lowest pivot (LL1) and the lower green trendline. The indicator identifies this as a bearish breakout because sell‑side volume is sharply elevated—about twice its 11‑bar average—and sellers dominate both the bar and the lookback window. With the close falling below LL1, the script triggers a Breakout ↓ label and marks the corresponding row in the info table, which shows strong down volume, negative delta and a seller share comfortably above the dominance threshold.
4. Market Phase Module (Volume Only)
4.1 Concept
Not all markets trend; many cycle between periods of accumulation (buying pressure building up), distribution (selling pressure dominating) and neutral behavior. This module classifies the current bar into one of these phases without using ATR , relying solely on buyer and seller volume statistics. It looks at net flows, ratio changes and an OBV‑like cumulative line with dual‑reference (1‑ and 2‑bar) trends. The result is displayed both as on‑chart labels and in a dedicated row of the info table.
4.2 Inputs
• phase_period_len: Number of bars over which to compute sums and ratios for phase detection.
• phase_ratio_thresh : Minimum buyer share (for accumulation) or minimum seller share (for distribution, derived as 1 − phase_ratio_thresh) of the total volume.
• strict_mode: When enabled, both the 1‑bar and 2‑bar changes in each statistic must agree on the direction (strict confirmation); when disabled, only one of the two references needs to agree (looser confirmation).
• Color customisation for info table cells and label styling for accumulation and distribution phases, including ATR length, multiplier, label size, colors and connector styles.
• show_phase_module: Toggles the entire phase detection subsystem.
• show_phase_labels: Controls whether on‑chart labels are drawn when accumulation or distribution is detected.
4.3 Detection logic
The module computes three families of statistics over the volume window defined by phase_period_len:
1. Net sum (buyers minus sellers): net_sum_phase = Σ(buy) − Σ(sell). A positive value indicates a predominance of buyers. The code also computes the differences between the current value and the values 1 and 2 bars ago (d_net_1, d_net_2) to derive up/down trends.
2. Buyer ratio: The instantaneous ratio TF_buy_breakout / TF_tot_breakout and the window ratio Σ(buy) / Σ(total). The current ratio must exceed phase_ratio_thresh for accumulation or fall below 1 − phase_ratio_thresh for distribution. The first and second differences of the window ratio (d_ratio_1, d_ratio_2) determine trend direction.
3. OBV‑like cumulative net flow: An on‑balance volume analogue obv_net_phase increments by TF_buy_breakout − TF_sell_breakout each bar. Its differences over the last 1 and 2 bars (d_obv_1, d_obv_2) provide trend clues.
The algorithm then combines these signals:
• For strict mode , accumulation requires: (a) current ratio ≥ threshold, (b) cumulative ratio ≥ threshold, (c) both ratio differences ≥ 0, (d) net sum differences ≥ 0, and (e) OBV differences ≥ 0. Distribution is the mirror case.
• For loose mode , it relaxes the directional tests: either the 1‑ or the 2‑bar difference needs to agree in each category.
If all conditions for accumulation are satisfied, the phase is labelled “Accumulation” ; if all conditions for distribution are satisfied, it’s labelled “Distribution” ; otherwise the phase is “Neutral” .
4.4 Outputs
• Info table row : Row 8 displays “Market Phase (Vol)” on the left and the detected phase (Accumulation, Distribution or Neutral) on the right. The text colour of both cells matches a user‑selectable palette (typically green for accumulation, red for distribution and grey for neutral).
• On‑chart labels : When show_phase_labels is enabled and a phase persists for at least one bar, the module prints a label above the bar ( “Accum” ) or below the bar ( “Dist” ) with a dashed or dotted connector. The label is offset using ATR based on phase_label_atr_len_input and phase_label_multiplier and is styled according to user preferences.
Figure caption, The chart displays a red “Dist” label above a particular bar, indicating that the accumulation/distribution module identified a distribution phase at that point. The detection is based on seller dominance: during that bar, the net buyer-minus-seller flow and the OBV‑style cumulative flow were trending down, and the buyer ratio had dropped below the preset threshold. These conditions satisfy the distribution criteria in strict mode. The label is placed above the bar using an ATR‑based offset and a dashed connector. By the time of the current bar in the screenshot, the phase indicator shows “Neutral” in the info table—signaling that neither accumulation nor distribution conditions are currently met—yet the historical “Dist” label remains to mark where the prior distribution phase began.
Figure caption, In this example the market phase module has signaled an Accumulation phase. Three bars before the current candle, the algorithm detected a shift toward buyers: up‑volume exceeded its moving average, down‑volume was below average, and the buyer share of total volume climbed above the threshold while the on‑balance net flow and cumulative ratios were trending upwards. The blue “Accum” label anchored below that bar marks the start of the phase; it remains on the chart because successive bars continue to satisfy the accumulation conditions. The info table confirms this: the “Market Phase (Vol)” row still reads Accumulation, and the ratio and sum rows show buyers dominating both on the current bar and across the lookback window.
5. OB/OS Spike Module
5.1 What overbought/oversold means here
In many markets, a rapid extension up or down is often followed by a period of consolidation or reversal. The indicator interprets overbought (OB) conditions as abnormally strong selling risk at or after a price rally and oversold (OS) conditions as unusually strong buying risk after a decline. Importantly, these are not direct trade signals; rather they flag areas where caution or contrarian setups may be appropriate.
5.2 Inputs
• minHits_obos (1–7): Minimum number of oscillators that must agree on an overbought or oversold condition for a label to print.
• syncWin_obos: Length of a small sliding window over which oscillator votes are smoothed by taking the maximum count observed. This helps filter out choppy signals.
• Volume spike criteria: kVolRatio_obos (ratio of current volume to its SMA) and zVolThr_obos (Z‑score threshold) across volLen_obos. Either threshold can trigger a spike.
• Oscillator toggles and periods: Each of RSI, Stochastic (K and D), Williams %R, CCI, MFI, DeMarker and Stochastic RSI can be independently enabled; their periods are adjustable.
• Label appearance: ATR‑based offset, size, colors for OB and OS labels, plus connector style and width.
5.3 Detection logic
1. Directional volume spikes: Volume spikes are computed separately for buyer and seller volumes. A sell volume spike (sellVolSpike) flags a potential OverBought bar, while a buy volume spike (buyVolSpike) flags a potential OverSold bar. A spike occurs when the respective volume exceeds kVolRatio_obos times its simple moving average over the window or when its Z‑score exceeds zVolThr_obos.
2. Oscillator votes: For each enabled oscillator, calculate its overbought and oversold state using standard thresholds (e.g., RSI ≥ 70 for OB and ≤ 30 for OS; Stochastic %K/%D ≥ 80 for OB and ≤ 20 for OS; etc.). Count how many oscillators vote for OB and how many vote for OS.
3. Minimum hits: Apply the smoothing window syncWin_obos to the vote counts using a maximum‑of‑last‑N approach. A candidate bar is only considered if the smoothed OB hit count ≥ minHits_obos (for OverBought) or the smoothed OS hit count ≥ minHits_obos (for OverSold).
4. Tie‑breaking: If both OverBought and OverSold spike conditions are present on the same bar, compare the smoothed hit counts: the side with the higher count is selected; ties default to OverBought.
5. Label printing: When conditions are met, the bar is labelled as “OverBought X/7” above the candle or “OverSold X/7” below it. “X” is the number of oscillators confirming, and the bracket lists the abbreviations of contributing oscillators. Labels are offset from price using half of an ATR‑scaled distance and can optionally include a dotted or dashed connector line.
Figure caption, In this chart the overbought/oversold module has flagged an OverSold signal. A sell‑off from the prior highs brought price down to the lower trend‑line, where the bar marked “OverSold 3/7 DeM” appears. This label indicates that on that bar the module detected a buy‑side volume spike and that at least three of the seven enabled oscillators—in this case including the DeMarker—were in oversold territory. The label is printed below the candle with a dotted connector, signaling that the market may be temporarily exhausted on the downside. After this oversold print, price begins to rebound towards the upper red trend‑line and higher pivot levels.
Figure caption, This example shows the overbought/oversold module in action. In the left‑hand panel you can see the OB/OS settings where each oscillator (RSI, Stochastic, Williams %R, CCI, MFI, DeMarker and Stochastic RSI) can be enabled or disabled, and the ATR length and label offset multiplier adjusted. On the chart itself, price has pushed up to the descending red trendline and triggered an “OverBought 3/7” label. That means the sell‑side volume spiked relative to its average and three out of the seven enabled oscillators were in overbought territory. The label is offset above the candle by half of an ATR and connected with a dashed line, signaling that upside momentum may be overextended and a pause or pullback could follow.
6. Buyer/Seller Trap Module
6.1 Concept
A bull trap occurs when price appears to break above resistance, attracting buyers, but fails to sustain the move and quickly reverses, leaving a long upper wick and trapping late entrants. A bear trap is the opposite: price breaks below support, lures in sellers, then snaps back, leaving a long lower wick and trapping shorts. This module detects such traps by looking for price structure sweeps, order‑flow mismatches and dominance reversals. It uses a scoring system to differentiate risk from confirmed traps.
6.2 Inputs
• trap_lookback_len: Window length used to rank extremes and detect sweeps.
• trap_wick_threshold: Minimum proportion of a bar’s range that must be wick (upper for bull traps, lower for bear traps) to qualify as a sweep.
• trap_score_risk: Minimum aggregated score required to flag a trap risk. (The code defines a trap_score_confirm input, but confirmation is actually based on price reversal rather than a separate score threshold.)
• trap_confirm_bars: Maximum number of bars allowed for price to reverse and confirm the trap. If price does not reverse in this window, the risk label will expire or remain unconfirmed.
• Label settings: ATR length and multiplier for offsetting, size, colours for risk and confirmed labels, and connector style and width. Separate settings exist for bull and bear traps.
• Toggle inputs: show_trap_module and show_trap_labels enable the module and control whether labels are drawn on the chart.
6.3 Scoring logic
The module assigns points to several conditions and sums them to determine whether a trap risk is present. For bull traps, the score is built from the following (bear traps mirror the logic with highs and lows swapped):
1. Sweep (2 points): Price trades above the high pivot (HH1) but fails to close above it and leaves a long upper wick at least trap_wick_threshold × range. For bear traps, price dips below the low pivot (LL1), fails to close below and leaves a long lower wick.
2. Close break (1 point): Price closes beyond HH1 or LL1 without leaving a long wick.
3. Candle/delta mismatch (2 points): The candle closes bullish yet the order flow delta is negative or the seller ratio exceeds 50%, indicating hidden supply. Conversely, a bearish close with positive delta or buyer dominance suggests hidden demand.
4. Dominance inversion (2 points): The current bar’s buyer volume has the highest rank in the lookback window while cumulative sums favor sellers, or vice versa.
5. Low‑volume break (1 point): Price crosses the pivot but total volume is below its moving average.
The total score for each side is compared to trap_score_risk. If the score is high enough, a “Bull Trap Risk” or “Bear Trap Risk” label is drawn, offset from the candle by half of an ATR‑scaled distance using a dashed outline. If, within trap_confirm_bars, price reverses beyond the opposite level—drops back below the high pivot for bull traps or rises above the low pivot for bear traps—the label is upgraded to a solid “Bull Trap” or “Bear Trap” . In this version of the code, there is no separate score threshold for confirmation: the variable trap_score_confirm is unused; confirmation depends solely on a successful price reversal within the specified number of bars.
Figure caption, In this example the trap module has flagged a Bear Trap Risk. Price initially breaks below the most recent low pivot (LL1), but the bar closes back above that level and leaves a long lower wick, suggesting a failed push lower. Combined with a mismatch between the candle direction and the order flow (buyers regain control) and a reversal in volume dominance, the aggregate score exceeds the risk threshold, so a dashed “Bear Trap Risk” label prints beneath the bar. The green and red trend lines mark the current low and high pivot trajectories, while the horizontal dashed lines show the highest and lowest values in the lookback window. If, within the next few bars, price closes decisively above the support, the risk label would upgrade to a solid “Bear Trap” label.
Figure caption, In this example the trap module has identified both ends of a price range. Near the highs, price briefly pushes above the descending red trendline and the recent pivot high, but fails to close there and leaves a noticeable upper wick. That combination of a sweep above resistance and order‑flow mismatch generates a Bull Trap Risk label with a dashed outline, warning that the upside break may not hold. At the opposite extreme, price later dips below the green trendline and the labelled low pivot, then quickly snaps back and closes higher. The long lower wick and subsequent price reversal upgrade the previous bear‑trap risk into a confirmed Bear Trap (solid label), indicating that sellers were caught on a false breakdown. Horizontal dashed lines mark the highest high and lowest low of the lookback window, while the red and green diagonals connect the earliest and latest pivot highs and lows to visualize the range.
7. Sharp Move Module
7.1 Concept
Markets sometimes display absorption or climax behavior—periods when one side steadily gains the upper hand before price breaks out with a sharp move. This module evaluates several order‑flow and volume conditions to anticipate such moves. Users can choose how many conditions must be met to flag a risk and how many (plus a price break) are required for confirmation.
7.2 Inputs
• sharp Lookback: Number of bars in the window used to compute moving averages, sums, percentile ranks and reference levels.
• sharpPercentile: Minimum percentile rank for the current side’s volume; the current buy (or sell) volume must be greater than or equal to this percentile of historical volumes over the lookback window.
• sharpVolMult: Multiplier used in the volume climax check. The current side’s volume must exceed this multiple of its average to count as a climax.
• sharpRatioThr: Minimum dominance ratio (current side’s volume relative to the opposite side) used in both the instant and cumulative dominance checks.
• sharpChurnThr: Maximum ratio of a bar’s range to its ATR for absorption/churn detection; lower values indicate more absorption (large volume in a small range).
• sharpScoreRisk: Minimum number of conditions that must be true to print a risk label.
• sharpScoreConfirm: Minimum number of conditions plus a price break required for confirmation.
• sharpCvdThr: Threshold for cumulative delta divergence versus price change (positive for bullish accumulation, negative for bearish distribution).
• Label settings: ATR length (sharpATRlen) and multiplier (sharpLabelMult) for positioning labels, label size, colors and connector styles for bullish and bearish sharp moves.
• Toggles: enableSharp activates the module; show_sharp_labels controls whether labels are drawn.
7.3 Conditions (six per side)
For each side, the indicator computes six boolean conditions and sums them to form a score:
1. Dominance (instant and cumulative):
– Instant dominance: current buy volume ≥ sharpRatioThr × current sell volume.
– Cumulative dominance: sum of buy volumes over the window ≥ sharpRatioThr × sum of sell volumes (and vice versa for bearish checks).
2. Accumulation/Distribution divergence: Over the lookback window, cumulative delta rises by at least sharpCvdThr while price fails to rise (bullish), or cumulative delta falls by at least sharpCvdThr while price fails to fall (bearish).
3. Volume climax: The current side’s volume is ≥ sharpVolMult × its average and the product of volume and bar range is the highest in the lookback window.
4. Absorption/Churn: The current side’s volume divided by the bar’s range equals the highest value in the window and the bar’s range divided by ATR ≤ sharpChurnThr (indicating large volume within a small range).
5. Percentile rank: The current side’s volume percentile rank is ≥ sharp Percentile.
6. Mirror logic for sellers: The above checks are repeated with buyer and seller roles swapped and the price break levels reversed.
Each condition that passes contributes one point to the corresponding side’s score (0 or 1). Risk and confirmation thresholds are then applied to these scores.
7.4 Scoring and labels
• Risk: If scoreBull ≥ sharpScoreRisk, a “Sharp ↑ Risk” label is drawn above the bar. If scoreBear ≥ sharpScoreRisk, a “Sharp ↓ Risk” label is drawn below the bar.
• Confirmation: A risk label is upgraded to “Sharp ↑” when scoreBull ≥ sharpScoreConfirm and the bar closes above the highest recent pivot (HH1); for bearish cases, confirmation requires scoreBear ≥ sharpScoreConfirm and a close below the lowest pivot (LL1).
• Label positioning: Labels are offset from the candle by ATR × sharpLabelMult (full ATR times multiplier), not half, and may include a dashed or dotted connector line if enabled.
Figure caption, In this chart both bullish and bearish sharp‑move setups have been flagged. Earlier in the range, a “Sharp ↓ Risk” label appears beneath a candle: the sell‑side score met the risk threshold, signaling that the combination of strong sell volume, dominance and absorption within a narrow range suggested a potential sharp decline. The price did not close below the lower pivot, so this label remains a “risk” and no confirmation occurred. Later, as the market recovered and volume shifted back to the buy side, a “Sharp ↑ Risk” label prints above a candle near the top of the channel. Here, buy‑side dominance, cumulative delta divergence and a volume climax aligned, but price has not yet closed above the upper pivot (HH1), so the alert is still a risk rather than a confirmed sharp‑up move.
Figure caption, In this chart a Sharp ↑ label is displayed above a candle, indicating that the sharp move module has confirmed a bullish breakout. Prior bars satisfied the risk threshold — showing buy‑side dominance, positive cumulative delta divergence, a volume climax and strong absorption in a narrow range — and this candle closes above the highest recent pivot, upgrading the earlier “Sharp ↑ Risk” alert to a full Sharp ↑ signal. The green label is offset from the candle with a dashed connector, while the red and green trend lines trace the high and low pivot trajectories and the dashed horizontals mark the highest and lowest values of the lookback window.
8. Market‑Maker / Spread‑Capture Module
8.1 Concept
Liquidity providers often “capture the spread” by buying and selling in almost equal amounts within a very narrow price range. These bars can signal temporary congestion before a move or reflect algorithmic activity. This module flags bars where both buyer and seller volumes are high, the price range is only a few ticks and the buy/sell split remains close to 50%. It helps traders spot potential liquidity pockets.
8.2 Inputs
• scalpLookback: Window length used to compute volume averages.
• scalpVolMult: Multiplier applied to each side’s average volume; both buy and sell volumes must exceed this multiple.
• scalpTickCount: Maximum allowed number of ticks in a bar’s range (calculated as (high − low) / minTick). A value of 1 or 2 captures ultra‑small bars; increasing it relaxes the range requirement.
• scalpDeltaRatio: Maximum deviation from a perfect 50/50 split. For example, 0.05 means the buyer share must be between 45% and 55%.
• Label settings: ATR length, multiplier, size, colors, connector style and width.
• Toggles : show_scalp_module and show_scalp_labels to enable the module and its labels.
8.3 Signal
When, on the current bar, both TF_buy_breakout and TF_sell_breakout exceed scalpVolMult times their respective averages and (high − low)/minTick ≤ scalpTickCount and the buyer share is within scalpDeltaRatio of 50%, the module prints a “Spread ↔” label above the bar. The label uses the same ATR offset logic as other modules and draws a connector if enabled.
Figure caption, In this chart the spread‑capture module has identified a potential liquidity pocket. Buyer and seller volumes both spiked above their recent averages, yet the candle’s range measured only a couple of ticks and the buy/sell split stayed close to 50 %. This combination met the module’s criteria, so it printed a grey “Spread ↔” label above the bar. The red and green trend lines link the earliest and latest high and low pivots, and the dashed horizontals mark the highest high and lowest low within the current lookback window.
9. Money Flow Module
9.1 Concept
To translate volume into a monetary measure, this module multiplies each side’s volume by the closing price. It tracks buying and selling system money default currency on a per-bar basis and sums them over a chosen period. The difference between buy and sell currencies (Δ$) shows net inflow or outflow.
9.2 Inputs
• mf_period_len_mf: Number of bars used for summing buy and sell dollars.
• Label appearance settings: ATR length, multiplier, size, colors for up/down labels, and connector style and width.
• Toggles: Use enableMoneyFlowLabel_mf and showMFLabels to control whether the module and its labels are displayed.
9.3 Calculations
• Per-bar money: Buy $ = TF_buy_breakout × close; Sell $ = TF_sell_breakout × close. Their difference is Δ$ = Buy $ − Sell $.
• Summations: Over mf_period_len_mf bars, compute Σ Buy $, Σ Sell $ and ΣΔ$ using math.sum().
• Info table entries: Rows 9–13 display these values as texts like “↑ USD 1234 (1M)” or “ΣΔ USD −5678 (14)”, with colors reflecting whether buyers or sellers dominate.
• Money flow status: If Δ$ is positive the bar is marked “Money flow in” ; if negative, “Money flow out” ; if zero, “Neutral”. The cumulative status is similarly derived from ΣΔ.Labels print at the bar that changes the sign of ΣΔ, offset using ATR × label multiplier and styled per user preferences.
Figure caption, The chart illustrates a steady rise toward the highest recent pivot (HH1) with price riding between a rising green trend‑line and a red trend‑line drawn through earlier pivot highs. A green Money flow in label appears above the bar near the top of the channel, signaling that net dollar flow turned positive on this bar: buy‑side dollar volume exceeded sell‑side dollar volume, pushing the cumulative sum ΣΔ$ above zero. In the info table, the “Money flow (bar)” and “Money flow Σ” rows both read In, confirming that the indicator’s money‑flow module has detected an inflow at both bar and aggregate levels, while other modules (pivots, trend lines and support/resistance) remain active to provide structural context.
In this example the Money Flow module signals a net outflow. Price has been trending downward: successive high pivots form a falling red trend‑line and the low pivots form a descending green support line. When the latest bar broke below the previous low pivot (LL1), both the bar‑level and cumulative net dollar flow turned negative—selling volume at the close exceeded buying volume and pushed the cumulative Δ$ below zero. The module reacts by printing a red “Money flow out” label beneath the candle; the info table confirms that the “Money flow (bar)” and “Money flow Σ” rows both show Out, indicating sustained dominance of sellers in this period.
10. Info Table
10.1 Purpose
When enabled, the Info Table appears in the lower right of your chart. It summarises key values computed by the indicator—such as buy and sell volume, delta, total volume, breakout status, market phase, and money flow—so you can see at a glance which side is dominant and which signals are active.
10.2 Symbols
• ↑ / ↓ — Up (↑) denotes buy volume or money; down (↓) denotes sell volume or money.
• MA — Moving average. In the table it shows the average value of a series over the lookback period.
• Σ (Sigma) — Cumulative sum over the chosen lookback period.
• Δ (Delta) — Difference between buy and sell values.
• B / S — Buyer and seller share of total volume, expressed as percentages.
• Ref. Price — Reference price for breakout calculations, based on the latest pivot.
• Status — Indicates whether a breakout condition is currently active (True) or has failed.
10.3 Row definitions
1. Up volume / MA up volume – Displays current buy volume on the lower timeframe and its moving average over the lookback period.
2. Down volume / MA down volume – Shows current sell volume and its moving average; sell values are formatted in red for clarity.
3. Δ / ΣΔ – Lists the difference between buy and sell volume for the current bar and the cumulative delta volume over the lookback period.
4. Σ / MA Σ (Vol/MA) – Total volume (buy + sell) for the bar, with the ratio of this volume to its moving average; the right cell shows the average total volume.
5. B/S ratio – Buy and sell share of the total volume: current bar percentages and the average percentages across the lookback period.
6. Buyer Rank / Seller Rank – Ranks the bar’s buy and sell volumes among the last (n) bars; lower rank numbers indicate higher relative volume.
7. Σ Buy / Σ Sell – Sum of buy and sell volumes over the lookback window, indicating which side has traded more.
8. Breakout UP / DOWN – Shows the breakout thresholds (Ref. Price) and whether the breakout condition is active (True) or has failed.
9. Market Phase (Vol) – Reports the current volume‑only phase: Accumulation, Distribution or Neutral.
10. Money Flow – The final rows display dollar amounts and status:
– ↑ USD / Σ↑ USD – Buy dollars for the current bar and the cumulative sum over the money‑flow period.
– ↓ USD / Σ↓ USD – Sell dollars and their cumulative sum.
– Δ USD / ΣΔ USD – Net dollar difference (buy minus sell) for the bar and cumulatively.
– Money flow (bar) – Indicates whether the bar’s net dollar flow is positive (In), negative (Out) or neutral.
– Money flow Σ – Shows whether the cumulative net dollar flow across the chosen period is positive, negative or neutral.
The chart above shows a sequence of different signals from the indicator. A Bull Trap Risk appears after price briefly pushes above resistance but fails to hold, then a green Accum label identifies an accumulation phase. An upward breakout follows, confirmed by a Money flow in print. Later, a Sharp ↓ Risk warns of a possible sharp downturn; after price dips below support but quickly recovers, a Bear Trap label marks a false breakdown. The highlighted info table in the center summarizes key metrics at that moment, including current and average buy/sell volumes, net delta, total volume versus its moving average, breakout status (up and down), market phase (volume), and bar‑level and cumulative money flow (In/Out).
11. Conclusion & Final Remarks
This indicator was developed as a holistic study of market structure and order flow. It brings together several well‑known concepts from technical analysis—breakouts, accumulation and distribution phases, overbought and oversold extremes, bull and bear traps, sharp directional moves, market‑maker spread bars and money flow—into a single Pine Script tool. Each module is based on widely recognized trading ideas and was implemented after consulting reference materials and example strategies, so you can see in real time how these concepts interact on your chart.
A distinctive feature of this indicator is its reliance on per‑side volume: instead of tallying only total volume, it separately measures buy and sell transactions on a lower time frame. This approach gives a clearer view of who is in control—buyers or sellers—and helps filter breakouts, detect phases of accumulation or distribution, recognize potential traps, anticipate sharp moves and gauge whether liquidity providers are active. The money‑flow module extends this analysis by converting volume into currency values and tracking net inflow or outflow across a chosen window.
Although comprehensive, this indicator is intended solely as a guide. It highlights conditions and statistics that many traders find useful, but it does not generate trading signals or guarantee results. Ultimately, you remain responsible for your positions. Use the information presented here to inform your analysis, combine it with other tools and risk‑management techniques, and always make your own decisions when trading.

ICT SIlver Bullet Trading Windows UK times🎯 Purpose of the Indicator
It’s designed to highlight key ICT “macro” and “micro” windows of opportunity, i.e., time ranges where liquidity grabs and algorithmic setups are most likely to occur. The ICT Silver Bullet concept is built on the idea that institutions execute in recurring intraday windows, and these often produce high-probability setups.
🕰️ Windows
London Macro Window
10:00 – 11:00 UK time
This aligns with a major liquidity window after the London equities open settles and London + EU traders reposition.
You’re looking for setups like liquidity sweeps, MSS (market structure shift), and FVG entries here.
New York Macro Window
15:00 – 16:00 UK time (10:00 – 11:00 NY time)
This is right after the NY equities open, a key ICT window for volatility and liquidity grabs.
Power Hour
Usually 20:00 – 21:00 UK time (3pm–4pm NY time), the last trading hour of NY equities.
ICT often refers to this as another manipulation window where setups can form before the daily close.
🔍 What the Indicator Does
Draws session boxes or shading: so you can visually see the London/NY/Power Hour windows directly on your chart.
Macro vs. Micro time frames:
Macro windows → The ones you set (London & NY) are the major daily algo execution windows.
Micro windows → Within those boxes, ICT expects smaller intraday setups (like a Silver Bullet entry from a sweep + FVG).
Guides your trade selection: it tells you when not to hunt trades everywhere, but instead to wait for price action confirmation inside those boxes.
🧩 How This Fits ICT Silver Bullet Trading
The ICT Silver Bullet strategy says:
Wait for one of the macro windows (London or NY).
Look for liquidity sweep → market structure shift → FVG.
Enter with defined risk inside that hour.
This indicator essentially does step 1 for you: it makes those high-probability windows visually obvious, so you don’t waste time trading random hours where algos aren’t active.

Sunset Zones by PDVDescription
Sunset Zones by PDV is an intraday reference indicator that plots key horizontal levels based on selected “root candles” throughout the trading day. At each programmed time, the indicator identifies the high and low of the corresponding candle and projects those levels forward with extended lines, providing traders with a clean visual framework of potential intraday reaction zones.
These zones serve as reference levels for support, resistance, liquidity grabs, and session context, allowing traders to analyze how price reacts around time-specific structures. Unlike lagging indicators, Sunset Zones gives traders real-time, rule-based levels tied directly to the price action of specific moments in the session.
Key Features
Predefined Time Codes
The script comes with a curated list of intraday timestamps (in HHMM format). Each represents a “root candle” from which levels are generated. Examples include 03:12, 06:47, 07:41, 08:51, etc. These time codes can reflect historically important market moments such as session opens, liquidity sweeps, or volatility inflection points.
Automatic Zone Plotting
At each root time, the script captures the candle’s high and low and instantly extends those levels forward across the chart. This provides consistent, objective reference points for intraday trading.
Extended Lines
Levels are projected far into the future (default: 500 bars) so traders can easily track how price interacts with those zones throughout the day.
Color-Coded Levels
Each root time is assigned a distinct color for fast identification. For example:
03:12 → Fuchsia
06:47 → Purple
07:41 → Teal
08:51 → White
09:53 → White
10:20 → Orange
11:10 → Green
11:49 → Red
12:05 → White
13:05 → Teal
14:09 → Aqua
This helps traders quickly recognize which time-of-day level price is interacting with.
Lightweight & Visual
The indicator focuses purely on price and time, avoiding complexity or lagging signals. It can be layered with other analysis tools, order flow charts, or session-based studies.
Practical Use Cases
Intraday Bias:
Observe whether price respects, rejects, or consolidates around these reference levels to form a bias.
Liquidity Zones:
High/low sweeps of the root candle can act as liquidity pools where institutions might trigger stops or reversals.
Support & Resistance:
Extended lines create intraday S/R zones without the need to manually draw levels.
Confluence Finder:
Combine Sunset Zones with VWAP, session ranges, Fibonacci levels, or higher-timeframe structure for layered confluence.
Important Notes
This is a visual reference tool only. It does not generate buy or sell signals.
Default times are provided, but the concept is flexible — traders can adapt it by modifying or expanding the list of time codes.
Works best on intraday timeframes where session structure is most relevant (e.g., 1-minute to 15-minute charts).
✅ In short: Sunset Zones by PDV gives intraday traders a systematic way to anchor their charts to important time-based highs and lows, creating a consistent framework for analyzing price reactions across the day.

ADX Tide ZonesADX Tide Zones – Adaptive Momentum & Trend Strength Framework
Overview
ADX Tide Zones – Professional is a dynamic trend-strength visualizer designed for traders who want to interpret momentum with precision and context. By combining the Average Directional Index (ADX) with adaptive threshold logic, the indicator segments price action into distinct “tide zones” that reflect varying levels of market strength: Calm, Rising, Strong, and Falling Tides. These zones transform raw ADX readings into an interpretable framework that highlights when markets are consolidating, building momentum, trending strongly, or losing strength.
Unlike standard ADX readings, which can be difficult to interpret in real time, ADX Tide Zones translate momentum shifts into a continuous, color-coded system that traders can instantly read. Whether applied to scalping, intraday, or swing trading, the indicator offers a consistent methodology for identifying actionable opportunities across assets and timeframes.
How It Works
The foundation of ADX Tide Zones lies in momentum analysis via the ADX. By measuring the strength (not direction) of a trend, ADX provides an objective read on when markets are gaining or losing energy. ADX Tide Zones enhances this by applying threshold logic to classify ADX values into four distinct states:
Calm Tide : Low ADX values indicate sideways or consolidating conditions.
Rising Tide : ADX increases past a threshold, signaling momentum building.
Strong Tide : ADX remains elevated, confirming robust and sustained trend strength.
Falling Tide : ADX declines after strength, hinting at exhaustion or early reversal setups.
These states are displayed on the chart through adaptive visualizations (zones, bar colors, or overlays), offering real-time clarity on when to expect expansion, continuation, or contraction in price action.
Interpretation
Trend Analysis : By mapping transitions between tides, traders can instantly gauge whether markets are in accumulation, expansion, or exhaustion phases. Rising/Strong Tides reinforce trend continuation, while Falling Tides highlight weakening conditions.
Volatility & Risk Assessment : Shifts between Calm → Rising Tide often precede volatility expansions. Falling Tides can signal a period of compression or corrective moves, warning traders to manage risk proactively.
Market Context : The indicator does not dictate direction; instead, it overlays strength on top of price action, allowing traders to combine it with directional tools such as moving averages, order blocks, or liquidity zones for confirmation.
Strategy Integration
ADX Tide Zones adapts seamlessly to a wide range of trading strategies by translating momentum dynamics into actionable frameworks:
Trend Following : Traders can align with dominant flows by entering positions when the indicator confirms a Rising Tide or Strong Tide. These conditions signal persistent directional strength, making them ideal for continuation setups. Combining directional bias with ADX confirmation reduces the risk of trading against prevailing momentum.
Breakout Trading : When the market transitions from Calm Tide into a Rising Tide, it often precedes a volatility expansion. This shift highlights breakout conditions where accumulation gives way to impulsive price movement. Traders can use this transition as a timing tool to catch early entries into new momentum phases.
Exhaustion Reversals : Strong Tide phases don’t last forever—when they begin to fade into Falling Tide, it can mark trend fatigue or liquidity exhaustion. This offers contrarian traders an early edge in spotting overextended moves and positioning for corrective pullbacks or full reversals.
Multi-Timeframe Analysis : By overlaying higher timeframe tide zones on intraday or scalping charts, traders can filter noise and trade in alignment with larger flows. For example, combining a daily Rising Tide bias with a 15-minute breakout confirmation can significantly improve entry precision while reducing exposure to false signals.
Advanced Techniques
For traders seeking an extra edge, ADX Tide Zones can be pushed further with advanced methods:
Volume & Liquidity Confirmation : Pair the tide transitions with volume spikes, order flow, or liquidity sweep tools. When directional strength confirmed by the ADX coincides with institutional activity, it validates setups and increases probability of follow-through.
Cross-Asset Synchronization : Momentum rarely exists in isolation. Monitoring tide shifts across correlated instruments (e.g., majors vs. USD, or indices vs. risk assets) can uncover synchronized volatility events. These correlations help traders identify whether a move is isolated noise or part of a broader systemic trend.
Threshold Optimization : The sensitivity of ADX Tide Zones can be fine-tuned for different trading objectives. Lower thresholds heighten responsiveness, capturing micro-moves suitable for scalpers. Higher thresholds filter minor fluctuations, isolating major structural swings that align with swing or position trading.
Contextual Trade Management : Instead of using static stops or targets, traders can adapt risk management dynamically by tracking tide progression. For example, a trade initiated during Rising Tide may remain valid as long as conditions sustain, but partial profits or tighter stops can be applied once the zone shifts to Calm Tide.
Inputs & Customization
ADX Length : Define the lookback period for ADX calculation.
Threshold Levels : Adjust sensitivity for Calm, Rising, Strong, and Falling Tides.
Zone Visualization : Choose between bar coloring, background shading, or overlays.
Color Customization : Configure bullish, bearish, neutral, and tide-specific colors.
Multi-Timeframe Options : Enable tide readings from higher timeframes for confirmation.
Why Use ADX Tide Zones
ADX Tide Zones turns the complexity of momentum analysis into a visual system that highlights when markets are gearing up for moves, trending with conviction, or running out of steam. By combining adaptive ADX interpretation with customizable thresholds, traders can:
Anticipate breakouts before volatility expands.
Confirm the strength behind price trends.
Spot exhaustion phases early to secure profits or prepare for reversals.
Adapt strategies seamlessly between scalping, intraday, and swing trading.
With its balance of simplicity and depth, ADX Tide Zones provides a structured lens for reading market momentum, equipping traders with the clarity needed to execute with discipline and confidence.

AMD [TakingProphets]Overview
The AMD indicator is a real-time, high-resolution tool designed for traders following ICT methodology who want a clear visualization of higher timeframe (HTF) candles directly on their lower timeframe charts.
It overlays current HTF structure, including open, high, low, and close projections, allowing traders to align intraday decisions with institutional price delivery — all without switching timeframes.
Concept & Background
In ICT concepts, market behavior often follows a pattern of accumulation, manipulation, and distribution. Understanding these phases is essential for anticipating when price is likely to expand or reverse.
AMD automates this process by:
-Overlaying HTF candles directly on your lower timeframe chart.
-Projecting live levels like the current open, high, low, and close to map out evolving bias.
-Helping traders see whether price is accumulating orders, engineering liquidity sweeps, or distributing aggressively.
Key Features
Live HTF Candle Overlay
-Displays the full HTF candle — body, wicks, and directional bias — on your active chart in real time.
-Perfect for traders aligning intraday setups with broader HTF context.
Dynamic HTF Price Projections
-Plots the evolving open, high, low, and close for the current HTF candle.
-Each projection can be customized by color, style, labels, and visibility to fit your workflow.
Full Customization Control
-Adjust candle body widths, wick styles, and transparency.
-Configure projection lines and time labels in both 12h and 24h formats.
-Includes an optional Info Box showing instrument, timeframe, and session context.
Session Timing & Labeling
-Smart timestamping marks the start and close of each HTF candle.
-Helps traders anticipate potential expansions or reversals during killzones or liquidity events.
How to Use It
Select Your HTF Context
-Choose any timeframe overlay (e.g., 1H, 4H, 1D) to match your trading model.
-Monitor Live HTF Levels
-Watch how price interacts with current HTF highs, lows, and equilibrium levels in real time.
-Integrate With ICT Concepts
-Use alongside tools like SMT divergence, Order Blocks, or Liquidity Levels for confirmation and context.
-Refine Intraday Entries
-Check whether price is expanding in your favor before entering positions.
Best Practices
Combine AMD with ICT killzone sessions to monitor HTF behavior during high-liquidity periods.
Use it alongside correlated SMT divergence tools for stronger directional bias confirmation.
Who It’s For
Scalpers anchoring quick entries to HTF sentiment.
Intraday traders syncing 5m/15m setups with 1H/4H context.
Swing traders monitoring HTF ranges without switching charts.
Educators & analysts needing clean visual overlays for teaching and content creation.
Why It’s Useful
AMD doesn’t provide trading signals or predictive guarantees. Instead, it offers a clean, structured view of HTF price delivery — enabling traders to understand institutional intent as it unfolds and manage their execution with greater confidence.
