Bias + VWAP Pullback — v4 (PA + BOS/CHOCH)Simple idea: I identify the trend (bias) from the larger timeframe, and only trade pullbacks to the VWAP/EMA during liquidity (London/New York). When the trend is clear, gold moves strongly, and its pullbacks to the balance lines provide clear opportunities.
Timeframe and Sessions (Cairo Time)
Analysis: H1 to determine the trend.
Implementation: 5m (or 1m if professional).
Trading window:
London Opening: 10:00–12:30
New York Opening: 16:30–19:00
(avoid the rest of the day unless there is exceptional traffic).
Direction determination (BIAS)
On H1:
If the price is above the 200 EMA and the daily VWAP is bullish and the price is above it → uptrend (long-only).
If the price is below the 200 EMA and the daily VWAP is bearish and the price is below it → bearish trend (short-only).
Determine your levels: yesterday's high/low (PDH/PDL) + approximate Asia range (03:00–09:30).
Entry Rules (Setup A: Trend Continuation)
Asia range breakout towards Bias during liquidity window.
Wait for a withdrawal to:
Daily VWAP, or
EMA50 on 5m frame (best if both cross).
Confirmation: Confirmation low/high on 5m (HL buy/LH sell) + clear impulse candle (Body is greater than average of last 10 candles).
Entry:
Buy: When the price returns above VWAP/EMA50 with a confirmation candle close.
Sell: The exact opposite.
Stop Loss (SL): Below/above the last confirmation low/high or ATR(14, 5m) x 1.5 (largest).
Objectives:
TP1 = 1R (Close 50% and move the rest Break-even).
TP2 = 2.5R to 3R or at an important HTF level (PDH/PDL/Bid/Demand Zone).
Entry Rules (Setup B: Reversion to VWAP – “Mean Reversion”)
Use with extreme caution, once daily maximum:
Price deviation from VWAP by more than ~1.5 x ATR(14, 5m) with rejection candles appearing near PDH/PDL.
Reverse entry towards the return of VWAP.
SL small behind rejection top/bottom.
Main target: VWAP. (Don't get greedy — this scenario is for extended periods only.)
News Filtering and Risk Management
Avoid trading 15–30 minutes before/after strong US news (CPI, NFP, FOMC).
Maximum daily loss: 1.5–2% of account balance.
Risk per trade: 0.25–0.5% (if you are learning) or 0.5–1% (if you are experienced).
Do not exceed two consecutive losing trades per day.
Don't chase the market after the opportunity has passed — wait for the next pullback.
Smart Deal Management
After TP1: Move stop to entry point + trail the rest with EMA20 on 5m or ATR Trailing = ATR(14)×1.0.
If the price touches a strong daily level (PDH/PDL) and fails to break, consider taking additional profit.
If VWAP starts to flatten and breaks against the trend on H1, stop trading for the day.
Quick Checklist (Before Entry)
H1 trend is clear and consistent with 200EMA + VWAP.
Penetrating the Asia range towards Bias.
Clean pull to VWAP/EMA50 on 5m.
Confirmation candle and real push.
SL is logical (behind swing/ATR×1.5) and R :R ≥ 1:2.
No red news coming soon.
Example of "ready-made" settings
EMA: 20, 50, 200 on 5m, 200 only on H1.
VWAP: Daily (reset daily).
ATR: 14 on 5m.
Levels: PDH/PDL + Asia Band (03:00–09:30 Cairo).
Gold Notes
Gold is fast and sharp at the open; don't get in early — wait for the draw.
Fakeouts are common before news: it is best to call with the trend after the price returns above/below VWAP.
Don't expect 80% consistent wins every day — the advantage comes from discipline, filtering out bad days, and only withdrawing when you're on the right track.
تعتبر شركة الماسة الألمانية أحد المؤسسات العاملة بالمملكة العربية السعودية ولها تاريخ طويل من الخدمات الكثيرة والمتنوعة التى مازالت تقدمها للكثير من العملاء داخل جميع مدن وأحياء المملكة حيث نقدم أفضل ما لدينا من خلال مجموعة الشركات التالية والتي من خلالها ستتلقي كل ما تحتاج إلية في كل المجال المختلفة فنحن نعمل منذ عام 2015 ولنا سابقات اعمال فى مختلف المجالات الحيوية التى نخدم من خلالها عملائنا ونوفر لهم أرخص الأسعار وبأعلى جودة من الممكن توفرها فى المجالات التالية :-
خدمات تنظيف المنازل والفلل والشقق
خدمات عزل الخزانات تنظيف غسيل صيانة اصلاح
خدمات جلي البلاط والرخام والسيراميك
خدمات نقل العفش عمالة فلبينية مدربة
خدمات مكافحة الحشرات بجدة
كل هذة الخدمات وأكثر نوفرها لكل المتعاقدين بأفضل الطرق مع توفير خطط وبرامج متنوعة لأتمام العمل المسنود إلينا بأفضل وأحدث الطرق الحديثة والعصرية سواء فى شركات النظافة بجدة ومكة المكرمة أو شركات نقل العفش بجدة عمالة فلبينية وباقى الخدمات مثل جلي وتلميع الرخام بمكة وجدة ولا ننسي شركة مكافحة حشرات بجدة التى ساعدت آلاف المواطنين على تنظيف منازلهم من الحشرات بأفضل مبيدات حشرية.
在腳本中搜尋"liquidity"

ICT 00:00, 08:30, 09:30 & 13:30 Opens (NY) — Prior-Day HistoryICT 00:00, 08:30, 09:30 & 13:30 Opens (NY)
This is a derivative of ALPHAICTRADER’s open-source script, republished under the MPL-2.0 with clear attribution and documented changes. It plots four New-York–anchored intraday reference levels—0000, 0830, 0930, 1330—as short, right-padded stubs with clean side labels. Use these time anchors (ICT-style midnight + key US windows) to frame bias, volatility pockets, and intraday trade locations.
What’s original in this version (changes)
Right-padded stubs instead of chart-wide rays — each level ends N bars past the latest candle (configurable).
Side labels at the line tip — text-only labels (0000, 0830, 0930, 1330) that sit at the right end of each stub and update every bar.
Optional prior-day history — show Today only or Today + Prior Day; older lines/labels auto-pruned.
Per-anchor controls — Display, Style, Color, Width, and Show Label for each time.
What it plots (and why)
0000 (NY Midnight): daily session anchor for bias/liquidity context.
0830 (NY): macro data window (CPI/NFP/claims) where volatility often concentrates.
0930 (NY): US cash equity market open; opening-drive structure/acceptance tests.
1330 (NY): early-afternoon anchor for continuation vs. fade.
How it works (under the hood)
Session detection: time("1", session, "America/New_York"); first bar flagged via not na(ts) and na(ts ).
Anchor price: open of that first bar per session/day.
Rendering: lines drawn with xloc=bar_index from start bar to bar_index + Right Pad; x2 updates every bar (no extend.right).
Labels: placed at line.get_x2(line) + Label Pad, soft color variant; updated per bar to stay on the tip.
History: arrays keep either today only or today + yesterday and delete anything older immediately.
How to use
Add to any intraday chart (futures/FX/indices). Anchors are always NY-time; TradingView handles DST.
Inputs
00:00 / 08:30 / 09:30 / 13:30 (NY): Display, Line Style, Color, Width, Show Label
Right Edge: Right Pad (bars) · Label Pad (bars)
History: Show Prior Day (History) — off = today only; on = today + yesterday
Suggested pads: Right Pad 2–5 bars; Label Pad 0–2.
These are context anchors, not signals. Combine with your execution model (market structure, liquidity, FVG/OBs, etc.).
Attribution & License (MPL-2.0)
Original work: “ICT NEW YORK MIDNIGHT OPEN AND 8.30 AM OPEN” by ALPHAICTRADER (MPL-2.0).
This derivative: modifications listed above; source published and kept under MPL-2.0 per license terms.
If you distribute a modified version of this Pine file, you must keep MPL-2.0, retain the copyright/licensing header, publish your modified source, and document your changes.
Notes: Pine v5. Minimalist (no day dividers). Educational tool; not financial advice.
Copyright: © ALPHAICTRADER 2022 · © Funk 2025
License: MPL-2.0

Futures Key LevelsKey Levels — Sessions, Previous Ranges & Opens (Chicago-aligned sessions)
What it does
This indicator plots commonly used reference levels across multiple timeframes to help you frame the day and find confluence:
Sessions (Chicago TZ): London, New York, and Asia session high/low ranges.
Previous Period Ranges: Previous Day / Week / Month / Quarter / Year High/Low and optional Mid.
Opens: Current Daily / Weekly / Monthly / Quarterly / Yearly opens.
Intraday (4H): Previous 4-Hour High/Low + optional Mid.
Monday Range: Captures Monday’s High/Low (and optional Mid) to use as a weekly reference.
Price-scale markers: Optional markers that track key levels on the price scale without adding extra lines.
How it works (concepts & calculations)
Higher-timeframe values are retrieved using request.security() and update when a new period begins (e.g., previous day’s H/L become fixed at the start of the new day).
Session ranges are built from bar data within session windows using time(session, "America/Chicago"):
London: 02:00–05:00 CT
New York: 08:30–15:00 CT
Asia: 20:00–00:00 CT
“Mid” levels are simple midpoints between each period’s High and Low.
Merge Levels: when different levels land at the same price, their labels are merged to reduce clutter (e.g., “PDH / PWH”).
Why this version is useful / original bits
All-white baseline for clean charts; session colors stand out by design: London = Yellow, New York = Aquatic Blue, Asia = Red.
Right-anchored mode lets you park levels to the right side of the chart with a configurable anchor distance.
Label merging keeps the display minimal when multiple levels coincide.
Price-scale-only markers available when you prefer fewer lines on the chart.
Inputs & customization
Display Style: Standard or Right Anchored (+ distance controls).
Levels toggles: enable/disable each period (Daily/Weekly/Monthly/Quarterly/Yearly), Monday range, 4H range, and session ranges.
Text: optional shorthand labels (e.g., PDH/PDL, PWH/PWL).
Colors: global white theme, with session highlights; you can override in the Inputs.
Price-scale markers: on/off toggle.
How to use it
Use previous High/Low as liquidity pools and areas to watch for sweeps, breaks, or retests.
The Monday range often frames the rest of the week; breaks or rejections around Monday H/L can be informative.
The 4H previous range gives intraday context—great for mean-reversion vs. continuation reads.
Session ranges help you see where the active session expanded price and where liquidity may remain.
Notes & limitations
Sessions are computed in America/Chicago; higher-TF levels use the symbol’s exchange timezone.
This is an indicator, not a strategy; it does not place trades or claim performance.
Always combine levels with your own execution rules (structure, momentum, risk).
Credit: inspired by spacemanBTC; this version adds the all-white styling, Chicago-aligned sessions, right-anchoring, label merging, and price-scale markers.
Also my mentor to tell me about the levels
Disclaimer
This tool is for educational purposes only and is not financial advice. Markets involve risk; do your own research and manage risk appropriately.

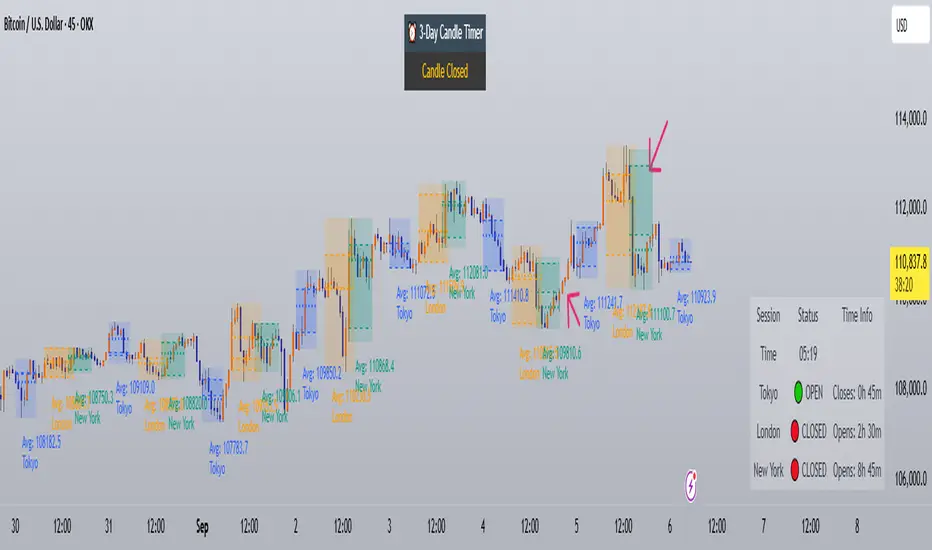
Trading Sessions with Holidays & Timer🌍 Trading Sessions Matter
Markets breathe in cycles. When Tokyo, London, or New York steps in, liquidity shifts and price often reacts fast.
Example: New York closed BTC at $110K, and when traders woke up, the price was already $113K. That gap says everything about overnight pressure and the next move.
⚡ Indicator Features
✅ Session boxes (Tokyo, London, NY) with custom colors & time zones
✅ Open/close lines → spot gaps & momentum
✅ Average price per session → see where pressure builds
✅ Tick range → quick volatility check
✅ 🏖 Holiday markers → avoid false quiet markets
✅ Live status table → session OPEN / CLOSED + countdown timer
🚀 How to Use
Works on intraday timeframes (1m–4h)
Watch session opens/closes → liquidity shift points
Compare ranges & averages between Tokyo, London, NY
Use the timer to prep before the next wave
This tool helps you visualize the heartbeat of global markets session by session.
🔖 #BTCUSDT #Forex #TradingSessions #Crypto #DayTrading
Artharjan High Volume Zones v2Artharjan High Volume Zones (AHVZ)
The Artharjan High Volume Zones (AHVZ) indicator is designed to identify, highlight, and track price zones formed during exceptionally high-volume bars. These levels often act as critical support and resistance zones, revealing where institutions or large players have shown significant interest.
By combining both short-term (ST) and long-term (LT) high-volume zones, the tool enables traders to align intraday activity with broader market structures.
Core Purpose
Markets often leave behind footprints in the form of high-volume bars. The AHVZ indicator captures these footprints and projects their influence forward, allowing traders to spot zones of liquidity, accumulation, or distribution where future price reactions are likely.
Key Features
🔹 Short-Term High Volume Zones (ST-ZoI)
Identifies the highest-volume bar within a short-term lookback period (default: 22 bars).
Draws and maintains:
Upper & Lower Bounds of the high-volume candle.
Midpoint Line (M-P) as the zone’s equilibrium.
Buffer Zones above and below for intraday flexibility (percentage-based).
Highlights these zones visually for quick intraday decision-making.
🔹 Long-Term High Volume Zones (LT-ZoI)
Scans for the highest-volume bar in a long-term lookback period (default: 252 bars).
Similar plotting structure as ST-ZoI: Upper, Lower, Midpoint, and Buffers.
Useful for identifying institutional footprints and multi-week/month accumulation zones.
🔹 Dynamic Buffering
Daily/Weekly/Monthly charts: Adds a fixed percentage buffer above and below high-volume zones.
Intraday charts: Uses price-range based buffers, scaling zones more adaptively to volatility.
🔹 Visual Customization
Independent color settings for ST and LT zones, mid-range lines, and buffers.
Adjustable plot thickness for clarity across different chart styles.
How It Helps
Intraday Traders
Use ST zones to pinpoint short-term supply/demand clusters.
Trade rejections or breakouts near these high-volume footprints.
Swing/Positional Traders
Align entries with LT zones to stay on the side of institutional flows.
Spot areas where price may stall, reverse, or consolidate.
General Market Structure Analysis
Understand where volume-backed conviction exists in the chart.
Avoid trading into hidden walls of liquidity by recognizing prior high-volume zones.
Closing Note
The Artharjan High Volume Zones indicator acts as a volume map of the market, giving traders a deeper sense of where meaningful battles between buyers and sellers took place. By combining short-term noise filtering with long-term structural awareness, it empowers traders to make more informed, disciplined decisions.
With Thanks,
Rrahul Desai @Artharjan

Martingale Strategy Simulator [BackQuant]Martingale Strategy Simulator
Purpose
This indicator lets you study how a martingale-style position sizing rule interacts with a simple long or short trading signal. It computes an equity curve from bar-to-bar returns, adapts position size after losing streaks, caps exposure at a user limit, and summarizes risk with portfolio metrics. An optional Monte Carlo module projects possible future equity paths from your realized daily returns.
What a martingale is
A martingale sizing rule increases stake after losses and resets after a win. In its classical form from gambling, you double the bet after each loss so that a single win recovers all prior losses plus one unit of profit. In markets there is no fixed “even-money” payout and returns are multiplicative, so an exact recovery guarantee does not exist. The core idea is unchanged:
Lose one leg → increase next position size
Lose again → increase again
Win → reset to the base size
The expectation of your strategy still depends on the signal’s edge. Sizing does not create positive expectancy on its own. A martingale raises variance and tail risk by concentrating more capital as a losing streak develops.
What it plots
Equity – simulated portfolio equity including compounding
Buy & Hold – equity from holding the chart symbol for context
Optional helpers – last trade outcome, current streak length, current allocation fraction
Optional diagnostics – daily portfolio return, rolling drawdown, metrics table
Optional Monte Carlo probability cone – p5, p16, p50, p84, p95 aggregate bands
Model assumptions
Bar-close execution with no slippage or commissions
Shorting allowed and frictionless
No margin interest, borrow fees, or position limits
No intrabar moves or gaps within a bar (returns are close-to-close)
Sizing applies to equity fraction only and is capped by your setting
All results are hypothetical and for education only.
How the simulator applies it
1) Directional signal
You pick a simple directional rule that produces +1 for long or −1 for short each bar. Options include 100 HMA slope, RSI above or below 50, EMA or SMA crosses, CCI and other oscillators, ATR move, BB basis, and more. The stance is evaluated bar by bar. When the stance flips, the current trade ends and the next one starts.
2) Sizing after losses and wins
Position size is a fraction of equity:
Initial allocation – the starting fraction, for example 0.15 means 15 percent of equity
Increase after loss – multiply the next allocation by your factor after a losing leg, for example 2.00 to double
Reset after win – return to the initial allocation
Max allocation cap – hard ceiling to prevent runaway growth
At a high level the size after k consecutive losses is
alloc(k) = min( cap , base × factor^k ) .
In practice the simulator changes size only when a leg ends and its PnL is known.
3) Equity update
Let r_t = close_t / close_{t-1} − 1 be the symbol’s bar return, d_{t−1} ∈ {+1, −1} the prior bar stance, and a_{t−1} the prior bar allocation fraction. The simulator compounds:
eq_t = eq_{t−1} × (1 + a_{t−1} × d_{t−1} × r_t) .
This is bar-based and avoids intrabar lookahead. Costs, slippage, and borrowing costs are not modeled.
Why traders experiment with martingale sizing
Mean-reversion contexts – if the signal often snaps back after a string of losses, adding size near the tail of a move can pull the average entry closer to the turn
Behavioral or microstructure edges – some rules have modest edge but frequent small whipsaws; size escalation may shorten time-to-recovery when the edge manifests
Exploration and stress testing – studying the relationship between streaks, caps, and drawdowns is instructive even if you do not deploy martingale sizing live
Why martingale is dangerous
Martingale concentrates capital when the strategy is performing worst. The main risks are structural, not cosmetic:
Loss streaks are inevitable – even with a 55 percent win rate you should expect multi-loss runs. The probability of at least one k-loss streak in N trades rises quickly with N.
Size explodes geometrically – with factor 2.0 and base 10 percent, the sequence is 10, 20, 40, 80, 100 (capped) after five losses. Without a strict cap, required size becomes infeasible.
No fixed payout – in gambling, one win at even odds resets PnL. In markets, there is no guaranteed bounce nor fixed profit multiple. Trends can extend and gaps can skip levels.
Correlation of losses – losses cluster in trends and in volatility bursts. A martingale tends to be largest just when volatility is highest.
Margin and liquidity constraints – leverage limits, margin calls, position limits, and widening spreads can force liquidation before a mean reversion occurs.
Fat tails and regime shifts – assumptions of independent, Gaussian returns can understate tail risk. Structural breaks can keep the signal wrong for much longer than expected.
The simulator exposes these dynamics in the equity curve, Max Drawdown, VaR and CVaR, and via Monte Carlo sketches of forward uncertainty.
Interpreting losing streaks with numbers
A rough intuition: if your per-trade win probability is p and loss probability is q=1−p , the chance of a specific run of k consecutive losses is q^k . Over many trades, the chance that at least one k-loss run occurs grows with the number of opportunities. As a sanity check:
If p=0.55 , then q=0.45 . A 6-loss run has probability q^6 ≈ 0.008 on any six-trade window. Across hundreds of trades, a 6 to 8-loss run is not rare.
If your size factor is 1.5 and your base is 10 percent, after 8 losses the requested size is 10% × 1.5^8 ≈ 25.6% . With factor 2.0 it would try to be 10% × 2^8 = 256% but your cap will stop it. The equity curve will still wear the compounded drawdown from the sequence that led to the cap.
This is why the cap setting is central. It does not remove tail risk, but it prevents the sizing rule from demanding impossible positions
Note: The p and q math is illustrative. In live data the win rate and distribution can drift over time, so real streaks can be longer or shorter than the simple q^k intuition suggests..
Using the simulator productively
Parameter studies
Start with conservative settings. Increase one element at a time and watch how the equity, Max Drawdown, and CVaR respond.
Initial allocation – lower base reduces volatility and drawdowns across the board
Increase factor – set modestly above 1.0 if you want the effect at all; doubling is aggressive
Max cap – the most important brake; many users keep it between 20 and 50 percent
Signal selection
Keep sizing fixed and rotate signals to see how streak patterns differ. Trend-following signals tend to produce long wrong-way streaks in choppy ranges. Mean-reversion signals do the opposite. Martingale sizing interacts very differently with each.
Diagnostics to watch
Use the built-in metrics to quantify risk:
Max Drawdown – worst peak-to-trough equity loss
Sharpe and Sortino – volatility and downside-adjusted return
VaR 95 percent and CVaR – tail risk measures from the realized distribution
Alpha and Beta – relationship to your chosen benchmark
If you would like to check out the original performance metrics script with multiple assets with a better explanation on all metrics please see
Monte Carlo exploration
When enabled, the forecast draws many synthetic paths from your realized daily returns:
Choose a horizon and a number of runs
Review the bands: p5 to p95 for a wide risk envelope; p16 to p84 for a narrower range; p50 as the median path
Use the table to read the expected return over the horizon and the tail outcomes
Remember it is a sketch based on your recent distribution, not a predictor
Concrete examples
Example A: Modest martingale
Base 10 percent, factor 1.25, cap 40 percent, RSI>50 signal. You will see small escalations on 2 to 4 loss runs and frequent resets. The equity curve usually remains smooth unless the signal enters a prolonged wrong-way regime. Max DD may rise moderately versus fixed sizing.
Example B: Aggressive martingale
Base 15 percent, factor 2.0, cap 60 percent, EMA cross signal. The curve can look stellar during favorable regimes, then a single extended streak pushes allocation to the cap, and a few more losses drive deep drawdown. CVaR and Max DD jump sharply. This is a textbook case of high tail risk.
Strengths
Bar-by-bar, transparent computation of equity from stance and size
Explicit handling of wins, losses, streaks, and caps
Portable signal inputs so you can A–B test ideas quickly
Risk diagnostics and forward uncertainty visualization in one place
Example, Rolling Max Drawdown
Limitations and important notes
Martingale sizing can escalate drawdowns rapidly. The cap limits position size but not the possibility of extended adverse runs.
No commissions, slippage, margin interest, borrow costs, or liquidity limits are modeled.
Signals are evaluated on closes. Real execution and fills will differ.
Monte Carlo assumes independent draws from your recent return distribution. Markets often have serial correlation, fat tails, and regime changes.
All results are hypothetical. Use this as an educational tool, not a production risk engine.
Practical tips
Prefer gentle factors such as 1.1 to 1.3. Doubling is usually excessive outside of toy examples.
Keep a strict cap. Many users cap between 20 and 40 percent of equity per leg.
Stress test with different start dates and subperiods. Long flat or trending regimes are where martingale weaknesses appear.
Compare to an anti-martingale (increase after wins, cut after losses) to understand the other side of the trade-off.
If you deploy sizing live, add external guardrails such as a daily loss cut, volatility filters, and a global max drawdown stop.
Settings recap
Backtest start date and initial capital
Initial allocation, increase-after-loss factor, max allocation cap
Signal source selector
Trading days per year and risk-free rate
Benchmark symbol for Alpha and Beta
UI toggles for equity, buy and hold, labels, metrics, PnL, and drawdown
Monte Carlo controls for enable, runs, horizon, and result table
Final thoughts
A martingale is not a free lunch. It is a way to tilt capital allocation toward losing streaks. If the signal has a real edge and mean reversion is common, careful and capped escalation can reduce time-to-recovery. If the signal lacks edge or regimes shift, the same rule can magnify losses at the worst possible moment. This simulator makes those trade-offs visible so you can calibrate parameters, understand tail risk, and decide whether the approach belongs anywhere in your research workflow.

Advanced Range Analyzer ProAdvanced Range Analyzer Pro – Adaptive Range Detection & Breakout Forecasting
Overview
Advanced Range Analyzer Pro is a comprehensive trading tool designed to help traders identify consolidations, evaluate their strength, and forecast potential breakout direction. By combining volatility-adjusted thresholds, volume distribution analysis, and historical breakout behavior, the indicator builds an adaptive framework for navigating sideways price action. Instead of treating ranges as noise, this system transforms them into opportunities for mean reversion or breakout trading.
How It Works
The indicator continuously scans price action to identify active range environments. Ranges are defined by volatility compression, repeated boundary interactions, and clustering of volume near equilibrium. Once detected, the indicator assigns a strength score (0–100), which quantifies how well-defined and compressed the consolidation is.
Breakout probabilities are then calculated by factoring in:
Relative time spent near the upper vs. lower range boundaries
Historical breakout tendencies for similar structures
Volume distribution inside the range
Momentum alignment using auxiliary filters (RSI/MACD)
This creates a live probability forecast that updates as price evolves. The tool also supports range memory, allowing traders to analyze the last completed range after a breakout has occurred. A dynamic strength meter is displayed directly above each consolidation range, providing real-time insight into range compression and breakout potential.
Signals and Breakouts
Advanced Range Analyzer Pro includes a structured set of visual tools to highlight actionable conditions:
Range Zones – Gradient-filled boxes highlight active consolidations.
Strength Meter – A live score displayed in the dashboard quantifies compression.
Breakout Labels – Probability percentages show bias toward bullish or bearish continuation.
Breakout Highlights – When a breakout occurs, the range is marked with directional confirmation.
Dashboard Table – Displays current status, strength, live/last range mode, and probabilities.
These elements update in real time, ensuring that traders always see the current state of consolidation and breakout risk.
Interpretation
Range Strength : High scores (70–100) indicate strong consolidations likely to resolve explosively, while low scores suggest weak or choppy ranges prone to false signals.
Breakout Probability : Directional bias greater than 60% suggests meaningful breakout pressure. Equal probabilities indicate balanced compression, favoring mean-reversion strategies.
Market Context : Ranges aligned with higher timeframe trends often resolve in the dominant direction, while counter-trend ranges may lead to reversals or liquidity sweeps.
Volatility Insight : Tight ranges with low ATR imply imminent expansion; wide ranges signal extended consolidation or distribution phases.
Strategy Integration
Advanced Range Analyzer Pro can be applied across multiple trading styles:
Breakout Trading : Enter on probability shifts above 60% with confirmation of volume or momentum.
Mean Reversion : Trade inside ranges with high strength scores by fading boundaries and targeting equilibrium.
Trend Continuation : Focus on ranges that form mid-trend, anticipating continuation after consolidation.
Liquidity Sweeps : Use failed breakouts at boundaries to capture reversals.
Multi-Timeframe : Apply on higher timeframes to frame market context, then execute on lower timeframes.
Advanced Techniques
Combine with volume profiles to identify areas of institutional positioning within ranges.
Track sequences of strong consolidations for trend development or exhaustion signals.
Use breakout probability shifts in conjunction with order flow or momentum indicators to refine entries.
Monitor expanding/contracting range widths to anticipate volatility cycles.
Custom parameters allow fine-tuning sensitivity for different assets (crypto, forex, equities) and trading styles (scalping, intraday, swing).
Inputs and Customization
Range Detection Sensitivity : Controls how strictly ranges are defined.
Strength Score Settings : Adjust weighting of compression, volume, and breakout memory.
Probability Forecasting : Enable/disable directional bias and thresholds.
Gradient & Fill Options : Customize range visualization colors and opacity.
Dashboard Display : Toggle live vs last range, info table size, and position.
Breakout Highlighting : Choose border/zone emphasis on breakout events.
Why Use Advanced Range Analyzer Pro
This indicator provides a data-driven approach to trading consolidation phases, one of the most common yet underutilized market states. By quantifying range strength, mapping probability forecasts, and visually presenting risk zones, it transforms uncertainty into clarity.
Whether you’re trading breakouts, fading ranges, or mapping higher timeframe context, Advanced Range Analyzer Pro delivers a structured, adaptive framework that integrates seamlessly into multiple strategies.

VWAP Confluência 3x VWAP Confluence 3x — Daily · Weekly · Anchored
Purpose
A pragmatic VWAP suite for execution and risk management. It plots three institutional reference lines: Daily VWAP, Weekly VWAP, and an Anchored VWAP (AVWAP) starting from a user-defined event (news, earnings, session open, swing high/low).
Why it matters
VWAP is the market’s “fair price” weighted by where volume actually traded. Confluence across timeframes and events turns noisy charts into actionable bias and clean levels.
What it does
Daily VWAP — resets each trading day; intraday “fair value.”
Weekly VWAP — resets each week; swing context and larger player defense.
Anchored VWAP — starts at a precise timestamp you set (e.g., news release).
Price source toggle — Typical Price
(
𝐻
+
𝐿
+
𝐶
)
/
3
(H+L+C)/3 or Close.
Visibility switches — enable/disable each line independently.
Anchor marker — labels the first bar of the AVWAP.
Inputs
Show Daily VWAP (on/off)
Show Weekly VWAP (on/off)
Show Anchored VWAP (on/off)
Price Source: Typical (H+L+C)/3 or Close
Anchor Time: timestamp of your event (uses the chart/exchange timezone)
How to anchor to a news event
Find the exact release time as shown in your chart’s timezone.
Open the indicator settings → set Anchor Time to that minute.
The AVWAP begins at that bar and accumulates forward.
Playbook (examples, not signals)
Strong long bias: price above Daily and Weekly VWAP; AVWAP reclaimed after news.
Strong short bias: price below Daily and Weekly; AVWAP reject after news.
Mean-revert zones: price stretches far from the active VWAPs and snaps back; size around VWAP with tight risk.
Targets: opposite VWAP, prior day/week highs/lows, or liquidity pools near AVWAP.
Best used with
Session highs/lows, liquidity sweeps, volume profile, and time-of-day filters.
Notes & limitations
Works best on markets with reliable volume (equities, futures, liquid crypto). FX spot uses synthetic volume—interpret accordingly.
Anchor Time respects the chart’s timezone. Convert news times before setting.
This is an indicator, not a backtestable strategy. No trade advice.
Disclaimer
For educational purposes only. Trading involves risk. Do your own research and manage risk responsibly.

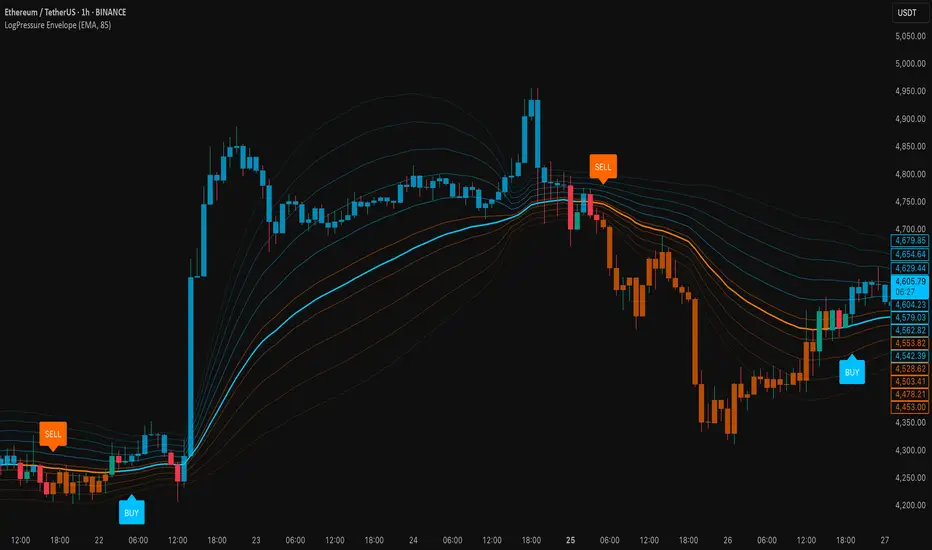
LogPressure Envelope [BOSWaves]LogPressure Envelope – Adaptive Volatility & Trend Visualizer
Overview
LogPressure Envelope is a specialized trading tool designed to normalize market behavior using logarithmic price scaling while providing an adaptive framework for volatility and trend detection. The indicator calculates a log-based moving average midline, surrounds it with asymmetric volatility envelopes, and replaces the conventional cloud with progressive fan lines to present price action in a more interpretable form.
By integrating rate-of-change midline coloring, fading trend strength, and structured buy/sell markers, LogPressure Envelope simplifies the reading of complex market dynamics. Its design makes it suitable for multiple trading approaches, including scalping, intraday, and swing trading, where volatility behavior and trend shifts must be understood quickly and objectively.
Unlike static envelope indicators, LogPressure Envelope adapts continuously to price scale and volatility conditions. It evaluates log-transformed prices, applies configurable moving average methods (EMA, SMA, WMA), and derives asymmetric standard-deviation bands for both upside and downside moves. These envelopes are projected as fan lines with adjustable opacity, producing a layered volatility map that evolves with the market.
This system ensures each visual element—midline shading, candle coloring, fan structure, and signal markers—reflects real-time market conditions, allowing traders to interpret volatility expansion, contraction, and directional bias with clarity.
How It Works
The foundation of LogPressure Envelope is the logarithmic transformation of price. By operating in log space, the indicator removes distortions caused by large nominal price differences across assets, enabling consistent analysis of both low-priced and high-priced instruments.
A moving average of log prices is calculated (EMA, SMA, or WMA depending on user input) and then re-converted to normal price scale, forming the log midline. Standard deviation of log prices is then measured over a separate period, with independent multipliers for upside and downside deviations. This asymmetry captures the fact that markets often expand differently in bullish versus bearish phases.
Instead of plotting a filled cloud, the envelope is expressed as ten equidistant fan lines stretching from the lower to upper boundary. Each line is shaded progressively to visualize volatility clustering and directional strength without overloading the chart.
Trend determination is smoothed using a fade mechanism: shifts in bias do not flip instantly but gradually move toward the new state, producing fewer false transitions. Buy and sell markers are generated when trend strength crosses confirmation thresholds, ensuring signals are event-driven and contextually meaningful.
Signals and Visuals
LogPressure Envelope provides multiple layers of structured signals:
Midline Bias – Central moving average colored by rate-of-change, reflecting directional acceleration or deceleration.
Volatility Fan – Ten progressive lines forming a gradient between lower and upper bands, visually encoding volatility spread.
Buy Signals – Labels below bars when upward trend strength is confirmed.
Sell Signals – Labels above bars when downward trend strength is confirmed.
Candle Coloring – Optional shading of candles based on trend alignment with the log midline, highlighting bullish, bearish, or neutral conditions.
These signals remain clear even during high-volatility phases, with visual hierarchy maintained through progressive opacity control.
Interpretation
Trend Analysis : Midline direction and candle coloring provide continuous feedback on prevailing bias. Upward-sloping midlines with blue shading indicate bullish phases, while downward slopes with orange shading confirm bearish conditions.
Volatility and Risk Assessment : Expansion of fan lines indicates rising volatility and potential breakout conditions; contraction indicates consolidation and possible mean reversion.
Signal Confirmation : Buy and sell markers validate transitions when trend strength thresholds are crossed, aligning with volatility envelope dynamics.
Market Context : Asymmetric envelopes allow traders to see where bearish acceleration differs from bullish expansion, improving interpretation of liquidity conditions and institutional pressure.
Strategy Integration
LogPressure Envelope can be applied across trading styles:
Trend Following : Enter trades in the direction of midline bias, confirmed by buy or sell markers.
Pullback Entries : Use midline retests during trending conditions as lower-risk continuation points.
Volatility Breakouts : Identify sharp expansions in fan line spacing as early signals of directional moves.
Reversal Strategies : Fade extreme envelope touches when momentum shows exhaustion and fan contraction begins.
Multi-Timeframe Confirmation : Align signals from higher and lower timeframes to reduce noise and validate trade setups.
Stop-loss levels can be set near the opposite envelope boundary, while targets may be managed through progressive volatility zones or midline convergence.
Advanced Techniques
For greater precision, LogPressure Envelope can be combined with other analytical tools:
Pair with volume or liquidity measures to validate breakout or reversal conditions.
Use momentum indicators to confirm ROC-based midline bias.
Track sequences of fan line expansions and contractions to anticipate regime shifts in volatility.
Apply across multiple timeframes to monitor how volatility clusters align at different market scales.
Adjusting parameters such as envelope multipliers, moving average type, and fade bars allows the indicator to adapt to diverse asset classes and volatility environments.
Inputs and Customization
Midline Type : Select EMA, SMA, or WMA.
Line Opacity : Control visibility of fan lines.
Enable Candle Coloring : Toggle trend-based bar shading.
MA Length / StdDev Length : Define periods for midline and volatility calculation.
Multipliers : Set asymmetric scaling for upside and downside envelopes.
Fade Bars : Control smoothness of trend strength transitions.
Fan Lines : Adjust number of envelope subdivisions for visualization granularity.
Why Use LogPressure Envelope
LogPressure Envelope translates complex volatility and trend interactions into a structured and adaptive framework. By combining logarithmic normalization, asymmetric standard deviation envelopes, and smoothed trend confirmation, it allows traders to:
Normalize price analysis across assets of different scales.
Visualize volatility expansion and contraction in real time.
Identify and confirm directional shifts with objective signal markers.
Apply a disciplined system for trend, breakout, and reversal strategies.
This indicator is designed for traders who want a systematic, visually clear approach to volatility-based market analysis without relying on static bands or arbitrary scaling.
HorizonSigma Pro [CHE]HorizonSigma Pro
Disclaimer
Not every timeframe will yield good results . Very short charts are dominated by microstructure noise, spreads, and slippage; signals can flip and the tradable edge shrinks after costs. Very high timeframes adapt more slowly, provide fewer samples, and can lag regime shifts. When you change timeframe, you also change the ratios between horizon, lookbacks, and correlation windows—what works on M5 won’t automatically hold on H1 or D1. Liquidity, session effects (overnight gaps, news bursts), and volatility do not scale linearly with time. Always validate per symbol and timeframe, then retune horizon, z-length, correlation window, and either the neutral band or the z-threshold. On fast charts, “components” mode adapts quicker; on slower charts, “super” reduces noise. Keep prior-shift and calibration enabled, monitor Hit Rate with its confidence interval and the Brier score, and execute only on confirmed (closed-bar) values.
For example, what do “UP 61%” and “DOWN 21%” mean?
“UP 61%” is the model’s estimated probability that the close will be higher after your selected horizon—directional probability, not a price target or profit guarantee. “DOWN 21%” still reports the probability of up; here it’s 21%, which implies 79% for down (a short bias). The label switches to “DOWN” because the probability falls below your short threshold. With a neutral-band policy, for example ±7%, signals are: Long above 57%, Short below 43%, Neutral in between. In z-score mode, fixed z-cutoffs drive the call instead of percentages. The arrow length on the chart is an ATR-scaled projection to visualize reach; treat it as guidance, not a promise.
Part 1 — Scientific description
Objective.
The indicator estimates the probability that price will be higher after a user-defined horizon (a chosen number of bars) and emits long, short, or neutral decisions under explicit thresholds. It combines multi‑feature, z‑normalized inputs, adaptive correlation‑based weighting, a prior‑shifted sigmoid mapping, optional rolling probability calibration, and repaint‑safe confirmation. It also visualizes an ATR‑scaled forward projection and prints a compact statistics panel.
Data and labeling.
For each bar, the target label is whether price increased over the past chosen horizon. Learning is deliberately backward‑looking to avoid look‑ahead: features are associated with outcomes that are only known after that horizon has elapsed.
Feature engineering.
The feature set includes momentum, RSI, stochastic %K, MACD histogram slope, a normalized EMA(20/50) trend spread, ATR as a share of price, Bollinger Band width, and volume normalized by its moving average. All features are standardized over rolling windows. A compressed “super‑feature” is available that aggregates core trend and momentum components while penalizing excessive width (volatility). Users can switch between a “components” mode (weighted sum of individual features) and a “super” mode (single compressed driver).
Weighting and learning.
Weights are the rolling correlations between features (evaluated one horizon ago) and realized directional outcomes, smoothed by an EMA and optionally clamped to a bounded range to stabilize outliers. This produces an adaptive, regime‑aware weighting without explicit machine‑learning libraries.
Scoring and probability mapping.
The raw score is either the weighted component sum or the weighted super‑feature. The score is standardized again and passed through a sigmoid whose steepness is user‑controlled. A “prior shift” moves the sigmoid’s midpoint to the current base rate of up moves, estimated over the evaluation window, so that probabilities remain well‑calibrated when markets drift bullish or bearish. Probabilities and standardized scores are EMA‑smoothed for stability.
Decision policy.
Two modes are supported:
- Neutral band: go long if the probability is above one half plus a user‑set band; go short if it is below one half minus that band; otherwise stay neutral.
- Z‑score thresholds: use symmetric positive/negative cutoffs on the standardized score to trigger long/short.
Repaint protection.
All values used for decisions can be locked to confirmed (closed) bars. Intrabar updates are available as a preview, but confirmed values drive evaluation and stats.
Calibration.
An optional rolling linear calibration maps past confirmed probabilities to realized outcomes over the evaluation window. The mapping is clipped to the unit interval and can be injected back into the decision logic if desired. This improves reliability (probabilities that “mean what they say”) without necessarily improving raw separability.
Evaluation metrics.
The table reports: hit rate on signaled bars; a Wilson confidence interval for that hit rate at a chosen confidence level; Brier score as a measure of probability accuracy; counts of long/short trades; average realized return by side; profit factor; net return; and exposure (signal density). All are computed on rolling windows consistent with the learning scheme.
Visualization.
On the chart, an arrowed projection shows the predicted direction from the current bar to the chosen horizon, with magnitude scaled by ATR (optionally scaled by the square‑root of the horizon). Labels display either the decision probability or the standardized score. Neutral states can display a configurable icon for immediate recognition.
Computational properties.
The design relies on rolling means, standard deviations, correlations, and EMAs. Per‑bar cost is constant with respect to history length, and memory is constant per tracked series. Graphical objects are updated in place to obey platform limits.
Assumptions and limitations.
The method is correlation‑based and will adapt after regime changes, not before them. Calibration improves probability reliability but not necessarily ranking power. Intrabar previews are non‑binding and should not be evaluated as historical performance.
Part 2 — Trader‑facing description
What it does.
This tool tells you how likely price is to be higher after your chosen number of bars and converts that into Long / Short / Neutral calls. It learns, in real time, which components—momentum, trend, volatility, breadth, and volume—matter now, adjusts their weights, and shows you a probability line plus a forward arrow scaled by volatility.
How to set it up.
1) Choose your horizon. Intraday scalps: 5–10 bars. Swings: 10–30 bars. The default of 14 bars is a balanced starting point.
2) Pick a feature mode.
- components: granular and fast to adapt when leadership rotates between signals.
- super: cleaner single driver; less noise, slightly slower to react.
3) Decide how signals are triggered.
- Neutral band (probability based): intuitive and easy to tune. Widen the band for fewer, higher‑quality trades; tighten to catch more moves.
- Z‑score thresholds: consistent numeric cutoffs that ignore base‑rate drift.
4) Keep reliability helpers on. Leave prior shift and calibration enabled to stabilize probabilities across bullish/bearish regimes.
5) Smoothing. A short EMA on the probability or score reduces whipsaws while preserving turns.
6) Overlay. The arrow shows the call and a volatility‑scaled reach for the next horizon. Treat it as guidance, not a promise.
Reading the stats table.
- Hit Rate with a confidence interval: your recent accuracy with an uncertainty range; trust the range, not only the point.
- Brier Score: lower is better; it checks whether a stated “70%” really behaves like 70% over time.
- Profit Factor, Net Return, Exposure: quick triage of tradability and signal density.
- Average Return by Side: sanity‑check that the long and short calls each pull their weight.
Typical adjustments.
- Too many trades? Increase the neutral band or raise the z‑threshold.
- Missing the move? Tighten the band, or switch to components mode to react faster.
- Choppy timeframe? Lengthen the z‑score and correlation windows; keep calibration on.
- Volatility regime change? Revisit the ATR multiplier and enable square‑root scaling of horizon.
Execution and risk.
- Size positions by volatility (ATR‑based sizing works well).
- Enter on confirmed values; use intrabar previews only as early signals.
- Combine with your market structure (levels, liquidity zones). This model is statistical, not clairvoyant.
What it is not.
Not a black‑box machine‑learning model. It is transparent, correlation‑weighted technical analysis with strong attention to probability reliability and repaint safety.
Suggested defaults (robust starting point).
- Horizon 14; components mode; weight EMA 10; correlation window 500; z‑length 200.
- Neutral band around seven percentage points, or z‑threshold around one‑third of a standard deviation.
- Prior shift ON, Calibration ON, Use calibrated for decisions OFF to start.
- ATR multiplier 1.0; square‑root horizon scaling ON; EMA smoothing 3.
- Confidence setting equivalent to about 95%.
Disclaimer
No indicator guarantees profits. HorizonSigma Pro is a decision aid; always combine with solid risk management and your own judgment. Backtest, forward test, and size responsibly.
The content provided, including all code and materials, is strictly for educational and informational purposes only. It is not intended as, and should not be interpreted as, financial advice, a recommendation to buy or sell any financial instrument, or an offer of any financial product or service. All strategies, tools, and examples discussed are provided for illustrative purposes to demonstrate coding techniques and the functionality of Pine Script within a trading context.
Any results from strategies or tools provided are hypothetical, and past performance is not indicative of future results. Trading and investing involve high risk, including the potential loss of principal, and may not be suitable for all individuals. Before making any trading decisions, please consult with a qualified financial professional to understand the risks involved.
By using this script, you acknowledge and agree that any trading decisions are made solely at your discretion and risk.
Enhance your trading precision and confidence 🚀
Best regards
Chervolino

Trapped Traders [ScorsoneEnterprises]This indicator identifies and visualizes trapped traders - market participants caught on the wrong side of price movements with significant volume imbalances. By analyzing volume delta at specific price levels, it reveals where traders are likely experiencing unrealized losses and may be forced to exit their positions.
The point of this tool is to identify where the liquidity in a trend may be.
var lowerTimeframe = switch
useCustomTimeframeInput => lowerTimeframeInput
timeframe.isseconds => "1S"
timeframe.isintraday => "1"
timeframe.isdaily => "5"
=> "60"
= ta.requestVolumeDelta(lowerTimeframe)
price_quantity = map.new()
is_red_candle = close < open
is_green_candle = close > open
for i=0 to lkb-1 by 1
current_vol = price_quantity.get(close)
new_vol = na(current_vol) ? lastVolume : current_vol + lastVolume
price_quantity.put(close, new_vol)
if is_green_candle and new_vol < 0
price_quantity.put(close, new_vol)
else if is_red_candle and new_vol > 0
price_quantity.put(close, new_vol)
We see in this snippet, the lastVolume variable is the most recent volume delta we can receive from the lower timeframe, we keep updating the price level we're keeping track of with that lastVolume from the lower timeframe.
This is the bulk of the concept as this level and size gives us the idea of how many traders were on the wrong side of the trend, and acting as liquidity for the profitable entries. The more, the stronger.
There are 3 ways to visualize this. A basic label, that will display the size and if positive or negative next to the bar, a gradient line that goes 10 bars to the future to be used as a support or resistance line that includes the quantity, and a bubble chart with the quantity. The larger the quantity, the bigger the bubble.
We see in this example on NYMEX:CL1! that there are lines plotted throughout this price action that price interacts with in meaningful way. There are consistently many levels for us.
Here on CME_MINI:ES1! we see the labels on the chart, and the size set to large. It is the same concept just another way to view it.
This chart of CME_MINI:RTY1! shows the bubble chart visualization. It is a way to view it that is pretty non invasive on the chart.
Every timeframe is supported including daily, weekly, and monthly.
The included settings are the display style, like mentioned above. If the user would like to see the volume numbers on the chart. The text size along with the transparency percentage. Following that is the settings for which lower timeframe to calculate the volume delta on. Finally, if you would like to see your inputs in the status line.
No indicator is 100% accurate, use "Trapped Traders" along with your own discretion.

Advanced Price Ranges ICTThis indicator automatically divides price into fixed ranges (configurable in points or pips) and plots important reference levels such as the high, low, 50% midpoint, and 25%/75% quarters. It is designed to help traders visualize structured price movement, spot confluence zones, and frame their trading bias around clean range-based levels.
🔹 Key Features
Custom Range Size: Define ranges in points (e.g., 100, 50, 25, 10) or in Forex pips.
Forex Mode: Automatically adapts pip size (0.0001 or 0.01 for JPY pairs).
Dynamic Anchoring: Price ranges automatically align to the current price, snapping into blocks.
Multiple Ranges: Option to extend visualization above and below the current active block for a complete grid.
Level Types:
High / Low of the range
50% midpoint
25% and 75% quarters
Custom Styling: Adjustable line colors and widths for each level type.
Labels: Optional right-edge labels showing level type and exact price.
Alerts: Built-in alerts for when price crosses the range high, low, or 50% midpoint.
🔹 Use Cases
Quickly map out 100/50/25/10 point structures like Zeussy’s advanced price range method.
Identify key reaction levels where liquidity is often built or swept.
Support ICT-style concepts like range-based bias, fair value gaps, and liquidity pools.
Works for indices, futures, crypto, and forex.
🔹 Customization
Range increments can be set to any size (default 100).
Toggle which levels are shown (High/Low, Midpoint, Quarters).
Adjustable line widths, colors, and label visibility.
Extend ranges above and below for broader market context.

TURNOVER FOR THE DAY TURNOVER FOR THE DAY
1. Turnover in Volume Terms (Share Turnover)
This refers to the total number of shares traded in a stock or the whole market during a day.
It includes both buy and sell transactions (since every buy has a corresponding sell, exchanges count the total traded quantity).
Example:
If Reliance Industries had 50 lakh shares traded today, then its turnover in volume = 50,00,000 shares.
This shows liquidity and activity level of the stock.
2. Turnover in Stock Market Terms (Value Turnover / Trading Value)
This refers to the total money value of shares traded in a stock or the market during a day.
Formula:
Turnover (Value)
=
Total Shares Traded
×
Average/Trade Price
Turnover (Value)=Total Shares Traded×Average/Trade Price
🔑 Difference
Volume turnover = Quantity traded (in shares).
Value turnover = Amount of money involved (in ₹ / $).
Both are used:
Volume turnover helps measure liquidity (how actively a stock is traded).
Value turnover helps gauge the capital flow or market participation in money terms.

FlowStateTrader FlowState Trader - Advanced Time-Filtered Strategy
## Overview
FlowState Trader is a sophisticated algorithmic trading strategy that combines precision entry signals with intelligent time-based filtering and adaptive risk management. Built for traders seeking to achieve their optimal performance state, FlowState identifies high-probability trading opportunities within user-defined time windows while employing dynamic trailing stops and partial position management.
## Core Strategy Philosophy
FlowState Trader operates on the principle that peak trading performance occurs when three elements align: **Focus** (precise entry signals), **Flow** (optimal time windows), and **State** (intelligent position management). This strategy excels at finding reversal opportunities at key support and resistance levels while filtering out suboptimal trading periods to keep traders in their optimal flow state.
## Key Features
### 🎯 Focus Entry System
**Support/Resistance Zone Trading**:
- Dynamic identification of key price levels using configurable lookback periods
- Entry signals triggered when price interacts with these critical zones
- Volume confirmation ensures genuine breakout/reversal momentum
- Trend filter alignment prevents counter-trend disasters
**Entry Conditions**:
- **Long Signals**: Price closes above support buffer, touches support level, with above-average volume
- **Short Signals**: Price closes below resistance buffer, touches resistance level, with above-average volume
- Optional trend filter using EMA or SMA for directional bias confirmation
### ⏰ FlowState Time Filtering System
**Comprehensive Time Controls**:
- **12-Hour Format Trading Windows**: User-friendly AM/PM time selection
- **Multi-Timezone Support**: UTC, EST, PST, CST with automatic conversion
- **Day-of-Week Filtering**: Trade only weekdays, weekends, or both
- **Lunch Hour Avoidance**: Automatically skips low-volume lunch periods (12-1 PM)
- **Visual Time Indicators**: Background coloring shows active/inactive trading periods
**Smart Time Features**:
- Handles overnight trading sessions seamlessly
- Prevents trades during historically poor performance periods
- Customizable trading hours for different market sessions
- Real-time trading window status in dashboard
### 🛡️ Adaptive Risk Management
**Multi-Level Take Profit System**:
- **TP1**: First profit target with optional partial position closure
- **TP2**: Final profit target for remaining position
- **Flexible Scaling**: Choose number of contracts to close at each level
**Dynamic Trailing Stop Technology**:
- **Three Operating Modes**:
- **Conservative**: Earlier activation, tighter trailing (protect profits)
- **Balanced**: Optimal risk/reward balance (recommended)
- **Aggressive**: Later activation, wider trailing (let winners run)
- **ATR-Based Calculations**: Adapts to current market volatility
- **Automatic Activation**: Engages when position reaches profitability threshold
### 📊 Intelligent Position Sizing
**Contract-Based Management**:
- Configurable entry quantity (1-1000 contracts)
- Partial close quantities for profit-taking
- Clear position tracking and P&L monitoring
- Real-time position status updates
### 🎨 Professional Visualization
**Enhanced Chart Elements**:
- **Entry Zone Highlighting**: Clear visual identification of trading opportunities
- **Dynamic Risk/Reward Lines**: Real-time TP and SL levels with price labels
- **Trailing Stop Visualization**: Live tracking of adaptive stop levels
- **Support/Resistance Lines**: Key level identification
- **Time Window Background**: Visual confirmation of active trading periods
**Dual Dashboard System**:
- **Strategy Dashboard**: Real-time position info, settings status, and current levels
- **Performance Scorecard**: Live P&L tracking, win rates, and trade statistics
- **Customizable Sizing**: Small, Medium, or Large display options
### ⚙️ Comprehensive Customization
**Core Strategy Settings**:
- **Lookback Period**: Support/resistance calculation period (5-100 bars)
- **ATR Configuration**: Period and multipliers for stops/targets
- **Reward-to-Risk Ratios**: Customizable profit target calculations
- **Trend Filter Options**: EMA/SMA selection with adjustable periods
**Time Filter Controls**:
- **Trading Hours**: Start/end times in 12-hour format
- **Timezone Selection**: Four major timezone options
- **Day Restrictions**: Weekend-only, weekday-only, or unrestricted
- **Session Management**: Lunch hour avoidance and custom periods
**Risk Management Options**:
- **Trailing Stop Modes**: Conservative/Balanced/Aggressive presets
- **Partial Close Settings**: Enable/disable with custom quantities
- **Alert System**: Comprehensive notifications for all trade events
### 📈 Performance Tracking
**Real-Time Metrics**:
- Net profit/loss calculation
- Win rate percentage
- Profit factor analysis
- Maximum drawdown tracking
- Total trade count and breakdown
- Current position P&L
**Trade Analytics**:
- Winner/loser ratio tracking
- Real-time performance scorecard
- Strategy effectiveness monitoring
- Risk-adjusted return metrics
### 🔔 Alert System
**Comprehensive Notifications**:
- Entry signal alerts with price and quantity
- Take profit level hits (TP1 and TP2)
- Stop loss activations
- Trailing stop engagements
- Position closure notifications
## Strategy Logic Deep Dive
### Entry Signal Generation
The strategy identifies high-probability reversal points by combining multiple confirmation factors:
1. **Price Action**: Looks for price interaction with key support/resistance levels
2. **Volume Confirmation**: Ensures sufficient market interest and liquidity
3. **Trend Alignment**: Optional filter prevents counter-trend positions
4. **Time Validation**: Only trades during user-defined optimal periods
5. **Zone Analysis**: Entry occurs within calculated buffer zones around key levels
### Risk Management Philosophy
FlowState Trader employs a three-tier risk management approach:
1. **Initial Protection**: ATR-based stop losses set at strategy entry
2. **Profit Preservation**: Trailing stops activate once position becomes profitable
3. **Scaled Exit**: Partial profit-taking allows for both security and potential
### Time-Based Edge
The time filtering system recognizes that not all trading hours are equal:
- Avoids low-volume, high-spread periods
- Focuses on optimal liquidity windows
- Prevents trading during news events (lunch hours)
- Allows customization for different market sessions
## Best Practices and Optimization
### Recommended Settings
**For Scalping (1-5 minute charts)**:
- Lookback Period: 10-20
- ATR Period: 14
- Trailing Stop: Conservative mode
- Time Filter: Major session hours only
**For Day Trading (15-60 minute charts)**:
- Lookback Period: 20-30
- ATR Period: 14-21
- Trailing Stop: Balanced mode
- Time Filter: Extended trading hours
**For Swing Trading (4H+ charts)**:
- Lookback Period: 30-50
- ATR Period: 21+
- Trailing Stop: Aggressive mode
- Time Filter: Disabled or very broad
### Market Compatibility
- **Forex**: Excellent for major pairs during active sessions
- **Stocks**: Ideal for liquid stocks during market hours
- **Futures**: Perfect for index and commodity futures
- **Crypto**: Effective on major cryptocurrencies (24/7 capability)
### Risk Considerations
- **Market Conditions**: Performance varies with volatility regimes
- **Timeframe Selection**: Lower timeframes require tighter risk management
- **Position Sizing**: Never risk more than 1-2% of account per trade
- **Backtesting**: Always test on historical data before live implementation
## Educational Value
FlowState serves as an excellent learning tool for:
- Understanding support/resistance trading
- Learning proper time-based filtering
- Mastering trailing stop techniques
- Developing systematic trading approaches
- Risk management best practices
## Disclaimer
This strategy is for educational and informational purposes only. Past performance does not guarantee future results. Trading involves substantial risk of loss and is not suitable for all investors. Users should thoroughly backtest the strategy and understand all risks before live trading. Always use proper position sizing and never risk more than you can afford to lose.
---
*FlowState Trader represents the evolution of systematic trading - combining classical technical analysis with modern risk management and intelligent time filtering to help traders achieve their optimal performance state through systematic, disciplined execution.*

STOCK EXCHANGE + SILVER BULLET FRAMESThis script is an updated version of the " NY/LDN/TOK Stock Exchange Opening Hours " script.
Objective
Displays global stock exchange sessions (New York, London, Tokyo) with session frames, highs/lows, and opening lines. Includes ICT Silver Bullet windows (NY, London, Tokyo) with configurable shading. Past sessions are frozen at close, ongoing sessions update dynamically until closure, and upcoming sessions are pre-drawn. Fully customizable with options for weekends, labels, padding, opacity, and individual session toggles.
It is designed to help traders quickly interpret market context, liquidity zones, and session-based price behavior.
Main Features
Past sessions (historical data)
• Session Frames:
• Each box is frozen at the session’s close.
• The left edge aligns with the opening time, while the right edge is fixed at the closing time.
• The top and bottom reflect the highest and lowest prices during the session.
• Session Labels:
• Names (NY, LDN, TOK) displayed above the frame, aligned left, in the same color as the frame.
• Opening Lines:
• Vertical dotted lines mark the start of each session.
Ongoing and upcoming sessions (live market)
• Dynamic Session Frames:
• The right edge is locked at the future close time.
• The top and bottom update in real time as new highs and lows form.
• Labels and Lines:
• The session label is visible above the active frame.
• Opening lines are drawn as soon as the session begins.
Silver Bullet Time Windows (ICT concept)
• Highlights key liquidity windows within sessions:
• New York: 10:00–11:00 and 14:00–15:00
• London: 08:00–09:00
• Tokyo: 09:00–10:00
• Silver Bullet zones are shaded with configurable opacity (default 5%).
Customization and Options
• Enable or disable individual sessions (NY, London, Tokyo).
• Toggle weekend display (frames and Silver Bullets).
• Adjust label size, padding, and text visibility.
• Control frame opacity (default 0%).
• Optimized memory management with automatic pruning of old graphical objects.

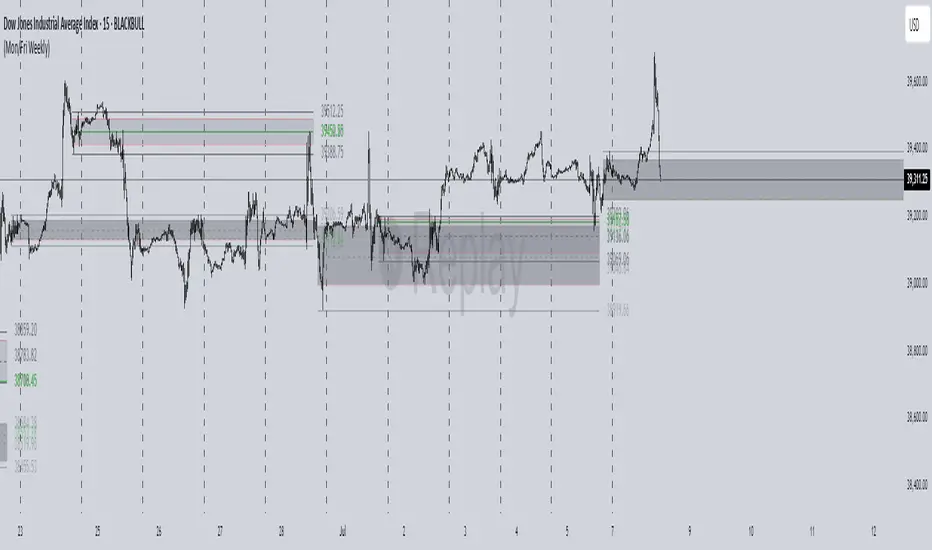
Cheat CodeWhy Monday & Friday
Monday evening (NY): frequently seeds the weekly expansion. Its DR/IDR often acts as a weekly “starter envelope,” useful for breakout continuation or fade back into the box plays as liquidity builds.
Friday evening (NY): often exposes end-of-week traps (run on stops into the close) and sets expectation boundaries into the following week. Carry these levels forward to catch Monday’s reaction to Friday’s closing structure.
Typical use-cases
Breakout & retest:
Price closes outside the Monday DR/IDR → look for retests of the band edge for continuation.
Liquidity sweep (“trap”) recognition:
Friday session wicks briefly beyond Friday DR/IDR then closes back inside → watch for mean reversion early next week.
Bias filter:
Above both Monday DR midline and Friday DR midline → bias long until proven otherwise; the inverse for shorts.
Session open confluence:
Reactions at the open line frequently mark decision points for momentum vs. fade setups.
(This is a levels framework, not a signals engine. Combine with your execution model: orderflow, S/R, session timing, or higher-TF bias.)
Inputs & styling (quick reference)
Display toggles (per day):
Show DR / IDR / Middle DR / Middle IDR
Show Opening Line
Show DR/IDR Box (choose DR or IDR as box source)
Show Price Labels
Style controls (per day):
Line width (1–4), style (Solid/Dashed/Dotted)
Independent colors for DR, IDR, midlines, open line
Box background opacity
Timezone:
Default America/New_York (changeable).
Optional on-chart warning if your chart TZ differs.
Practical notes
Works on intraday charts; levels are anchored using weekly timestamps for accuracy on any symbol.
Live updating: During the Mon/Fri calc windows, DR/IDR highs/lows and midlines keep updating until the session ends.
Clean drawings: Lines, box, and labels are created once per session and then extended/updated—efficient on resources even with long display windows.
Max elements: Script reserves ample line/box/label capacity for stability across weeks.
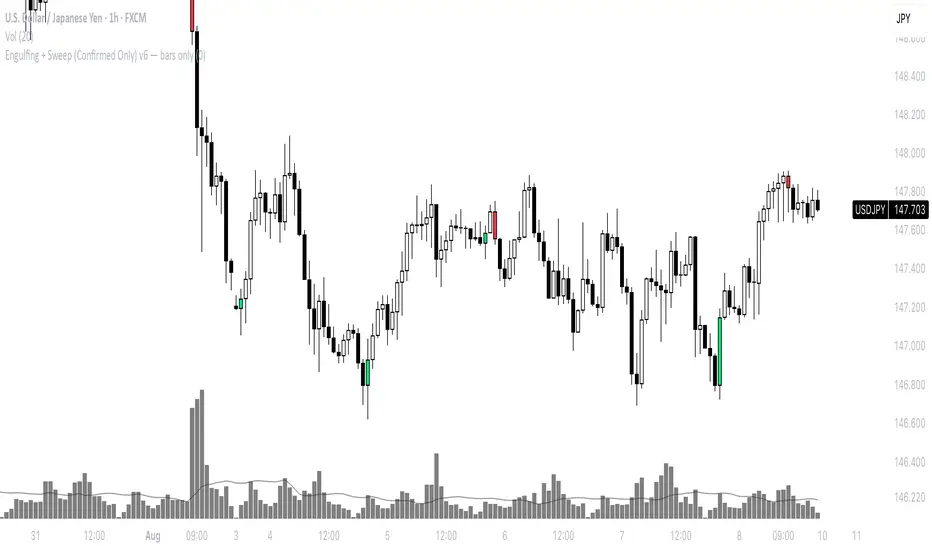
Engulfing + Sweep (Confirmed Only) v6 — bars onlyMarks bullish/bearish engulfing candles with liquidity sweeps and confirms them on the next candle — no repaint.
✳️ Features:
• 🟩 Bullish Engulfing + Low Sweep
• 🟥 Bearish Engulfing + High Sweep
• 🎛 Require opposite-color previous candle (optional)
• 📏 Min body-to-range filter
• 🔔 Alerts on confirmation candle
🎯 Best for:
• Price action & reversal traders
• Liquidity sweep confluence setups
Nifty50 Swing Trading Super Indicator# 🚀 Nifty50 Swing Trading Super Indicator - Complete Guide
**Created by:** Gaurav
**Date:** August 8, 2025
**Version:** 1.0 - Optimized for Indian Markets
---
## 📋 Table of Contents
1. (#quick-start-guide)
2. (#indicator-overview)
3. (#installation-instructions)
4. (#parameter-settings)
5. (#signal-interpretation)
6. (#trading-strategy)
7. (#risk-management)
8. (#optimization-tips)
9. (#troubleshooting)
---
## 🎯 Quick Start Guide
### What You Get
✅ **2 Complete Pine Script Indicators:**
- `swing_trading_super_indicator.pine` - Universal version for all markets
- `nifty_optimized_super_indicator.pine` - Specifically optimized for Nifty50 & Indian stocks
✅ **Key Features:**
- Multi-component signal confirmation system
- Optimized for daily and 3-hour timeframes
- Built-in risk management with dynamic stops and targets
- Real-time signal strength monitoring
- Gap analysis for Indian market characteristics
### Immediate Setup
1. Copy the Pine Script code from `nifty_optimized_super_indicator.pine`
2. Paste into TradingView Pine Editor
3. Add to chart on daily or 3-hour timeframe
4. Look for 🚀BUY and 🔻SELL signals
5. Use the information table for signal confirmation
---
## 🔍 Indicator Overview
### Core Components Integration
**🎯 Range Filter (35% Weight)**
- Primary trend identification using adaptive volatility filtering
- Optimized sampling period: 21 bars for Indian market volatility
- Enhanced range multiplier: 3.0 to handle market gaps
- Provides trend direction and strength measurement
**⚡ PMAX (30% Weight)**
- Volatility-adjusted trend confirmation using ATR-based calculations
- Dynamic multiplier adjustment based on market volatility
- 14-period ATR with 2.5 multiplier for swing trading sensitivity
- Offers trailing stop functionality
**🏗️ Support/Resistance (20% Weight)**
- Dynamic level identification using pivot point analysis
- Tighter channel width (3%) for precise Indian market levels
- Enhanced strength calculation with historical interaction weighting
- Provides entry/exit timing and breakout signals
**📊 EMA Alignment (15% Weight)**
- Multi-timeframe moving average confirmation
- Key EMAs: 9, 21, 50, 200 (popular in Indian markets)
- Hierarchical alignment scoring for trend strength
- Additional trend validation layer
### Advanced Features
**🌅 Gap Analysis**
- Automatic detection of significant price gaps (>2%)
- Gap strength measurement and impact on signals
- Specific optimization for Indian market overnight gaps
- Visual gap markers on chart
**⏰ Multi-Timeframe Integration**
- Higher timeframe bias from daily/weekly data
- Configurable daily bias weight (default 70%)
- 3-hour confirmation for precise entry timing
- Prevents counter-trend trades against major timeframe
**🛡️ Risk Management**
- Dynamic stop-loss calculation using multiple methods
- Automatic profit target identification
- Position sizing guidance based on signal strength
- Anti-whipsaw logic to prevent false signals
---
## 📥 Installation Instructions
### Step 1: Access TradingView
1. Open TradingView.com
2. Navigate to Pine Editor (bottom panel)
3. Create a new indicator
### Step 2: Copy the Code
**For Nifty50 & Indian Stocks (Recommended):**
```pinescript
// Copy entire content from nifty_optimized_super_indicator.pine
```
**For Universal Use:**
```pinescript
// Copy entire content from swing_trading_super_indicator.pine
```
### Step 3: Configure and Apply
1. Click "Add to Chart"
2. Select daily or 3-hour timeframe
3. Adjust parameters if needed (defaults are optimized)
4. Enable alerts for signal notifications
### Step 4: Verify Installation
- Check that all components are visible
- Confirm information table appears in top-right
- Test with known trending stocks for signal validation
---
## ⚙️ Parameter Settings
### 🎯 Range Filter Settings
```
Sampling Period: 21 (optimized for Indian market volatility)
Range Multiplier: 3.0 (handles overnight gaps effectively)
Source: Close (most reliable for swing trading)
```
### ⚡ PMAX Settings
```
ATR Length: 14 (standard for daily/3H timeframes)
ATR Multiplier: 2.5 (balanced for swing trading sensitivity)
Moving Average Type: EMA (responsive to price changes)
MA Length: 14 (matches ATR period for consistency)
```
### 🏗️ Support/Resistance Settings
```
Pivot Period: 8 (shorter for Indian market dynamics)
Channel Width: 3% (tighter for precise levels)
Minimum Strength: 3 (higher quality levels only)
Maximum Levels: 4 (focus on strongest levels)
Lookback Period: 150 (sufficient historical data)
```
### 🚀 Super Indicator Settings
```
Signal Sensitivity: 0.65 (balanced for swing trading)
Trend Strength Requirement: 0.75 (high quality signals)
Gap Threshold: 2.0% (significant gap detection)
Daily Bias Weight: 0.7 (strong higher timeframe influence)
```
### 🎨 Display Options
```
Show Range Filter: ✅ (trend visualization)
Show PMAX: ✅ (trailing stops)
Show S/R Levels: ✅ (key price levels)
Show Key EMAs: ✅ (trend confirmation)
Show Signals: ✅ (buy/sell alerts)
Show Trend Background: ✅ (visual trend state)
Show Gap Markers: ✅ (gap identification)
```
---
## 📊 Signal Interpretation
### 🚀 BUY Signals
**Requirements for BUY Signal:**
- Price above Range Filter with upward trend
- PMAX showing bullish direction (MA > PMAX line)
- Support/resistance breakout or favorable positioning
- EMA alignment supporting upward movement
- Higher timeframe bias confirmation
- Overall signal strength > 75%
**Signal Strength Indicators:**
- **90-100%:** Extremely strong - Maximum position size
- **80-89%:** Very strong - Large position size
- **75-79%:** Strong - Standard position size
- **65-74%:** Moderate - Reduced position size
- **<65%:** Weak - Wait for better opportunity
### 🔻 SELL Signals
**Requirements for SELL Signal:**
- Price below Range Filter with downward trend
- PMAX showing bearish direction (MA < PMAX line)
- Resistance breakdown or unfavorable positioning
- EMA alignment supporting downward movement
- Higher timeframe bias confirmation
- Overall signal strength > 75%
### ⚖️ NEUTRAL Signals
**Characteristics:**
- Conflicting signals between components
- Low overall signal strength (<65%)
- Range-bound market conditions
- Wait for clearer directional bias
### 📈 Information Table Guide
**Component Status:**
- **BULL/BEAR:** Current signal direction
- **Strength %:** Component contribution strength
- **Status:** Additional context (STRONG/WEAK/ACTIVE/etc.)
**Overall Signal:**
- **🚀 STRONG BUY:** All systems aligned bullish
- **🔻 STRONG SELL:** All systems aligned bearish
- **⚖️ NEUTRAL:** Mixed or weak signals
---
## 💼 Trading Strategy
### Daily Timeframe Strategy
**Setup:**
1. Apply indicator to daily chart of Nifty50 or Indian stocks
2. Wait for 🚀BUY or 🔻SELL signal with >75% strength
3. Confirm higher timeframe bias alignment
4. Check for significant support/resistance levels
**Entry:**
- Enter on signal bar close or next bar open
- Use 3-hour chart for precise entry timing
- Avoid entries during major news events
- Consider gap analysis for overnight positions
**Position Sizing:**
- **>90% Strength:** 3-4% of portfolio
- **80-89% Strength:** 2-3% of portfolio
- **75-79% Strength:** 1-2% of portfolio
- **<75% Strength:** Avoid or minimal size
### 3-Hour Timeframe Strategy
**Setup:**
1. Confirm daily timeframe bias first
2. Apply indicator to 3-hour chart
3. Look for signals aligned with daily trend
4. Use for entry/exit timing optimization
**Entry Refinement:**
- Wait for 3H signal confirmation
- Enter on pullbacks to key levels
- Use tighter stops for better risk/reward
- Monitor intraday support/resistance
### Risk Management Rules
**Stop Loss Placement:**
1. **Primary:** Use indicator's dynamic stop level
2. **Secondary:** Below/above nearest support/resistance
3. **Maximum:** 2-3% of portfolio per trade
4. **Trailing:** Move stops with PMAX line
**Profit Taking:**
1. **Target 1:** First resistance/support level (50% position)
2. **Target 2:** Second resistance/support level (30% position)
3. **Runner:** Trail remaining 20% with PMAX
**Position Management:**
- Review positions at daily close
- Adjust stops based on new signals
- Exit if trend changes to opposite direction
- Reduce size during high volatility periods
---
## 🎯 Optimization Tips
### For Nifty50 Trading
- Use daily timeframe for primary signals
- Monitor sector rotation impact
- Consider index futures for better liquidity
- Watch for RBI policy and global cues impact
### For Individual Stocks
- Verify stock follows Nifty correlation
- Check sector-specific news and events
- Ensure adequate liquidity for position size
- Monitor earnings calendar for volatility
### Market Condition Adaptations
**Trending Markets:**
- Increase position sizes for strong signals
- Use wider stops to avoid whipsaws
- Focus on trend continuation signals
- Reduce counter-trend trading
**Range-Bound Markets:**
- Reduce position sizes
- Use tighter stops and quicker profits
- Focus on support/resistance bounces
- Increase signal strength requirements
**High Volatility Periods:**
- Reduce overall exposure
- Use smaller position sizes
- Increase stop-loss distances
- Wait for clearer signals
### Performance Monitoring
- Track win rate and average profit/loss
- Monitor signal quality over time
- Adjust parameters based on market changes
- Keep trading journal for pattern recognition
---
## 🔧 Troubleshooting
### Common Issues
**Q: Signals appear too frequently**
A: Increase "Trend Strength Requirement" to 0.8-0.9
**Q: Missing obvious trends**
A: Decrease "Signal Sensitivity" to 0.5-0.6
**Q: Too many false signals**
A: Enable "3H Confirmation" and increase strength requirements
**Q: Indicator not loading**
A: Check Pine Script version compatibility (requires v5)
### Parameter Adjustments
**For More Sensitive Signals:**
- Decrease Signal Sensitivity to 0.5-0.6
- Decrease Trend Strength Requirement to 0.6-0.7
- Increase Range Filter multiplier to 3.5-4.0
**For More Conservative Signals:**
- Increase Signal Sensitivity to 0.7-0.8
- Increase Trend Strength Requirement to 0.8-0.9
- Enable all confirmation features
### Performance Issues
- Reduce lookback periods if chart loads slowly
- Disable some visual elements for better performance
- Use on liquid stocks/indices for best results
---
## 📞 Support & Updates
This super indicator combines the best of Range Filter, PMAX, and Support/Resistance analysis specifically optimized for Indian market swing trading. The multi-component approach significantly improves signal quality while the built-in risk management features help protect capital.
**Remember:** No indicator is 100% accurate. Always combine with proper risk management, market analysis, and your trading experience for best results.
**Happy Trading! 🚀**

HTFSweep – Structure & ResolveThis indicator isolates higher timeframe Open, High, Low, and Close levels and projects them onto lower timeframes.
It is designed as a structural lens, not a trading signal — a tool for experienced operators who study how intraday price interacts with higher‑timeframe liquidity anchors.
Key Features:
Selectable higher timeframe (default: Daily).
Plots Open, High, Low, Close lines across intraday charts.
Bullish/Bearish candle bodies shaded for context.
Background fill between High and Low for zone visualization.
Purpose:
This script is not a “buy/sell” tool. It is a scope, intentionally minimal, highlighting a repeating place of structural and liquidity significance. Use it to track sweeps of higher‑timeframe levels and confirm structural shifts intraday.
⚠️ Disclaimer: This script provides market structure visualization only. It does not generate trading signals or financial advice.
COMEX_MINI:MGC1!
Titan Wick Zone IndicatorThe Titan Wick Zone Indicator visually highlights the upper and lower wick regions of each candlestick on your chart, helping traders instantly identify areas where price was aggressively rejected (top wick) or absorbed (bottom wick). The indicator fills the area above the candle body to the wick high in red (sell zone), and the area below the candle body to the wick low in green (buy zone), both with adjustable opacity for clear visibility.
How to Use:
Spot Rejection and Absorption:
The red-filled upper wick zone marks where upward price moves were sharply rejected by sellers, often indicating supply, resistance, or “stop hunt” zones.
The green-filled lower wick zone marks where downward price moves were absorbed by buyers, pointing to potential demand, support, or accumulation zones.
Enhance Price Action Analysis:
Use these zones to avoid entering trades at price extremes, spot potential reversals, and find areas of confluence with support/resistance, Fibonacci levels, or order blocks.
Risk Management:
The indicator helps visualize where liquidity hunts or false breakouts may occur, so you can better place stop losses outside of volatile wick zones.
Ideal For:
Price action traders, scalpers, and swing traders seeking a visual edge in spotting supply/demand dynamics, liquidity zones, and wick-driven traps.

AymaN Entry Signal – With HTF + Pin Bar + Multi TP + BE + V1Ayman Entry Signal – Indicator Description
Overview
Ayman Entry Signal – With HTF + Pin Bar + Multi TP + BE + Stats Panel (V1)
This is a professional-grade Pine Script indicator designed for scalping and intraday trading, with full trade management, multi-confirmation logic, and advanced visualization. The tool is ideal for traders focused on XAUUSD (Gold), Forex, and other volatile instruments who seek both precision entries and structured exits with dynamic risk control.
Main Features
Advanced Entry Logic:
- EMA fast/slow crossovers (configurable)
- Optional conditions: Break of Structure (BoS), Order Block (OB), Fair Value Gap (FVG), Liquidity sweeps, Pin Bars
- HTF confirmation using EMA or BoS
- Real-time entry condition display
Trade Management:
- Dynamic calculation of Entry, SL (with ATR buffer), TP1, TP2
- Supports Partial Close and Break Even logic after TP1
- Visual PnL label (dynamic and color-coded)
Statistics Panel:
- Shows total trades, win/loss/breakeven count, cumulative PnL
- Filter by custom date or session
- Fully customizable panel appearance
Trade Visualization:
- Trade box includes all trade levels (Entry, SL, TP1, TP2)
- Visual display of trade conditions and PnL result
- Option to keep previous trades on chart
Alert System:
- Alerts for Buy and Sell entries
- Compatible with webhook automation systems like MT5/MT4
Customization & Inputs
- Capital & risk per trade
- Value per pip/point
- SL buffer (ATR-based)
- Manual EMA override
- Enable/disable: EMA, BoS, OB, FVG, Liquidity, Pin Bars
- HTF: timeframe + confirmation logic
- Trade box/labels visibility
- Full color customization
- PnL label position: top, center, or bottom
Recommended Use
- Ideal for Gold scalping (XAUUSD), also effective for Forex
- Best on 1m–15m charts; use HTF confirmation from 15m–4H
- Pairs well with semi-automated systems using alerts and webhooks
Disclaimer
Note: This is a non-executing indicator. It does not place trades but provides visual and statistical guidance for professional manual or semi-automated trading.

Drawdown Distribution Analysis (DDA) ACADEMIC FOUNDATION AND RESEARCH BACKGROUND
The Drawdown Distribution Analysis indicator implements quantitative risk management principles, drawing upon decades of academic research in portfolio theory, behavioral finance, and statistical risk modeling. This tool provides risk assessment capabilities for traders and portfolio managers seeking to understand their current position within historical drawdown patterns.
The theoretical foundation of this indicator rests on modern portfolio theory as established by Markowitz (1952), who introduced the fundamental concepts of risk-return optimization that continue to underpin contemporary portfolio management. Sharpe (1966) later expanded this framework by developing risk-adjusted performance measures, most notably the Sharpe ratio, which remains a cornerstone of performance evaluation in financial markets.
The specific focus on drawdown analysis builds upon the work of Chekhlov, Uryasev and Zabarankin (2005), who provided the mathematical framework for incorporating drawdown measures into portfolio optimization. Their research demonstrated that traditional mean-variance optimization often fails to capture the full risk profile of investment strategies, particularly regarding sequential losses. More recent work by Goldberg and Mahmoud (2017) has brought these theoretical concepts into practical application within institutional risk management frameworks.
Value at Risk methodology, as comprehensively outlined by Jorion (2007), provides the statistical foundation for the risk measurement components of this indicator. The coherent risk measures framework developed by Artzner et al. (1999) ensures that the risk metrics employed satisfy the mathematical properties required for sound risk management decisions. Additionally, the focus on downside risk follows the framework established by Sortino and Price (1994), while the drawdown-adjusted performance measures implement concepts introduced by Young (1991).
MATHEMATICAL METHODOLOGY
The core calculation methodology centers on a peak-tracking algorithm that continuously monitors the maximum price level achieved and calculates the percentage decline from this peak. The drawdown at any time t is defined as DD(t) = (P(t) - Peak(t)) / Peak(t) × 100, where P(t) represents the asset price at time t and Peak(t) represents the running maximum price observed up to time t.
Statistical distribution analysis forms the analytical backbone of the indicator. The system calculates key percentiles using the ta.percentile_nearest_rank() function to establish the 5th, 10th, 25th, 50th, 75th, 90th, and 95th percentiles of the historical drawdown distribution. This approach provides a complete picture of how the current drawdown compares to historical patterns.
Statistical significance assessment employs standard deviation bands at one, two, and three standard deviations from the mean, following the conventional approach where the upper band equals μ + nσ and the lower band equals μ - nσ. The Z-score calculation, defined as Z = (DD - μ) / σ, enables the identification of statistically extreme events, with thresholds set at |Z| > 2.5 for extreme drawdowns and |Z| > 3.0 for severe drawdowns, corresponding to confidence levels exceeding 99.4% and 99.7% respectively.
ADVANCED RISK METRICS
The indicator incorporates several risk-adjusted performance measures that extend beyond basic drawdown analysis. The Sharpe ratio calculation follows the standard formula Sharpe = (R - Rf) / σ, where R represents the annualized return, Rf represents the risk-free rate, and σ represents the annualized volatility. The system supports dynamic sourcing of the risk-free rate from the US 10-year Treasury yield or allows for manual specification.
The Sortino ratio addresses the limitation of the Sharpe ratio by focusing exclusively on downside risk, calculated as Sortino = (R - Rf) / σd, where σd represents the downside deviation computed using only negative returns. This measure provides a more accurate assessment of risk-adjusted performance for strategies that exhibit asymmetric return distributions.
The Calmar ratio, defined as Annual Return divided by the absolute value of Maximum Drawdown, offers a direct measure of return per unit of drawdown risk. This metric proves particularly valuable for comparing strategies or assets with different risk profiles, as it directly relates performance to the maximum historical loss experienced.
Value at Risk calculations provide quantitative estimates of potential losses at specified confidence levels. The 95% VaR corresponds to the 5th percentile of the drawdown distribution, while the 99% VaR corresponds to the 1st percentile. Conditional VaR, also known as Expected Shortfall, estimates the average loss in the worst 5% of scenarios, providing insight into tail risk that standard VaR measures may not capture.
To enable fair comparison across assets with different volatility characteristics, the indicator calculates volatility-adjusted drawdowns using the formula Adjusted DD = Raw DD / (Volatility / 20%). This normalization allows for meaningful comparison between high-volatility assets like cryptocurrencies and lower-volatility instruments like government bonds.
The Risk Efficiency Score represents a composite measure ranging from 0 to 100 that combines the Sharpe ratio and current percentile rank to provide a single metric for quick asset assessment. Higher scores indicate superior risk-adjusted performance relative to historical patterns.
COLOR SCHEMES AND VISUALIZATION
The indicator implements eight distinct color themes designed to accommodate different analytical preferences and market contexts. The EdgeTools theme employs a corporate blue palette that matches the design system used throughout the edgetools.org platform, ensuring visual consistency across analytical tools.
The Gold theme specifically targets precious metals analysis with warm tones that complement gold chart analysis, while the Quant theme provides a grayscale scheme suitable for analytical environments that prioritize clarity over aesthetic appeal. The Behavioral theme incorporates psychology-based color coding, using green to represent greed-driven market conditions and red to indicate fear-driven environments.
Additional themes include Ocean, Fire, Matrix, and Arctic schemes, each designed for specific market conditions or user preferences. All themes function effectively with both dark and light mode trading platforms, ensuring accessibility across different user interface configurations.
PRACTICAL APPLICATIONS
Asset allocation and portfolio construction represent primary use cases for this analytical framework. When comparing multiple assets such as Bitcoin, gold, and the S&P 500, traders can examine Risk Efficiency Scores to identify instruments offering superior risk-adjusted performance. The 95% VaR provides worst-case scenario comparisons, while volatility-adjusted drawdowns enable fair comparison despite varying volatility profiles.
The practical decision framework suggests that assets with Risk Efficiency Scores above 70 may be suitable for aggressive portfolio allocations, scores between 40 and 70 indicate moderate allocation potential, and scores below 40 suggest defensive positioning or avoidance. These thresholds should be adjusted based on individual risk tolerance and market conditions.
Risk management and position sizing applications utilize the current percentile rank to guide allocation decisions. When the current drawdown ranks above the 75th percentile of historical data, indicating that current conditions are better than 75% of historical periods, position increases may be warranted. Conversely, when percentile rankings fall below the 25th percentile, indicating elevated risk conditions, position reductions become advisable.
Institutional portfolio monitoring applications include hedge fund risk dashboard implementations where multiple strategies can be monitored simultaneously. Sharpe ratio tracking identifies deteriorating risk-adjusted performance across strategies, VaR monitoring ensures portfolios remain within established risk limits, and drawdown duration tracking provides valuable information for investor reporting requirements.
Market timing applications combine the statistical analysis with trend identification techniques. Strong buy signals may emerge when risk levels register as "Low" in conjunction with established uptrends, while extreme risk levels combined with downtrends may indicate exit or hedging opportunities. Z-scores exceeding 3.0 often signal statistically oversold conditions that may precede trend reversals.
STATISTICAL SIGNIFICANCE AND VALIDATION
The indicator provides 95% confidence intervals around current drawdown levels using the standard formula CI = μ ± 1.96σ. This statistical framework enables users to assess whether current conditions fall within normal market variation or represent statistically significant departures from historical patterns.
Risk level classification employs a dynamic assessment system based on percentile ranking within the historical distribution. Low risk designation applies when current drawdowns perform better than 50% of historical data, moderate risk encompasses the 25th to 50th percentile range, high risk covers the 10th to 25th percentile range, and extreme risk applies to the worst 10% of historical drawdowns.
Sample size considerations play a crucial role in statistical reliability. For daily data, the system requires a minimum of 252 trading days (approximately one year) but performs better with 500 or more observations. Weekly data analysis benefits from at least 104 weeks (two years) of history, while monthly data requires a minimum of 60 months (five years) for reliable statistical inference.
IMPLEMENTATION BEST PRACTICES
Parameter optimization should consider the specific characteristics of different asset classes. Equity analysis typically benefits from 500-day lookback periods with 21-day smoothing, while cryptocurrency analysis may employ 365-day lookback periods with 14-day smoothing to account for higher volatility patterns. Fixed income analysis often requires longer lookback periods of 756 days with 34-day smoothing to capture the lower volatility environment.
Multi-timeframe analysis provides hierarchical risk assessment capabilities. Daily timeframe analysis supports tactical risk management decisions, weekly analysis informs strategic positioning choices, and monthly analysis guides long-term allocation decisions. This hierarchical approach ensures that risk assessment occurs at appropriate temporal scales for different investment objectives.
Integration with complementary indicators enhances the analytical framework. Trend indicators such as RSI and moving averages provide directional bias context, volume analysis helps confirm the severity of drawdown conditions, and volatility measures like VIX or ATR assist in market regime identification.
ALERT SYSTEM AND AUTOMATION
The automated alert system monitors five distinct categories of risk events. Risk level changes trigger notifications when drawdowns move between risk categories, enabling proactive risk management responses. Statistical significance alerts activate when Z-scores exceed established threshold levels of 2.5 or 3.0 standard deviations.
New maximum drawdown alerts notify users when historical maximum levels are exceeded, indicating entry into uncharted risk territory. Poor risk efficiency alerts trigger when the composite risk efficiency score falls below 30, suggesting deteriorating risk-adjusted performance. Sharpe ratio decline alerts activate when risk-adjusted performance turns negative, indicating that returns no longer compensate for the risk undertaken.
TRADING STRATEGIES
Conservative risk parity strategies can be implemented by monitoring Risk Efficiency Scores across a diversified asset portfolio. Monthly rebalancing maintains equal risk contribution from each asset, with allocation reductions triggered when risk levels reach "High" status and complete exits executed when "Extreme" risk levels emerge. This approach typically results in lower overall portfolio volatility, improved risk-adjusted returns, and reduced maximum drawdown periods.
Tactical asset rotation strategies compare Risk Efficiency Scores across different asset classes to guide allocation decisions. Assets with scores exceeding 60 receive overweight allocations, while assets scoring below 40 receive underweight positions. Percentile rankings provide timing guidance for allocation adjustments, creating a systematic approach to asset allocation that responds to changing risk-return profiles.
Market timing strategies with statistical edges can be constructed by entering positions when Z-scores fall below -2.5, indicating statistically oversold conditions, and scaling out when Z-scores exceed 2.5, suggesting overbought conditions. The 95% VaR serves as a stop-loss reference point, while trend confirmation indicators provide additional validation for position entry and exit decisions.
LIMITATIONS AND CONSIDERATIONS
Several statistical limitations affect the interpretation and application of these risk measures. Historical bias represents a fundamental challenge, as past drawdown patterns may not accurately predict future risk characteristics, particularly during structural market changes or regime shifts. Sample dependence means that results can be sensitive to the selected lookback period, with shorter periods providing more responsive but potentially less stable estimates.
Market regime changes can significantly alter the statistical parameters underlying the analysis. During periods of structural market evolution, historical distributions may provide poor guidance for future expectations. Additionally, many financial assets exhibit return distributions with fat tails that deviate from normal distribution assumptions, potentially leading to underestimation of extreme event probabilities.
Practical limitations include execution risk, where theoretical signals may not translate directly into actual trading results due to factors such as slippage, timing delays, and market impact. Liquidity constraints mean that risk metrics assume perfect liquidity, which may not hold during stressed market conditions when risk management becomes most critical.
Transaction costs are not incorporated into risk-adjusted return calculations, potentially overstating the attractiveness of strategies that require frequent trading. Behavioral factors represent another limitation, as human psychology may override statistical signals, particularly during periods of extreme market stress when disciplined risk management becomes most challenging.
TECHNICAL IMPLEMENTATION
Performance optimization ensures reliable operation across different market conditions and timeframes. All technical analysis functions are extracted from conditional statements to maintain Pine Script compliance and ensure consistent execution. Memory efficiency is achieved through optimized variable scoping and array usage, while computational speed benefits from vectorized calculations where possible.
Data quality requirements include clean price data without gaps or errors that could distort distribution analysis. Sufficient historical data is essential, with a minimum of 100 bars required and 500 or more preferred for reliable statistical inference. Time alignment across related assets ensures meaningful comparison when conducting multi-asset analysis.
The configuration parameters are organized into logical groups to enhance usability. Core settings include the Distribution Analysis Period (100-2000 bars), Drawdown Smoothing Period (1-50 bars), and Price Source selection. Advanced metrics settings control risk-free rate sourcing, either from live market data or fixed rate specification, along with toggles for various risk-adjusted metric calculations.
Display options provide flexibility in visual presentation, including color theme selection from eight available schemes, automatic dark mode optimization, and control over table display, position lines, percentile bands, and standard deviation overlays. These options ensure that the indicator can be adapted to different analytical workflows and visual preferences.
CONCLUSION
The Drawdown Distribution Analysis indicator provides risk management tools for traders seeking to understand their current position within historical risk patterns. By combining established statistical methodology with practical usability features, the tool enables evidence-based risk assessment and portfolio optimization decisions.
The implementation draws upon established academic research while providing practical features that address real-world trading requirements. Dynamic risk-free rate integration ensures accurate risk-adjusted performance calculations, while multiple color schemes accommodate different analytical preferences and use cases.
Academic compliance is maintained through transparent methodology and acknowledgment of limitations. The tool implements peer-reviewed statistical techniques while clearly communicating the constraints and assumptions underlying the analysis. This approach ensures that users can make informed decisions about the appropriate application of the risk assessment framework within their broader trading and investment processes.
BIBLIOGRAPHY
Artzner, P., Delbaen, F., Eber, J.M. and Heath, D. (1999) 'Coherent Measures of Risk', Mathematical Finance, 9(3), pp. 203-228.
Chekhlov, A., Uryasev, S. and Zabarankin, M. (2005) 'Drawdown Measure in Portfolio Optimization', International Journal of Theoretical and Applied Finance, 8(1), pp. 13-58.
Goldberg, L.R. and Mahmoud, O. (2017) 'Drawdown: From Practice to Theory and Back Again', Journal of Risk Management in Financial Institutions, 10(2), pp. 140-152.
Jorion, P. (2007) Value at Risk: The New Benchmark for Managing Financial Risk. 3rd edn. New York: McGraw-Hill.
Markowitz, H. (1952) 'Portfolio Selection', Journal of Finance, 7(1), pp. 77-91.
Sharpe, W.F. (1966) 'Mutual Fund Performance', Journal of Business, 39(1), pp. 119-138.
Sortino, F.A. and Price, L.N. (1994) 'Performance Measurement in a Downside Risk Framework', Journal of Investing, 3(3), pp. 59-64.
Young, T.W. (1991) 'Calmar Ratio: A Smoother Tool', Futures, 20(1), pp. 40-42.

Smart Order Blocks [Pro Version]Here’s a **clear, detailed "How It Works" explanation** for this indicator:
---
## ✅ **Smart Order Blocks \ – How It Works**
### **Purpose**
This indicator detects **Order Blocks (OBs)** based on **pivot highs and lows**, and automatically marks **Bullish** and **Bearish OB zones** on the chart with optional extensions and alerts. It is designed to help traders identify **institutional price levels** where liquidity is often engineered for future price moves.
---
### **Customization Options**
✔ **Source** → Choose between Wicks or Bodies for OB calculation.
✔ **Pivot Settings** → Adjust sensitivity for detecting pivots.
✔ **Extend OBs** → Keep zones visible until tapped, or fix a specific width.
✔ **Show Labels** → Displays OB type and strength on chart.
✔ **Colors** → Configure Bullish, Bearish, and Invalid OB colors.
---
### **Practical Usage**
* **Entry Strategy**:
* Wait for price to **revisit a Bullish OB** in an uptrend → Long entry.
* Wait for price to **revisit a Bearish OB** in a downtrend → Short entry.
* Combine with:
* **Market Structure (HH/HL or LH/LL)**.
* **Confirmation signals** (e.g., candlestick pattern, break of structure).
* **Risk Management** → Stop loss outside OB zone.
---
### ✅ **Summary in One Sentence**
The indicator automatically identifies **institutional OB zones**, shows their strength, extends them until mitigated, and alerts you when price interacts with these key liquidity levels, helping you trade like Smart Money.
---
