Theil-Sen Line Filter [BackQuant]Theil-Sen Line Filter
A robust, median-slope baseline that tracks price while resisting outliers. Designed for the chart pane as a clean, adaptive reference line with optional candle coloring and slope-flip alerts.
What this is
A trend filter that estimates the underlying slope of price using a Theil-Sen style median of past slopes, then advances a baseline by a controlled fraction of that slope each bar. The result is a smooth line that reacts to real directional change while staying calm through noise, gaps, and single-bar shocks.
Why Theil-Sen
Classical moving averages are sensitive to outliers and shape changes. Ordinary least squares is sensitive to large residuals. The Theil-Sen idea replaces a single fragile estimate with the median of many simple slopes, which is statistically robust and less influenced by a few extreme bars. That makes the baseline steadier in choppy conditions and cleaner around regime turns.
What it plots
Filtered baseline that advances by a fraction of the robust slope each bar.
Optional candle coloring by baseline slope sign for quick trend read.
Alerts when the baseline slope turns up or down.
How it behaves (high level)
Looks back over a fixed window and forms many “current vs past” bar-to-bar slopes.
Takes the median of those slopes to get a robust estimate for the bar.
Optionally caps the magnitude of that per-bar slope so a single volatile bar cannot yank the line.
Moves the baseline forward by a user-controlled fraction of the estimated slope. Lower fractions are smoother. Higher fractions are more responsive.
Inputs and what they do
Price Source — the series the filter tracks. Typical is close; HL2 or HLC3 can be smoother.
Window Length — how many bars to consider for slopes. Larger windows are steadier and slower. Smaller windows are quicker and noisier.
Response — fraction of the estimated slope applied each bar. 1.00 follows the robust slope closely; values below 1.00 dampen moves.
Slope Cap Mode — optional guardrail on each bar’s slope:
None — no cap.
ATR — cap scales with recent true range.
Percent — cap scales with price level.
Points — fixed absolute cap in price points.
ATR Length / Mult, Cap Percent, Cap Points — tune the chosen cap mode’s size.
UI Settings — show or hide the line, paint candles by slope, choose long and short colors.
How to read it
Up-slope baseline and green candles indicate a rising robust trend. Pullbacks that do not flip the slope often resolve in trend direction.
Down-slope baseline and red candles indicate a falling robust trend. Bounces against the slope are lower-probability until proven otherwise.
Flat or frequent flips suggest a range. Increase window length or decrease response if you want fewer whipsaws in sideways markets.
Use cases
Bias filter — only take longs when slope is up, shorts when slope is down. It is a simple way to gate faster setups.
Stop or trail reference — use the line as a trailing guide. If price closes beyond the line and the slope flips, consider reducing exposure.
Regime detector — widen the window on higher timeframes to define major up vs down regimes for asset rotation or risk toggles.
Noise control — enable a cap mode in very volatile symbols to retain the line’s continuity through event bars.
Tuning guidance
Quick swing trading — shorter window, higher response, optionally add a percent cap to keep it stable on large moves.
Position trading — longer window, moderate response. ATR cap tends to scale well across cycles.
Low-liquidity or gappy charts — prefer longer window and a points or ATR cap. That reduces jumpiness around discontinuities.
Alerts included
Theil-Sen Up Slope — baseline’s one-bar change crosses above zero.
Theil-Sen Down Slope — baseline’s one-bar change crosses below zero.
Strengths
Robust to outliers through median-based slope estimation.
Continuously advances with price rather than re-anchoring, which reduces lag at turns.
User-selectable slope caps to tame shock bars without over-smoothing everything.
Minimal visuals with optional candle painting for fast regime recognition.
Notes
This is a filter, not a trading system. It does not account for execution, spreads, or gaps. Pair it with entry logic, risk management, and higher-timeframe context if you plan to use it for decisions.
在腳本中搜尋"liquidity"

Ark FCI OscillatorFinancial Conditions Index Oscillator
This indicator tracks week-over-week changes in the National Financial Conditions Index (NFCI), providing a dynamic view of evolving financial conditions in the United States.
Overview
The National Financial Conditions Index (NFCI) is a comprehensive weekly composite index published by the Federal Reserve Bank of Chicago. It measures financial conditions across U.S. money markets, debt and equity markets, and the traditional and shadow banking systems.
Interpretation
Positive values indicate improving financial conditions
Negative values signal deteriorating financial conditions
Risk assets demonstrate particular sensitivity to changes in financial conditions, making this oscillator valuable for market timing and risk assessment.
Alternative Data Source
Users can modify the source to FRED:NFCIRISK to focus specifically on risk dynamics. The NFCIRISK subindex isolates volatility and funding risk measures within the financial sector, capturing market volatility indicators and liquidity shortage probabilities while excluding broader credit and leverage conditions.

% of Average Volume% of Average Volume (RVOL)
What it is
This indicator measures cumulative volume during pre market and separately during the first 10 minutes of trading and compares it to the average 30 day volume. This matters as a high ratio of volume within the premarket and then during the first 10 minutes of trading can correlate to a stock that has a higher probability of trending in that direction throughout the day.
What it’s meant to do
Identify abnormally high or low participation early in the day.
Normalize volume by time of session, so 9:40 volume is compared to past 9:40 volume—not to the full-day total.
Provide consistent RVOL across 1–5–15–60 minute charts (the same market state yields similar readings).
Handle pre-market cleanly (optional) without inflating RVOL.
How it works (plain English)
Cumulative Intraday Volume: Adds up all bars from the session (or pre-market, if enabled) up to “now.”
Time-Matched Baseline: For each prior day in your lookback, it accumulates only up to the same intraday minute and averages those values.
RVOL %: RVOL = (Today cumulative / Average cumulative at same time) × 100.
This “like-for-like” approach prevents the classic mistakes that overstate RVOL in pre-market or make it drift with timeframe changes.
Works best on
Intraday charts: 1, 2, 3, 4, 5, 10, 15, 30, 45, 60 min
Regular & extended hours: NYSE/Nasdaq equities, futures, ETFs
Daily/weekly views are supported for reference, but the edge comes from intraday time-matched analysis.
Tip: For thin names or very early pre-market, expect more variability—lower liquidity increases noise.
Customization (Inputs → Settings)
Lookback Sessions (e.g., 20): How many prior trading days to build the average.
Include Pre-Market (on/off): If on, RVOL accumulates from pre-market start and compares to historical pre-market at the same time; if off, it begins at the regular session open only.
Session Timezone / Exchange Hours: Choose the session definition that matches your market (e.g., NYSE) so “time-matched” means the same thing every day.
Cutoff Minute (Optional): Fix a reference minute (e.g., 6:40 a.m. PT / 9:40 a.m. ET) to evaluate RVOL at a standard check-in time.
Smoothing (Optional): Apply a short moving average to the RVOL line to reduce jitter.
Thresholds & Colors: Set levels (e.g., 150%, 300%) to color the plot/labels and trigger alerts.
Show Labels/Debug: Toggle on-chart labels (current RVOL%, baseline vols) for quick audits.
On-chart visuals & alerts
RVOL% Line/Histogram: Color-coded by thresholds (e.g., >300% “exceptional”, >150% “elevated”).
Session Markers: Optional vertical lines for pre-market/regular open.
Alerts:
RVOL Crosses Above X% (e.g., 150%, 300%)
RVOL Crosses Below X%
RVOL Rising/Falling (slope-based, optional)
Good defaults to start
Lookback: 20 sessions
Pre-market: Off for large caps, On for momentum screens
Thresholds: 150% (notable), 300% (exceptional)
Smoothing: 0–3 bars (or off for fastest response)
Notes & best practices
Timeframe consistency: Because calculations are time-matched, RVOL should remain directionally consistent across intraday timeframes. If you see divergences, confirm your session hours & timezone match your instrument’s exchange.
Holiday/half days: These are included in history; you can shorten lookback or exclude such sessions if your workflow prefers.
Low-float names: Consider a slightly longer lookback to reduce outlier effects.
TL;DR
A time-matched RVOL that treats pre-market correctly, stays stable across intraday timeframes, and is fully customizable for your exchange hours, thresholds, and alerts—so you can spot real participation when it matters.

Supertrend [TradingConToto]Supertrend — ADX/DI + EMA Gap + Breakout (with Mobile UI)
What makes it original
Supertrend combines trend strength (ADX/DI), multi-timeframe bias (EMA63 and EMA 200D equivalent), a structural filter based on the distance between EMA2400 and EMA4800 expressed in ATR units, and a momentum confirmation through a previous high breakout.
This is not a random mashup — it’s a sequence of filters designed to reduce trades in ranging markets and prioritize mature trends:
Direction: +DI > -DI (trend led by buyers).
Strength: ADX > mean(ADX) (avoids weak, choppy phases).
Short-term bias: Close > EMA63.
Long-term bias: Close > EMA4800 ≈ EMA200 daily on H1.
Momentum: Close > High (immediate breakout).
Structure: (EMA2400 − EMA4800) > k·ATR (ensures separation in ATR units, filters out flat phases).
Entries & exits
Entry: when all six conditions are met and no open position exists.
Exit: if +DI < -DI or Close < EMA63.
Visuals: EMA63 is painted green while in position and red otherwise, with a supertrend-style band; “BUY” labels appear below the green band and “SELL” labels above the red band.
UI: includes a compact table (mobile-friendly) showing the state of each condition.
Default parameters used in this publication
Initial capital: 10,000
Position size: 10% of equity (≤10% per trade is considered sustainable).
Commission: 0.01% per side (adjust to your broker/market).
Slippage: 1 tick
Pyramiding: 0 (only one position at a time)
Adjust commission/slippage to match your market. For US equities, commissions are often per share; for spot crypto, 0.10–0.20% total is common. I publish with 0.01% per side as a conservative example to avoid overestimating results.
Recommended backtest dataset
Timeframe: H1
Multi-cycle window (e.g. 2015–today)
Symbols with high liquidity (e.g. NASDAQ-100 large caps, or BTC/ETH spot) to generate 100+ trades. Avoid cherry-picked short windows.
Why each filter matters
+DI > -DI + ADX > mean: reduce counter-trend trades and weak signals.
Close > EMA63 + Close > EMA4800: enforce trend alignment in short and long horizons.
Breakout High : requires immediate momentum, avoids early entries.
EMA gap in ATR units: blocks flat or compressed structures where EMA200D aligns with price.
Limitations
The breakout filter may skip healthy pullbacks; the design prioritizes continuation over perfect entry price.
No fixed trailing stop/TP; exits depend on trend degradation via DI/EMA63.
Results vary with real costs (commissions, slippage, funding). Adjust defaults to your broker.
How to use
Apply it on a clean chart (no other indicators when publishing).
Keep in mind the default parameters above; if you change them, mention it in your notes and use the same values in the Strategy Tester.
Ensure your dataset produces 100+ trades for statistical validity.

Setup 9/13 Lite — Exhaustion & Reference LevelsWhat it is
A clean, lightweight tool that implements the classic 1–9 setup progression, to-13 exhaustion signal, and bar-#1 reference levels. Built for clarity with minimal chart clutter.
How it works
Setup (1–9):
• Buy side counts bars where Close < Close .
• Sell side counts bars where Close > Close .
• Counter resets on an opposite condition.
• On completion, a triangle marker appears (Buy 9 below bar, Sell 9 above bar).
Reference levels (from bar #1 of a completed setup):
• After a completed Buy setup, draw a horizontal line from the Low of bar #1.
• After a completed Sell setup, draw a horizontal line from the High of bar #1.
• Lines extend to the right and update on new completed setups.
Exhaustion (…to 13):
• Starts on the bar after a completed 9.
• Buy side: increments when Close ≤ Low (or < if “Strict” is on).
• Sell side: increments when Close ≥ High (or > if “Strict” is on).
• Stops when 13 is reached (single circle marker) or when a new opposite 9 appears.
Strict comparisons:
Toggle between strict (<, >) and non-strict (≤, ≥) rules for both parts.
Header panel:
A compact top-right table shows live Setup and Exhaustion counts.
Inputs
Show Setup (1–9)
Show Exhaustion (to 13)
Show reference levels (from bar #1)
Strict comparisons (< /> instead of ≤ / ≥)
Paint bars during Setup
Paint bars during Exhaustion
(Exhaustion tint overrides Setup tint when both are enabled.)
Visual guide
Green triangle below bar = Buy Setup 9
Red triangle above bar = Sell Setup 9
Green circle below bar = Buy Exhaustion 13
Red circle above bar = Sell Exhaustion 13
Green/Red horizontal line = Reference level from bar #1 of the last completed setup
Alerts
Buy Setup 9 completed
Sell Setup 9 completed
Buy Exhaustion reached 13
Sell Exhaustion reached 13
Tip: for fewer false pings, set alerts to “Once per bar close.”
Notes
Works on any symbol/timeframe; higher liquidity improves readings. These signals indicate potential exhaustion/context, not a standalone trading system—combine with trend filters, S/R, and risk management.
Disclaimer
Educational use only. Not financial advice.

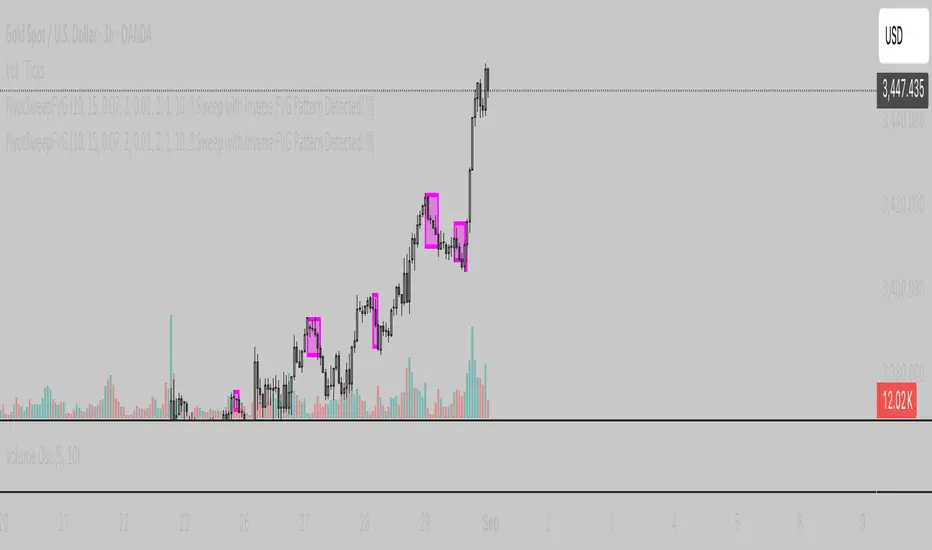
Pivot and Wick Boxes with Break Signals v2█ OVERVIEW
The "Pivot and Wick Boxes with Break Signals v2" is an advanced Pine Script® technical analysis tool that identifies pivot points (highs and lows) on the chart and draws customizable boxes based on the wicks of pivot candles. It is ideal for traders using price action strategies, helping to identify key support and resistance levels and potential breakout trading opportunities. With flexible settings, a volume filter, and label grouping, the indicator ensures clarity and precision on the chart.
█ CONCEPTS
The indicator modifies how zones are drawn, displaying boxes on the latest candle rather than extending from the zones based on pivot candle wicks. This approach prevents visual clutter on the chart, allowing simultaneous use of other indicators without sacrificing clarity.
Why are wicks important?Wicks of pivot candles indicate significant market reactions in key areas. Depending on the context, they may signal rejection, testing, or absorption of support or resistance levels. Long wicks often appear where large players are active, and the marked zones are frequently retested. The indicator enables quick identification and observation of their impact on future price movements.
█ FEATURES
Pivot Detection: Identifies pivot points (highs and lows) based on a user-defined lookback period (Pivot Length), with options to display boxes for high and low pivot candle wicks separately.
Customizable Boxes: Draws boxes based on pivot candle wicks with adjustable border colors, background gradients, border styles (solid, dashed, dotted), and border widths.
Breakout Signals: Generates buy (green upward triangle) and sell (red downward triangle) signals when the price breaks through a pivot and the candle closes on the opposite side, indicating potential trend continuation. If the price approaches a pivot zone but fails to break it, this may suggest a potential trend reversal or the end of a correction.
Volume Filter: Optional volume-based signal filter that requires breakouts to have a volume exceeding a user-defined multiplier of the average volume over a specified period. Note: the volume filter will not work on markets where volume data is unavailable.
Label Grouping: Automatically groups overlapping pivot labels to avoid chart clutter, displaying only key price levels.
█ HOW TO USE
Add to Chart: Apply the indicator to your TradingView chart via the Pine Editor or Indicators menu.
Configure Settings:
Pivot Settings: Adjust Pivot Length to change the sensitivity of pivot detection—the value represents the number of candles, which equals the delay in displaying the pivot. Larger values generate fewer pivots, but they are generally more significant. Set Max High Pivot Boxes and Max Low Pivot Boxes to control the number of displayed boxes.
Signal Settings: Enable Use Volume Filter for Signals to require higher volume for breakouts, and adjust Average Volume Multiplier and Average Volume Period. A volume multiplier of 1 means the filter allows pivots with a volume equal to or greater than the average volume over the specified period.
Box Styling: Configure border colors, background gradients, line thickness, and border styles for high and low pivot boxes.
Interpreting Signals:
Buy Signal: A green triangle below the bar indicates a breakout above a high pivot box, suggesting potential continuation of an uptrend.
Sell Signal: A red triangle above the bar indicates a breakout below a low pivot box, suggesting potential continuation of a downtrend.
Non-Breakout Zones: If the price approaches a pivot zone but fails to break it, it may indicate a potential trend reversal or the end of a correction (e.g., price rejection at a resistance level in a downtrend or a support level in an uptrend).
Overlapping Zones: If pivot zones overlap, it indicates the level has been tested multiple times, suggesting its significance in the market.
Use signals in conjunction with other technical analysis tools for confirmation.
Monitoring Levels: Use labeled pivot levels as potential support and resistance zones for trade planning.
█ APPLICATIONS
Price Action Trading: Use pivot levels as support and resistance zones. For example, in an uptrend, you can look for buying opportunities near low pivot zones (support), where price often bounces after testing the wick of a pivot candle. Combining with other indicators, such as Fibonacci levels, enhances the significance of pivot zones—if they align with Fibonacci levels and are accompanied by high volume, the zone is considered stronger.
Breakout Strategies: Trade based on breakout signals from key pivot zones. A buy signal after a breakout from a high pivot with confirmed volume may indicate continued upward movement. Using the indicator with other tools, such as moving averages or RSI, can help confirm the strength of the breakout.
Practical Approach:
The more frequently a zone is tested in a short period, the higher the risk of a breakout, as supply or demand may be exhausted.
The longer a zone holds without breaking, the more significant it becomes for the market, both psychologically and technically.
As the saying goes: “A zone is strong until it breaks—when it does, a strong move often follows.”
How to observe?
Strong bounces from a zone indicate that demand or supply remains active.
Weaker bounces or price lingering near the level may suggest the market is preparing for a breakout.
█ NOTES
Test the indicator across different timeframes and markets (stocks, forex, crypto) to optimize settings for your trading style.
The volume filter will not work on markets where volume data is unavailable. In such cases, disable the volume filter in the settings.
For best results, use on high-liquidity markets when the volume filter is enabled.

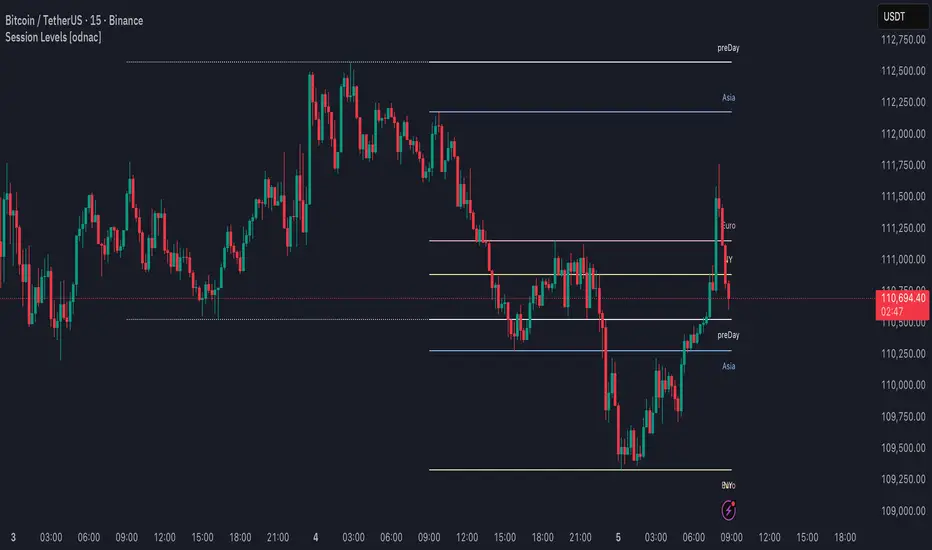
Session Levels [odnac]This indicator plots the high and low levels of the three main trading sessions—Asia, Europe, and New York—along with the previous day’s high, low, and open. Each session’s time range can be customized using a UTC offset, and the indicator automatically tracks session highs and lows as price develops.
Functions:
Plots session highs and lows for Asia, Europe, and New York.
Shows previous day’s high, low, and open as reference levels.
Session times are fully configurable with hour and minute precision, including UTC offset adjustment.
Each session level is marked with both a line and a label for clarity.
Color customization for each session and previous day levels.
Designed for intraday timeframes (1–60 minutes).
Filter Condition:
When the filter option is enabled, the indicator adjusts how levels are drawn:
A session high above the current close is displayed as a solid line with a visible label.
Once price closes above that high, the line becomes dotted and dimmed, and the label also becomes less emphasized.
Similarly, a session low below the current close is displayed as a solid line and label.
If price closes below that low, the line switches to dotted and dimmed, with the label adjusted accordingly.
This behavior highlights only the most relevant levels for the current market position while still keeping breached levels visible in a subdued style, making it easier to spot active breakout or liquidity zones.
EMA20 Cross Strategy with countertrades and signalsEMA20 Cross Strategy Documentation
Overview
The EMA20 Cross Strategy with Counter-Trades and Instant Signals is a Pine Script (version 6) trading strategy designed for the TradingView platform. It implements an Exponential Moving Average (EMA) crossover system to generate buy and sell signals, with optional trend filtering, session-based trading, instant signal processing, and visual/statistical feedback. The strategy supports counter-trades (closing opposing positions before entering new ones) and operates with a fixed trade size in EUR.
Features
EMA Crossover Mechanism:
Uses a short-term EMA (configurable length, default: 1) and a long-term EMA (default: 20) to detect crossovers.
A buy signal is generated when the short EMA crosses above the long EMA.
A sell signal is generated when the short EMA crosses below the long EMA.
Instant Signals:
If enabled (useInstantSignals), signals are based on the current price crossing the short EMA, rather than waiting for the candle close.
This allows faster trade execution but may increase sensitivity to price fluctuations.
Trend Filter:
Optionally filters trades based on the trend direction (useTrendFilter).
Long trades are allowed only when the short EMA (or price, for instant signals) is above the long EMA.
Short trades are allowed only when the short EMA (or price) is below the long EMA.
Session Filter:
Restricts trading to specific market hours (sessionStart, default: 09:00–17:00) if enabled (useSessionFilter).
Ensures trades occur only during active market sessions, reducing exposure to low-liquidity periods.
Customizable Timeframe:
The EMA calculations can use a higher timeframe (e.g., 5m, 15m, 1H, 4H, 1D, default: 1H) via request.security.
This allows the strategy to base signals on longer-term trends while operating on a shorter-term chart.
Trade Management:
Fixed trade size of €100,000 per trade (tradeAmount), with a maximum quantity cap (maxQty = 10,000) to prevent oversized trades.
Counter-trades: Closes short positions before entering a long position and vice versa.
Trades are executed with a minimum quantity of 1 to ensure valid orders.
Visualization:
EMA Lines: The short EMA is colored based on the last signal (green for buy, red for sell, gray for neutral), and the long EMA is orange.
Signal Markers: Displays buy/sell signals as arrows (triangles) above/below candles if enabled (showSignalShapes).
Background/Candle Coloring: Optionally colors the chart background or candles green (bullish) or red (bearish) based on the trend (useColoredBars).
Statistics Display:
If enabled (useStats), a label on the chart shows:
Total closed trades
Open trades
Win rate (%)
Number of winning/losing trades
Profit factor (gross profit / gross loss)
Net profit
Maximum drawdown
Configuration Inputs
EMA Short Length (emaLength): Length of the short-term EMA (default: 1).
Trend EMA Length (trendLength): Length of the long-term EMA (default: 20).
Enable Trend Filter (useTrendFilter): Toggles trend-based filtering (default: true).
Color Candles (useColoredBars): Colors candles instead of the background (default: true).
Enable Session Filter (useSessionFilter): Restricts trading to specified hours (default: false).
Trading Session (sessionStart): Defines trading hours (default: 09:00–17:00).
Show Statistics (useStats): Displays performance stats on the chart (default: true).
Show Signal Arrows (showSignalShapes): Displays buy/sell signals as arrows (default: true).
Use Instant Signals (useInstantSignals): Generates signals based on live price action (default: false).
EMA Timeframe (emaTimeframe): Timeframe for EMA calculations (options: 5m, 15m, 1H, 4H, 1D; default: 1H).
Strategy Logic
Signal Generation:
Standard Mode: Signals are based on EMA crossovers (short EMA crossing long EMA) at candle close.
Instant Mode: Signals are based on the current price crossing the short EMA, enabling faster reactions.
Trade Execution:
On a buy signal, closes any short position and opens a long position.
On a sell signal, closes any long position and opens a short position.
Position size is calculated as the minimum of €100,000 or available equity, divided by the current price, capped at 10,000 units.
Filters:
Trend Filter: Ensures trades align with the trend direction (if enabled).
Session Filter: Restricts trades to user-defined market hours (if enabled).
Visual Feedback
EMA Lines: Provide a clear view of the short and long EMAs, with the short EMA’s color reflecting the latest signal.
Signal Arrows: Large green triangles (buy) below candles or red triangles (sell) above candles for easy signal identification.
Chart Coloring: Highlights bullish (green) or bearish (red) trends via background or candle colors.
Statistics Label: Displays key performance metrics in a label above the chart for quick reference.
Usage Notes
Initial Capital: €100,000 (configurable via initial_capital).
Currency: EUR (set via currency).
Order Processing: Orders are processed at candle close (process_orders_on_close=true) unless instant signals are enabled.
Dynamic Requests: Allows dynamic timeframe adjustments for EMA calculations (dynamic_requests=true).
Platform: Designed for TradingView, compatible with any market supported by the platform (e.g., stocks, forex, crypto).
Example Use Case
Scenario: Trading on a 5-minute chart with a 1-hour EMA timeframe, trend filter enabled, and session filter set to 09:00–17:00.
Behavior: The strategy will:
Calculate EMAs on the 1-hour timeframe.
Generate buy signals when the short EMA crosses above the long EMA (and price is above the long EMA).
Generate sell signals when the short EMA crosses below the long EMA (and price is below the long EMA).
Execute trades only during 09:00–17:00.
Display green/red candles and performance stats on the chart.
Limitations
Instant Signals: May lead to more frequent signals, increasing the risk of false positives in volatile markets.
Fixed Trade Size: Does not adjust dynamically based on market conditions beyond equity and max quantity limits.
Session Filter: Simplified and may not account for complex session rules or holidays.
Statistics: Displayed on-chart, which may clutter the view in smaller charts.
Customization
Adjust emaLength and trendLength to suit different market conditions (e.g., shorter for scalping, longer for swing trading).
Toggle useInstantSignals for faster or more stable signal generation.
Modify sessionStart to align with specific market hours.
Disable useStats or showSignalShapes for a cleaner chart.
This strategy is versatile for both manual and automated trading, offering flexibility for various markets and trading styles while providing clear visual and statistical feedback.

RB — Rejection Blocks (Price Structure)This indicator detects and visualizes Rejection Blocks (RBs) using pure price action logic.
A bullish RB occurs when a down candle forms a lower low than both its neighbors. A bearish RB occurs when an up candle forms a higher high than both its neighbors.
Validated RBs are displayed as boxes, optional lines, or labels. Blocks are automatically removed when invalidated (price closes through them), keeping the chart uncluttered and focused.
How to use
• Apply on any timeframe, from intraday to higher timeframes.
• Watch how price reacts when revisiting RB zones.
• Treat these zones as contextual areas, not entry signals.
• Combine with your own trading methods for confirmation.
Originality
Unlike generic support/resistance tools, this indicator isolates a specific structural pattern (rejection blocks) and renders it visually on the chart. This selective focus allows traders to study structural reactions with more clarity and precision.
⚠️ Disclaimer: This is not a trading system or a signal provider. It is a visual analysis tool designed for structural and educational purposes.

Stacey Burke Signal Day LTE“Previously published as ‘Day Zero Fakeout Detector MTF’”
Stacey Burke Signal Day LTE
Automatic detection of Day Zero, Inside Days, and Outside Days for Stacey Burke’s intraday playbook
🔎 Stacey Burke’s Signal Days
This indicator highlights the key daily patterns that often lead to high-probability intraday setups in Stacey Burke’s methodology:
1️⃣ Day Zero
The reset days within a 3-day cycle (e.g. breakout → continuation → exhaustion/reversal).
Can mark the beginning of a new directional phase.
Trades back inside the prior range after a Peak Formation High (PFH) or Peak Formation Low (PFL).
Bias: Look for measured parabolic session moves. When combined with trend following indicators, these signal days can be very powerful.
2️⃣ Inside Day
A day where the entire range is contained within the prior day’s range.
Signals consolidation and energy build-up.
Often leads to explosive breakouts in the next session.
Bias: Trade breakouts of the inside day’s high/low or breakout reversal in the session at key timings in the direction of higher timeframe bias. When combined with trend following indicators, these signal days can be very powerful.
3️⃣ Outside Day (Engulfing Day)
`
A day where the range is larger than the prior day’s range, engulfing both high and low.
Marks trapped traders and fakeouts on both sides.
Often precedes strong continuations or sharp reversals from outside of the ranges.
Bias: Align trades with the true continuation move. When combined with trend following indicators, these signal days can be very powerful.
📌 How They Work Together
Day Zero → Signals the new cycle after PFH/PFL.
Inside Day → Signals compression → expect breakout setups.
Outside Day → Signals exhaustion/fakeouts → expect reversals or continuations.
Together, they give traders a clear daily roadmap for where liquidity sits and when to expect the highest-probability setups.
✅ Example in Practice
Market rallies for 3 days → PFH forms → Day Zero short bias.
Next day prints an Inside Day → watch for breakout continuation short, and breakout reversals.
Later, an Outside Day traps both longs and shorts → the following session offers a clean intraday reversal or continuation trade in line with the underlying MTF trend/bias.
⚙️ Features of This Indicator
Automatic detection of Day Zero, Inside Days, and Outside Days
Multi-Timeframe (MTF) support for cycle alignment
Visual markers for PFH/PFL and consolidation zones
Measured move projections for breakout targets
👉 Stacey Burke Signal Day LTE gives traders just a few of the most important signal days — Day Zero, Inside Day, and Outside Day — to structure their intraday trades around fake outs, breakouts, and reversals within the daily cycles of the week. (This is work in progress: Next up, FRD/FGD's, 3-day cycle detecting, 3DLs, 3DSs).

BTC/USD 3-Min Binary Prediction [v7.2 EN]BTC/USD 3-Minute Binary Prediction Indicator v7.2 - Complete Guide
Overview
This is an advanced technical analysis indicator designed for Bitcoin/USD binary options trading with 3-minute expiration times. The system aims for an 83% win rate by combining multiple analysis layers and pattern recognition.
How It Works
Core Prediction Logic
- Timeframe: Predicts whether BTC price will be ±$25 higher (HIGH) or lower (LOW) after 3 minutes
- Entry Signals: Generates HIGH/LOW signals when confidence exceeds threshold (default 75%)
- Verification: Automatically tracks and displays win/loss statistics in real-time
5-Layer Filter System
The indicator uses a sophisticated scoring system (0-100 points):
1. Trend Filter (25 points) - Analyzes EMA alignments and price momentum
2. Leading Indicators (25 points) - RSI and MACD divergence analysis
3. Volume Confirmation (20 points) - Detects unusual volume patterns
4. Support/Resistance (15 points) - Identifies key price levels
5. Momentum Alignment (15 points) - Measures acceleration and deceleration
Pattern Recognition
Automatically detects and visualizes:
- Double Tops/Bottoms - Reversal patterns
- Triangles - Ascending, descending, symmetrical
- Channels - Trending price channels
- Candlestick Patterns - Engulfing, hammer, hanging man
Multi-Timeframe Analysis
- Uses 1-minute and 5-minute data for confirmation
- Aligns multiple timeframes for higher probability trades
- Monitors trend consistency across timeframes
Key Features
Display Panels
1. Statistics Panel (Top Right)
- Overall win rate percentage
- Hourly performance (wins/losses)
- Daily performance
- Current system status
2. Analysis Panel (Left Side)
- Market trend analysis
- RSI status (overbought/oversold)
- Volume conditions
- Filter scores for each component
- Final HIGH/LOW/WAIT decision
Visual Signals
- Green Triangle (↑) = HIGH prediction
- Red Triangle (↓) = LOW prediction
- Yellow Background = Entry opportunity
- Blue Background = Waiting for result
Configuration Options
Basic Settings
- Range Width: Target price movement (default $50 = ±$25)
- Min Confidence: Minimum confidence to enter (default 75%)
- Max Daily Trades: Risk management limit (default 5)
Filters (Can be toggled on/off)
- Trend Filter
- Volume Confirmation
- Support/Resistance Filter
- Momentum Alignment
Display Options
- Show/hide signals, statistics, analysis
- Minimal Mode for cleaner charts
- EMA line visibility
Important Risk Warnings
Binary Options Trading Risks:
1. High Risk Product - Binary options are extremely risky and banned in many countries
2. Not Investment Advice - This tool is for educational/analytical purposes only
3. No Guaranteed Returns - Past performance doesn't predict future results
4. Capital at Risk - You can lose your entire investment in seconds
Technical Limitations:
- Requires stable internet connection
- Performance varies with market conditions
- High volatility can reduce accuracy
- Not suitable for news events or low liquidity periods
Best Practices
1. Paper Trade First - Test thoroughly on demo accounts
2. Risk Management - Never risk more than 1-2% per trade
3. Market Conditions - Works best in normal volatility conditions
4. Avoid Major Events - Don't trade during major news releases
5. Monitor Performance - Track your actual results vs displayed statistics
Setup Instructions
1. Add to TradingView chart (BTC/USD preferred)
2. Use 30-second or 1-minute chart timeframe
3. Adjust settings based on your risk tolerance
4. Monitor F-Score (should be >65 for entries)
5. Wait for clear HIGH/LOW signals with high confidence
Alert Configuration
The indicator provides three alert types:
- HIGH Signal alerts
- LOW Signal alerts
- General entry opportunity alerts
Legal Disclaimer
Binary options trading may not be legal in your jurisdiction. Many countries including the USA, Canada, and EU nations have restrictions or outright bans on binary options. Always check local regulations and consult with financial advisors before trading.
Remember: This is a technical analysis tool, not a money-printing machine. Successful trading requires discipline, risk management, and continuous learning. The displayed statistics are historical and don't guarantee future performance.

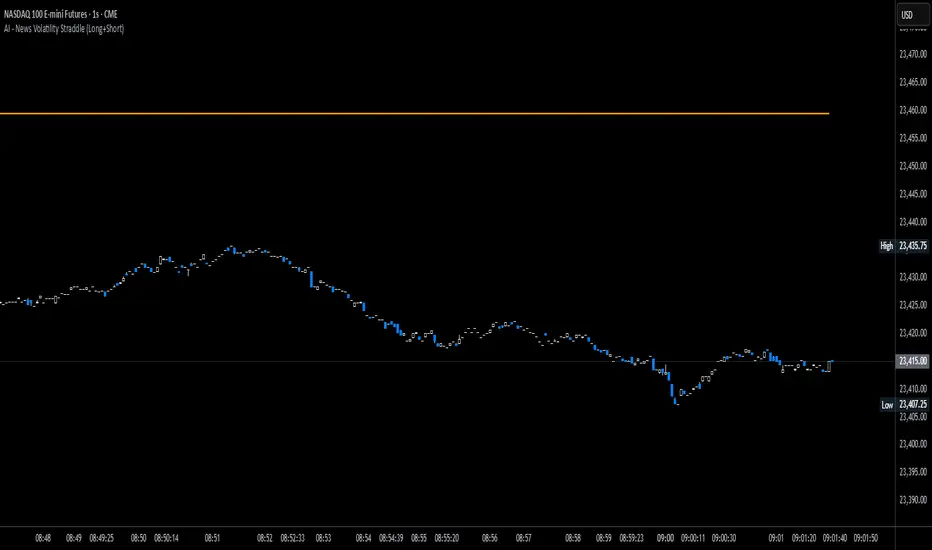
News Volatility Bracketing StrategyThis is a news-volatility bracketing strategy. Five seconds before a scheduled release, the strategy brackets price with a buy-stop above and a sell-stop below (OCO), then converts the untouched side into nothing while the filled side runs with a 1:1 TP/SL set the same distance from entry. Distances are configurable in USD or %, so it scales to the instrument and can run on 1-second data (or higher TF with bar-magnifier). The edge it’s trying to capture is the immediate, one-directional burst and liquidity vacuum that often follows market-moving news—entering on momentum rather than predicting direction. Primary risks are slippage/spread widening and whipsaws right after the print, which can trigger an entry then snap back to the stop.
Volume Profile + Pivot Levels [ChartPrime]⯁ OVERVIEW
Volume Profile + Pivot Levels combines a rolling volume profile with price pivots to surface the most meaningful levels in your selected lookback window. It builds a left-side profile from traded volume, highlights the session’s Point of Control (PoC) , and then filters pivot highs/lows so only those aligned with significant profile volume are promoted to chart levels. Each promoted level extends forward until price retests it—so your chart stays focused on levels that actually matter.
⯁ KEY FEATURES
Rolling Volume Profile (Period & Resolution)
Calculates a profile over the last Period bars (default 200). The profile is discretized into Volume Profile Resolution bins (default 50) between the highest high and lowest low inside the window. Each bin accumulates traded volume and is drawn as a smooth left-side polyline for compact, lightweight rendering.
HL = array.new()
// collect highs/lows over 'start' bars to define profile range
for i = 0 to start - 1
HL.push(high ), HL.push(low )
H = HL.max(), L = HL.min()
bin_size = (H - L) / bins
// accumulate per-bin volume
for i = 0 to bins - 1
for j = 0 to start - 1
if close >= (L + bin_sizei) - bin_size and close < (L + bin_size*(i+1)) + bin_size
Bins += volume
Delta-Aware Coloring
The script tracks up-minus-down volume across all period to compute a net Delta . The profile, PoC line, and PoC label adopt a teal tone when net positive, and maroon when net negative—an immediate read on buyer/seller dominance inside the window.
Point of Control (PoC) + Volume Label
Automatically marks the highest-volume bin as the PoC . A horizontal PoC line extends to the last bar, and a label shows the absolute volume at the PoC. Toggle visibility via PoC input.
Pivot Detection with Volume Filter
Identifies raw pivots using Length (default 10) on both sides of the bar. Each candidate pivot is then validated against the profile: only pivots that land within their bin and meet or exceed the Filter % threshold (percentage of PoC volume) are promoted to chart levels. This removes weak, low-participation pivots.
// pivot promotion when volume% >= pivotFilter
if abs(mid - p.value) <= bin_size and volPercent >= pivotFilter
// draw labeled pivot level
line.new(p.index - pivotLength, p.value, p.index + pivotLength, p.value, width = 2)
Forward-Extending, Self-Stopping Levels
Promoted pivot levels extend forward as dotted rays. As soon as price intersects a level (high/low straddles it), that level stops extending—so your chart doesn’t clutter with stale zones.
Concise Level Labels (Volume + %)
Each promoted pivot prints a compact label at the pivot bar with its bin’s absolute volume and percentage of PoC volume (ordering flips for highs vs. lows for quick read).
Lightweight Visuals
The volume profile is rendered as a smooth polyline rather than dozens of boxes, keeping charts responsive even at higher resolutions.
⯁ SETTINGS
Volume Profile → Period : Lookback window used to compute the profile (max 500).
Volume Profile → Resolution : Number of bins; higher = finer structure.
Volume Profile → PoC : Toggle PoC line and volume label.
Pivots → Display : Show/hide volume-validated pivot levels.
Pivots → Length : Pivot detection left/right bars.
Pivots → Filter % 0–100 : Minimum bin strength (as % of PoC) required to promote a pivot level.
⯁ USAGE
Read PoC direction/color for a quick net-flow bias within your window.
Prioritize promoted pivot levels —they’re backed by meaningful participation.
Watch for first retests of promoted levels; the line will stop extending once tested.
Adjust Period / Resolution to match your timeframe (scalps → higher resolution, shorter period; swings → lower resolution, longer period).
Tighten or loosen Filter % to control how selective the level promotion is.
⯁ WHY IT’S UNIQUE
Instead of plotting every pivot or every profile bar, this tool cross-checks pivots against the profile’s internal volume weighting . You only see levels where price structure and liquidity overlap—clean, data-driven levels that self-retire after interaction, so you can focus on what the market actually defends.

Maiko Range Scalper (Sideways BB + RSI) – v4 cleanPurpose
It’s a range scalping strategy for crypto. It tries to take small, repeatable trades inside a sideways market: buy near the bottom of the range, sell near the middle/top (and the reverse for shorts).
Core idea (two timeframes)
Define the trading range on a higher timeframe (HTF)
You choose the HTF (e.g., 15m or 1h).
The script finds the highest high and lowest low over a lookback window (e.g., last 96 HTF candles) → these become HTF Resistance and HTF Support.
It also calculates the midline (average of support/resistance).
Trade signals on your lower timeframe (LTF)
You run the strategy on a fast chart (e.g., 1m or 5m).
Entries are only allowed inside the HTF range.
Entry logic (mean reversion)
Indicators on the LTF:
Bollinger Bands (length & std dev configurable).
RSI (length & thresholds configurable).
Optional VWAP proximity filter (price must be within X% of VWAP).
Long setup:
Price touches/under-cuts the lower Bollinger band AND RSI ≤ threshold (default 30) AND price is inside the HTF range (and passes VWAP filter if enabled).
Short setup:
Price touches/exceeds the upper Bollinger band AND RSI ≥ threshold (default 70) AND price is inside the HTF range (and passes VWAP filter if enabled).
Exits and risk
Stop-loss: placed just outside the HTF range with a configurable buffer %:
Long SL = HTF Support × (1 − buffer).
Short SL = HTF Resistance × (1 + buffer).
Take-profit (selectable):
Mid band (the Bollinger basis) → conservative, faster exits.
Opposite band / HTF boundary → more aggressive, higher RR but more give-backs.
Position sizing
A simple cap: maximum position size = percent of account equity (e.g., 20%).
The script calculates quantity from that cap and current price.
Plots you’ll see on the chart
HTF Resistance (red) and HTF Support (green) via plot().
HTF Midline (gray dashed) drawn with a line.new() object (because plot() cannot do dashed).
Bollinger basis/upper/lower on the LTF.
Optional VWAP line (only shown if you enable the filter).
Signal markers (green triangle up for Long setups, red triangle down for Short setups).
Alerts
Two alertconditions:
“Long Setup” – when a long entry condition appears.
“Short Setup” – when a short entry condition appears.
Create alerts from these to get notified in real time.
How to use it (quick start)
Add to a 1m or 5m chart of a liquid coin (BTC, ETH, SOL).
Set HTF timeframe (start with 1h) and lookback (e.g., 96 = ~4 days on 1h).
Keep default Bollinger/RSI first; tune later.
Choose TP mode:
“Mid band” for quick scalps.
“Opposite band/Range” if the range is very clean and you want bigger targets.
Set SL buffer (0.15–0.30% is common; adjust for volatility).
Set Max position % to control size (e.g., 20%).
(Optional) Enable VWAP filter to skip stretched moves.
When it works best
Clearly sideways markets with visible support/resistance on the HTF.
High-liquidity pairs where spreads/fees are small relative to your scalp target.
Limitations & safety notes
True breakouts will invalidate mean-reversion logic—your SL outside the range is there to cut losses fast.
Fees can eat into small scalps—prefer limit orders, rebates, and liquid pairs.
Backtest results vary by exchange data; always forward-test on small size.
If you want, I can:
Add an ATR-based stop/target option.
Provide a study-only version (signals/alerts, no trading engine).
Pre-set risk to your €5,000 plan (e.g., ~0.5% max loss/trade) with calculated qty.

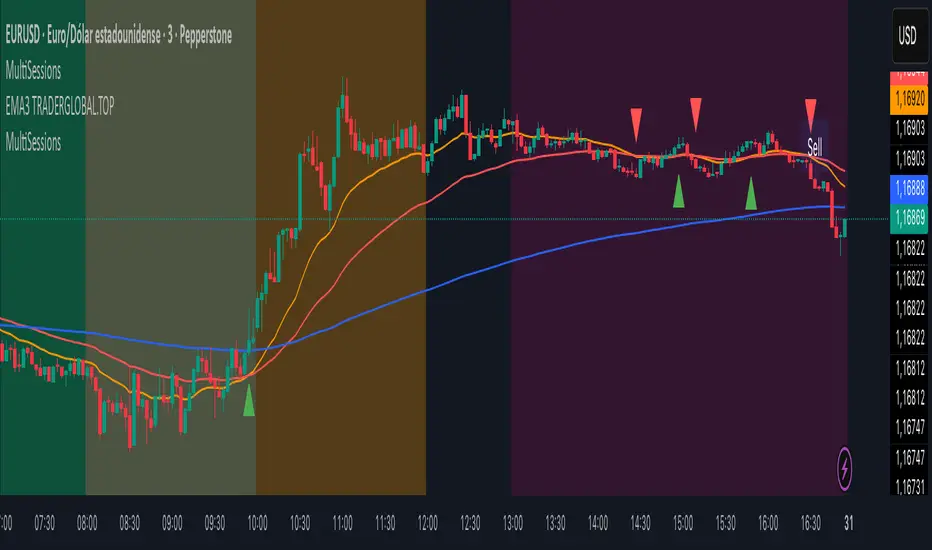
MultiSessions traderglobal.topEste indicador de sesiones está diseñado para traders intradía que desean visualizar con precisión la actividad y la volatilidad característica de cada mercado. Basado en Pine Script v5 y optimizado para la zona horaria “America/New_York”, divide el día en sub-sesiones configurables y resalta sus rangos de precio en tiempo real. En particular, incorpora tres bloques para New York (NY1, NY2, NY3), dos para Londres (LON1, LON2), dos para Tokio (TKO1, TKO2) y mantiene Sídney como sesión opcional. Cada bloque puede activarse o desactivarse de forma independiente y cuenta con su propio color ajustable, lo que permite construir mapas visuales claros para estrategias basadas en horario, solapamientos y micro-estructuras de mercado.
El panel de inputs incluye la opción “Activate High/Low View”. Cuando está activada, el indicador calcula de manera incremental el mínimo y máximo de cada sub-sesión y sombrea el área entre ambos con fill, proporcionando una referencia inmediata del rango intrasesión (útil para medir compresión/expansión y posibles rompimientos). Cuando está desactivada, emplea un simple bgcolor por bloque, ideal para traders que prefieren un gráfico más limpio y solo desean distinguir visualmente los tramos horarios.
La lógica central utiliza dos funciones auxiliares: is_session(sess), que detecta si la vela actual pertenece a un tramo horario concreto, e is_newbar(sess), que determina el inicio de una nueva barra de referencia según la resolución elegida (D, W o M). Gracias a esta combinación, en cada sub-sesión el indicador reinicia sus contadores de alto y bajo al comenzar el período y los actualiza vela a vela mientras el bloque siga activo. Este enfoque evita mezclas de datos entre sesiones y asegura que el rango que se muestra corresponda estrictamente al segmento horario configurado.
Los horarios por defecto están pensados para Forex y contemplan casos que cruzan medianoche (por ejemplo, Tokio 2 y Sídney). Pine Script admite rangos como 2200-0200; no obstante, si tu bróker o la zona horaria del gráfico generan un sombreado parcial, basta con dividir el tramo en dos: 2200-2359 y 0000-0200. Asimismo, cada input.session incluye el patrón :1234567 para habilitar los siete días; puedes restringir días según tu operativa.
En cuanto al uso práctico, el indicador facilita identificar: (1) la estructura del rango por sub-sesión (útil para estrategias de breakout/mean-reversion), (2) los solapamientos entre Londres y New York, donde suele concentrarse la liquidez, y (3) períodos de menor volatilidad (tramos tardíos de Asia o previos a noticias). El color independiente por bloque te permite codificar visualmente la importancia o tu plan de trading (por ejemplo, tonos más intensos en ventanas de alta probabilidad).
Finalmente, su diseño modular hace sencilla la personalización: puedes ajustar colores, activar/desactivar bloques, cambiar horarios y modificar la resolución de reseteo del rango. Como posible mejora, se pueden añadir alertas de ruptura de máximos/mínimos de sub-sesión o etiquetas con la altura del rango (pips) al cierre. Este indicador no sustituye el juicio del trader ni constituye recomendación financiera, pero ofrece una base visual robusta para integrar el factor tiempo en la toma de decisiones.
This sessions indicator is built for intraday traders who want a precise, time-aware view of market activity and typical volatility patterns across the day. Written in Pine Script v5 and optimized for the “America/New_York” timezone, it divides the trading day into configurable sub-sessions and highlights their price ranges in real time. Specifically, it provides three blocks for New York (NY1, NY2, NY3), two for London (LON1, LON2), two for Tokyo (TKO1, TKO2), and keeps Sydney as an optional session. Each block can be enabled or disabled independently and comes with its own adjustable color, letting you build clear visual maps for time-based strategies, overlaps, and microstructure nuances.
In the inputs panel you’ll find the “Activate High/Low View” option. When enabled, the indicator incrementally computes each sub-session’s low and high and shades the area between them with fill, giving you an immediate reference to the intra-session range (useful for gauging compression/expansion and potential breakouts). When disabled, it switches to a clean bgcolor background by block—ideal if you prefer a minimal chart and simply want to distinguish time windows at a glance.
The core logic relies on two helper functions: is_session(sess), which detects whether the current bar falls within a given time window, and is_newbar(sess), which identifies the start of a new reference bar according to your chosen reset resolution (D, W, or M). With this combination, each sub-session resets its high/low at the beginning of the period and updates them bar by bar while the block remains active. This prevents cross-contamination between sessions and ensures the range you see belongs strictly to the configured segment.
Default hours are suited to Forex and include segments that cross midnight (e.g., Tokyo 2 and Sydney). Pine Script supports ranges like 2200-0200; however, if your broker or chart timezone causes partial shading, simply split the segment into two: 2200-2359 and 0000-0200. Each input.session uses the :1234567 suffix to enable all seven days; you can easily restrict days to match your plan.
Practically speaking, the indicator helps you identify: (1) range structure by sub-session (great for breakout or mean-reversion frameworks), (2) overlaps between London and New York, where liquidity and directional moves often concentrate, and (3) lower-volatility windows (late Asia or pre-news lulls). Independent colors per block let you visually encode priority or your trading plan (for example, richer tones in high-probability windows).
Thanks to its modular design, customization is straightforward: adjust colors, toggle blocks, change hours, and tweak the range-reset resolution to suit your routine. As a natural extension, you can add alerts for sub-session high/low breakouts or labels that display the range height (in pips) at session close. While no indicator replaces trader judgment or constitutes financial advice, this tool offers a robust visual foundation for incorporating the time factor directly into your decision-making, helping you contextualize price action within the rhythm of global trading sessions.
DodgyDD IndicatorIFVG setup indicator. I have not added support for IFVG with major liquidity sweep. The idea is if the price breaks previous swing and the quickly retract forming IFVG it will notify