在腳本中搜尋"low"
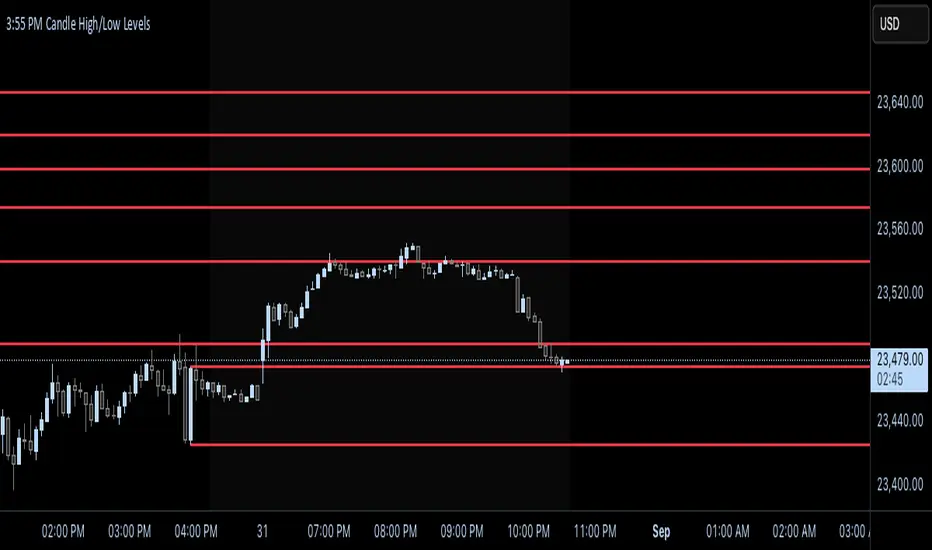
Candle Base Highs/Low LevelsThis script uses the zig zag indicator to mark out highs and lows using the candle base. Or lowest/highest open/close. Levels extend until being tapped. Variability can be toggled within options menu

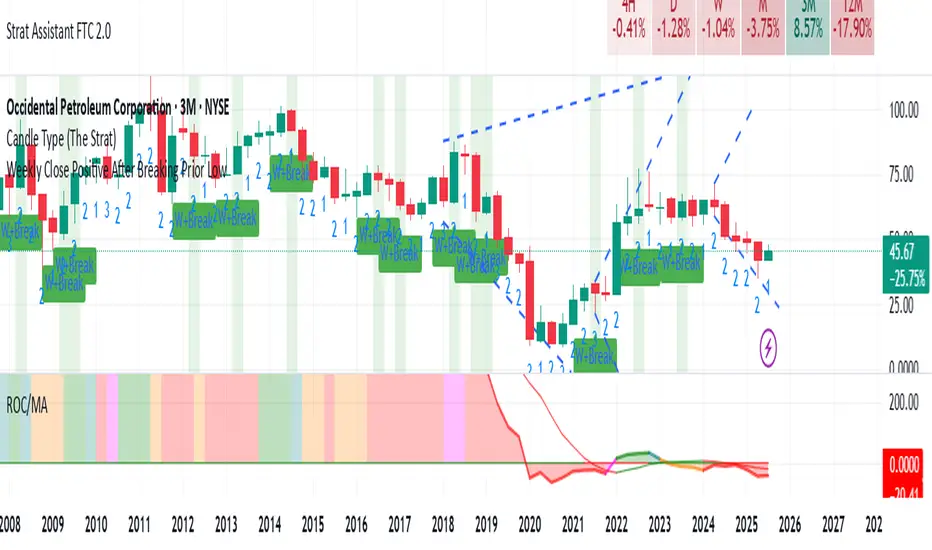
Weekly Close Positive After Breaking Prior LowClosing positive after breaking prior low on weekly basis
High and Low - MS - 2.0"Showing the high and low points with numbers.
Micha the leftist didn’t say how it’s called in his video.
#LeftismIsAMentalIllness"
נותן לראות את הנקודות הגבוהות והנמוכות עם מספרים
מיכה השמאלן לא אמר איך קוראים לזה בסרטון שלו
#שמאלנותזומחלתנפש
14/09/2025

High and Low - MSShowing the high and low points with numbers.
Micha the leftist didn’t say how it’s called in his video
#LeftismIsAMentalIllness
נותן לראות את הנקודות הגבוהות והנמוכות עם מספרים
מיכה השמאלן לא אמר איך קוראים לזה בסרטון שלו
#שמאלנותזומחלתנפש
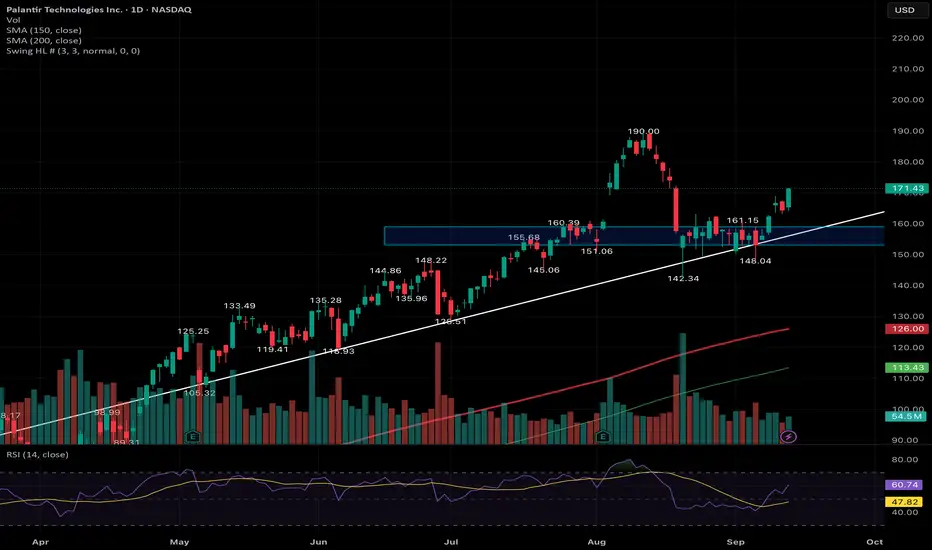
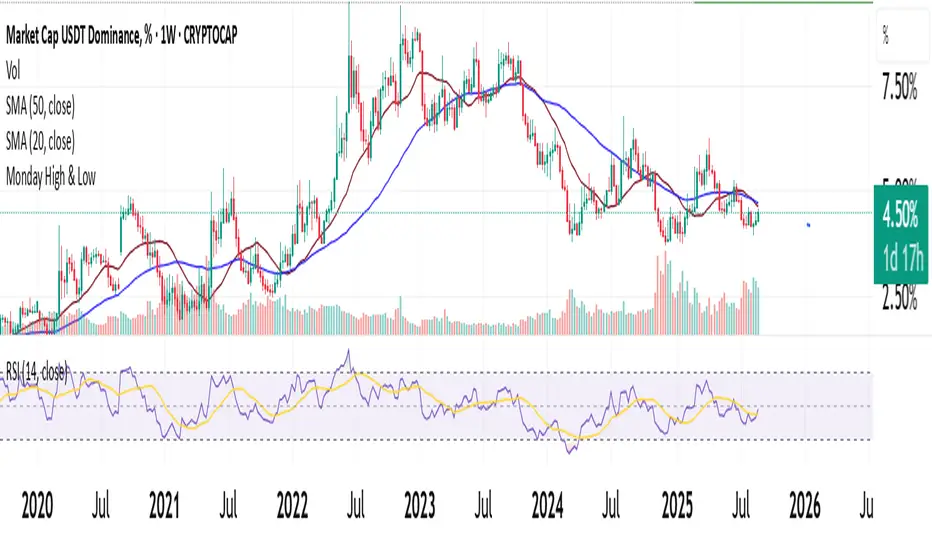
RSI HIGHs and LOWs MarkerThis indicator marks significant RSI (14) pivot points directly on the price chart.
Red markers above candles highlight confirmed RSI highs where the RSI value exceeded 75 (overbought zone).
Green markers below candles highlight confirmed RSI lows where the RSI value dropped below 25 (oversold zone).
These signals help traders quickly identify potential reversal zones and overextended market conditions without having to monitor the RSI window separately.

Hourly Pivot High/Low LinesMarks out hourly high/lows, and draws them horizontally from the start of the pivot. Line will stop once it is tapped into. Used in my own model, not working 100% of the time.

Trajectory Channel (VWAP Highs/Lows) [Euler-Inspired]VPWA higha nd low Euler trajectory inspired script

Swing High/Low Levels (Auto Remove)Plots untapped swing high and low levels from higher timeframes. Used for liquidity sweep strategy. Cluster of swing levels are a magnet for price to return to and reverse. Indicator gives option for candle body or wick for sweep to remove lines.

Swing High/Low Levels (Auto Remove)Plots untapped swing high and low levels from higher timeframes. Used for liquidity sweep strategy. Cluster of swing levels are a magnet for price to return to and reverse. Indicator gives option for candle body or wick for sweep.

4H Candles High and Lows (#1-6) UTC - Last 32h - Colored BlocksThis script creates horizontal rays on the high and low in a 4 Hour period.

Previous Week High/Low Fib Levelsautomatic fib with previous week high and low with custom retracement input

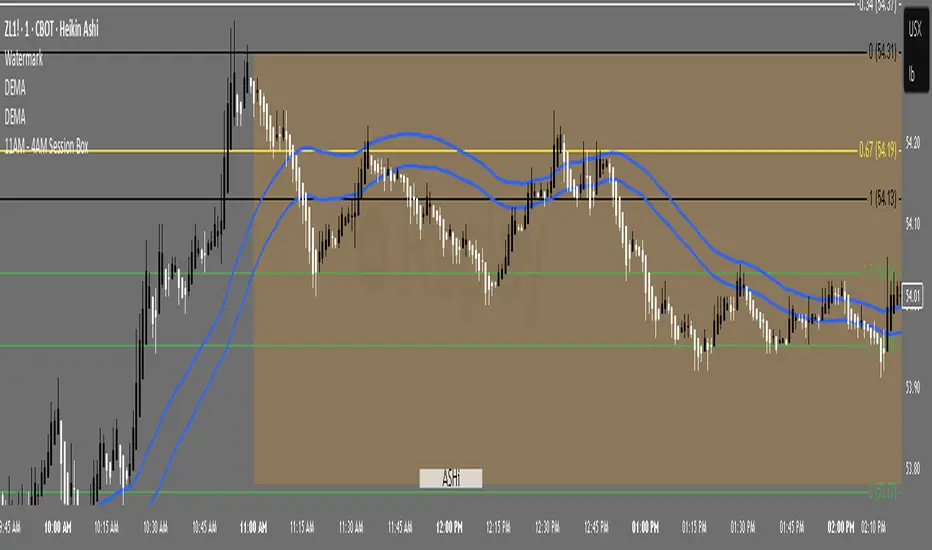
Custom Session Box (high and low of selected time range)Simply put this draws a box from the high and low of any time range you desire including wicks.
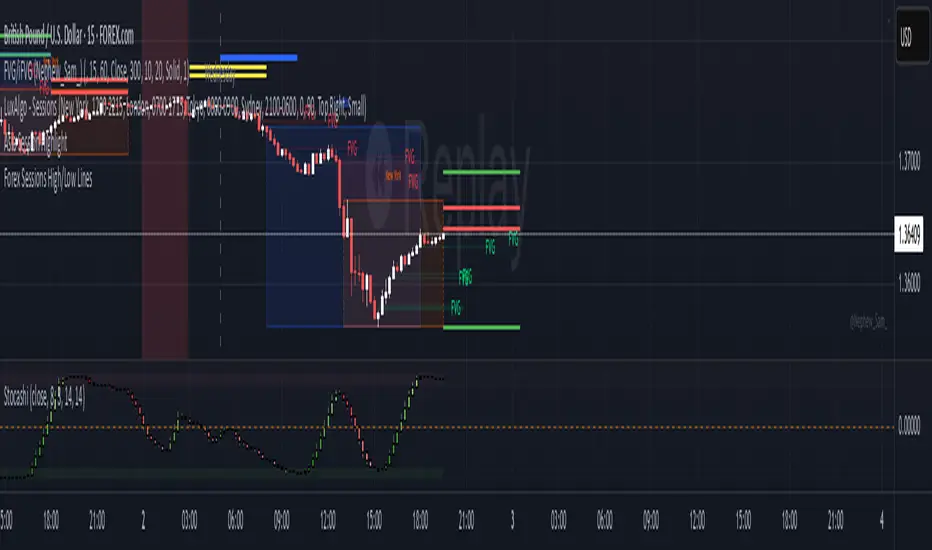
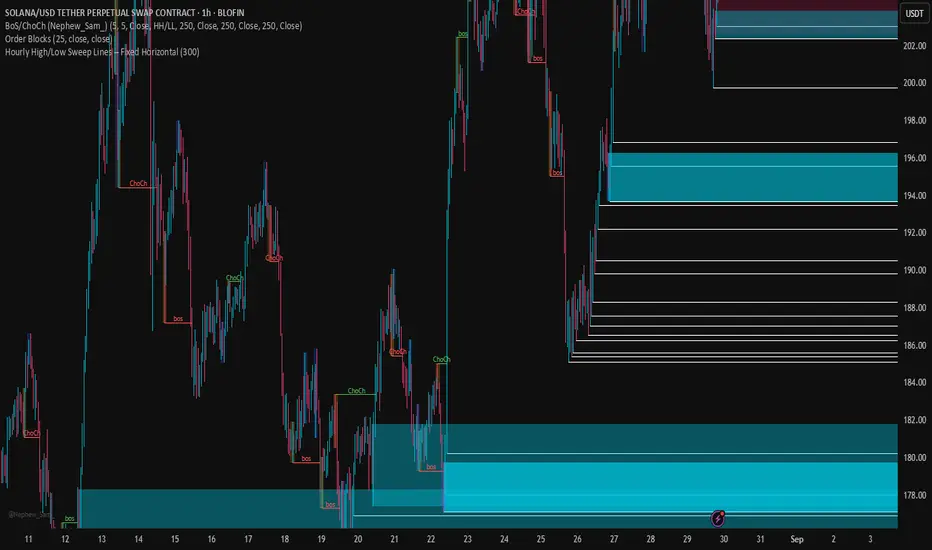
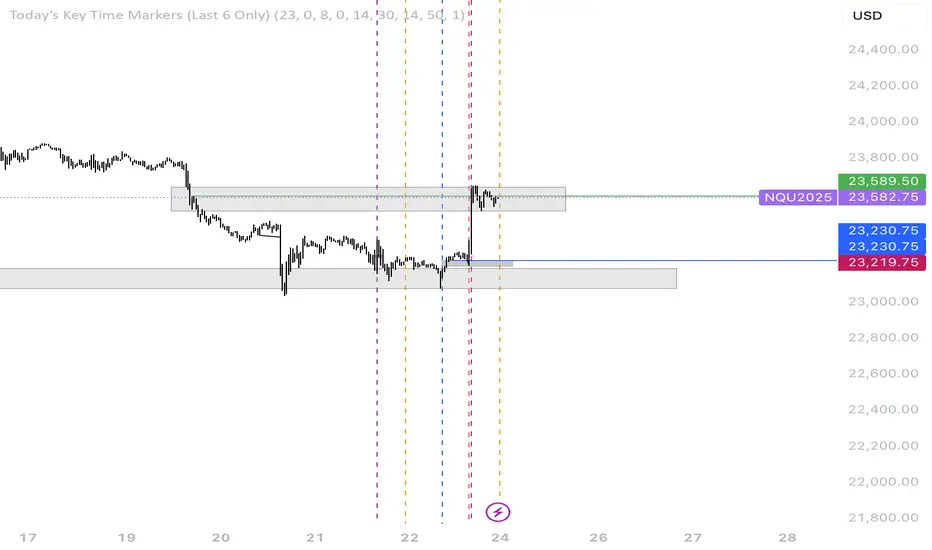
Hourly High/Low Sweep Lines – Fixed HorizontalMarks out the hourly high and lows for levels of liquidity for take profits
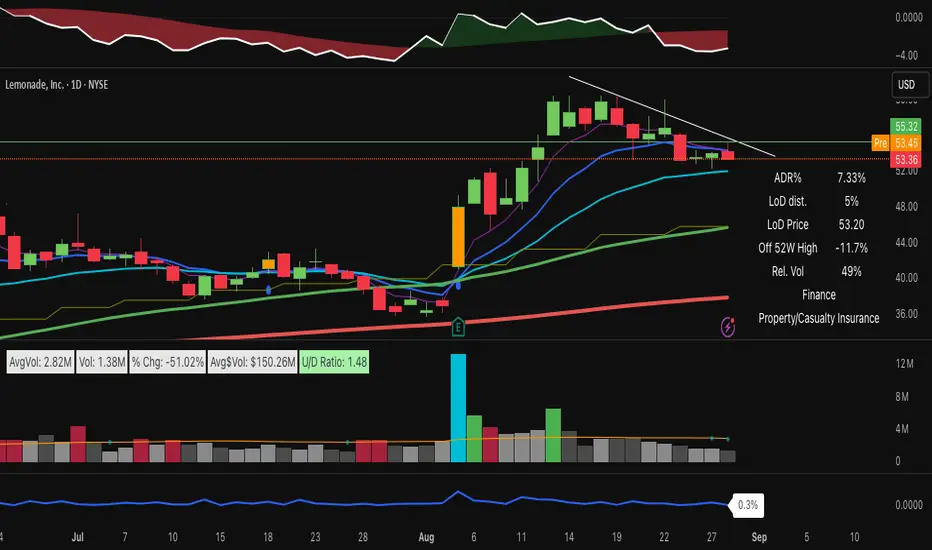
Live price distance from low of the dayThis simple indicator state the distance of the actual price from the low of the day - Simple tool to help position sizing :)
MTF Last Closed Highs & LowsThis indicator plots the most recent closed high and low levels from multiple timeframes (4H, Daily, Weekly, Monthly, etc.) directly on your chart. It helps traders quickly spot key support and resistance zones, track market structure across different timeframes, and identify breakout or reversal opportunities.

Auto Daily High/Low/50%This indicator automatically plots the current daily high and low, as well as the midrange.

Customisable Asia & London Session High/Low (UTC+1)london + asia high / low
can customise however you like. its not perfect but saves time
Daily High & Low - 200 bars (Historical)Daily highs and lows.
High marked with a red line.
Low marked with a green line.
plotted on the 5 min chart.

Previous Days High & Low RTH Session by TenAM TraderPurpose:
This indicator plots the high and low levels of previous trading days’ Regular Trading Hours (RTH), helping traders identify key support and resistance zones based on historical price action.
How to Use / Strategy:
Designed as a super simple trading strategy:
Buy when price breaks above and confirms the previous day’s high.
Sell when price breaks below and confirms the previous day’s low.
Alerts notify you when price interacts with these levels, helping traders act on confirmed breakout opportunities rather than premature moves.
*Traders can also look for reversal opportunities if price breaks back through one of the levels.
Note: Make sure RTH (Regular Trading Hours) is turned on for the chart, as the indicator is based on RTH highs and lows.
Features:
Tracks previous days’ highs and lows.
Provides clear visual reference for support and resistance.
Simple, actionable strategy based on breakout confirmations and reversal plays.
Alerts for confirmed price breaks.
Disclaimer:
This indicator is for educational and informational purposes only. It does not provide financial advice. Trading involves risk, and past performance does not guarantee future results. Users trade at their own risk.

Clean Session Highs/Lows UKThis indicator was supposed to track the Sydney and Tokyo session highs and lows, but it doesn’t work. Lines either go vertical, don’t align with candles, or just vanish. Tried to code it in Pine Script v5, but apparently even GPT can’t get it right — so don’t bother expecting it to function properly. Basically, a complete waste of time.