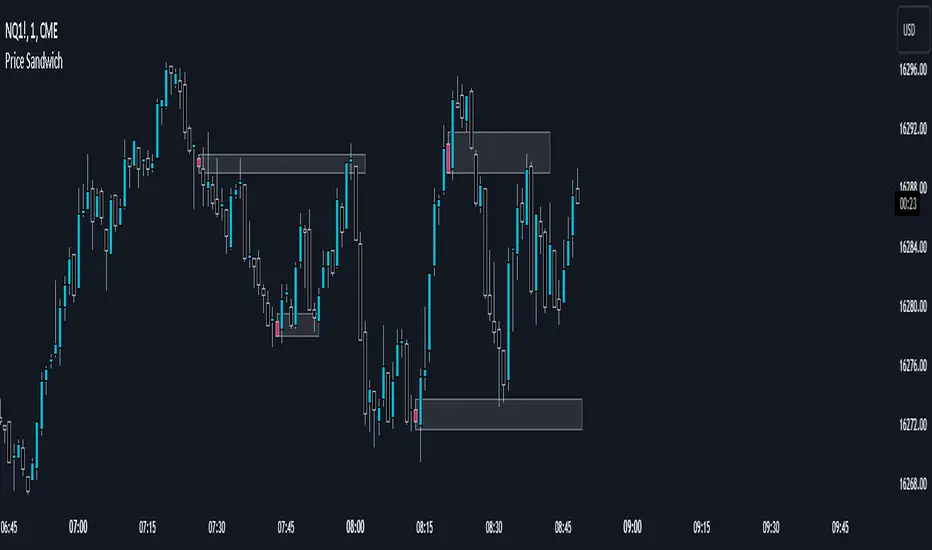
Price SandwichFor the script in question
This script acts as an indicator that a potential short term or long term trend reversal is coming. Note that not every candle can be used as an indication and the smaller ones tend to have little to no effect, however they can be used alongside orderblocks or future support/resistance areas.
The best timeframes I've found these to be useable are on the 1m, 2m, or second charts.
You may use this as an added confluence that a trend is ending either short term or long term.
You may also decide to use this with other indicators to build further confluence.
Note that this is just something I've noticed personally most likely does not apply to all trend reversals.
Some ideas on how to use it:
If you extend a rectangle out from the block itself, you can often find the next high or low overlaps with said rectangle.
They may also overlap with a fair value gap that could make that gap have more potential.
Hope this is of use and can help with that added confluence or early warning signal of a potential reversal. This should not be used alone and it's recommended to not use this as a surefire indication of whether to take a trade.//Krindler
Script Breakdown
//@version=5 // this makes the script v5 friendly
indicator("Price Sandwich", overlay=true) //makes this script an indicator, overlay=true to make it a part of the main chart
// User input for the highlight color
userColor = input(color.green, title="Highlight Color") //This allows you to choose what color you want the candle to be in the settings
//Function to check the custom candle pattern based on whether the candle is being englulfed by both preceding and latter candle.
isCustomPattern() => //let's me look for a custom candle pattern
high > high and high < high and low < low and low > low
//this checks the candle before and the candle after to check that the candle in the middle doesn't escape the range of the candle before, or the candle afters highs and lows thus making it a sandwiched candle.
//high > high and high < high and low < low and low > low basically says: candle 1 high must be greater than candle 2 high and candle 2 high must be less than candle 3 high and candle 1 low must be less than candle 2 low and candle 2 low must be greater than candle 3 low. Thus making sure that candle 2 is within the range of candle's 1 and 3 and doesn't have a high or low that is either above or below candle 1 and 3. 'and' is the operator to make sure that all of these values must be true in order for that candle to meet the criteria of getting colored.
// Apply bar color to Sandwiched candle if candle is found.
barcolor(isCustomPattern() ? userColor : na, offset=-1) //this targets the findings from isCustomPattern() and uses the user color chosen in settings and colors the middle bar by using offset=-1, otherwise it would color candle 3, so offset goes back 1 candle to color the middle candle.
If this script is already in circulation, please let me know and i'll remove it immediately. I checked but couldn't find one that did it.
在腳本中搜尋"low"
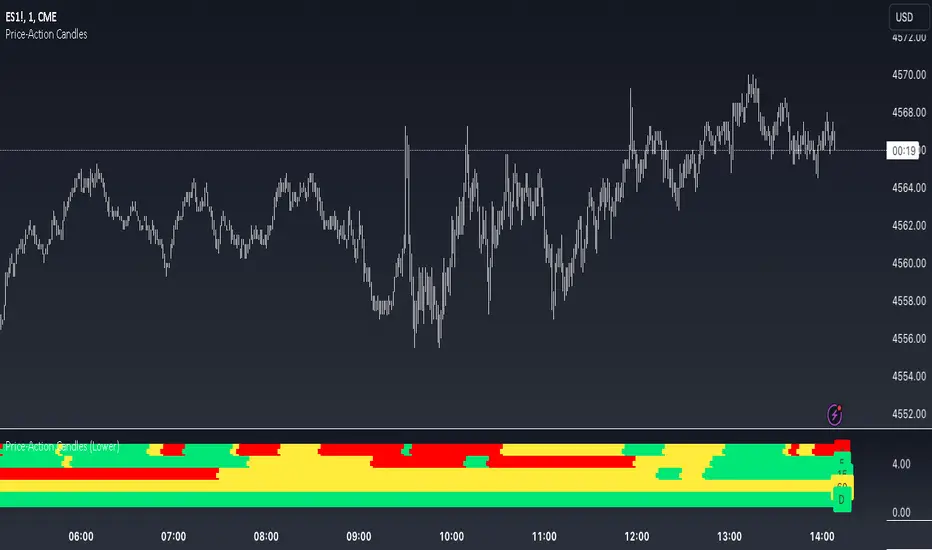
Price-Action Candles (Lower)What is a swing high or swing low?
Swing highs and lows are price extremes. For example say we set our swing length to 5. A candle that is a swing high with a swing length of 5 will have 5 bars to the left that are lower and 5 bars to the right that are lower. A candle that is a swing low with a swing length of 5 will have 5 bars to the left that are higher and 5 bars to the right that are higher.
How is the trend coloring calculated?
The trend coloring is calculated the exact same way as our trend candles study... by storing and comparing historical swing lows and swing highs.
The pinescript code goes as follows:
The pinescript code goes as follows:
var int trend = na
trend := ((hh and high >= psh) or close > csh) ? 1 : ((ll and low <= psl) or close < csl) ? -1 : lh or hl ? 0 : trend
What does that gibberish mean?
-Trend can be GREEN IF
- We have a higher high (current swing high is greater than the previous swing high) and the high is greater than the previous swing high
- OR The current close is greater than the current swing high
-Trend can be RED IF
- We have a lower low (current swing low is less than the previous swing low) and the low is less than the previous swing low
- OR The current close is less than the current swing low
-Trend can be YELLOW IF
- We have a new swing high and the new swing high is less than the previous swing high
- OR We have a new swing low and the new swing low is greater than the previous swing low
If none of the conditions above are true then we continue with whatever color the previous bar was.
What is repainting?
Repainting is "script behavior causing historical vs realtime calculations or plots to behave differently." That definition comes directly from Tradingview. If you want to read the full explanation you can visit it here www.tradingview.com . The price-action candles use swing highs and swing lows which need bars to the left (past) and bars to the right ("future") in order to confirm the swing level. Because of the need to wait for confirmation for swing levels the plot style can be repainting. The Price-Action Candles (Lower) indicator, or this indicator, has no repainting anywhere. We opt to not shift back the candle coloring which causes the repainting, but it is relevant to discuss since this indicator's sibling (Price-Action Candles) can have repainting labels.
Repaint
Here the labels are shifted back the price-action length. Repainting is not present in the Price-Candles (Lower) study, but can be found in this indicator's sibling (Price-Action Candles).
Non-Repaint
Here the labels are not shifted back or "repainted". Repainting is not present in the Price-Candles (Lower) study, but can be found in this indicator's sibling (Price-Action Candles).
Multi-timeframe Analysis
The users can view multi-timeframe historical price action trend via this lower study. Each timeframe is plotted as its own on the lower pane and you can determine what timeframe it is by the label next to the plot.
More examples
Pair the Price-Action Candles (Lower) indicator with our main price indicator that colors candles based on trend and can show price action labels.
Scoopy StacksWaffle Around Multiple
(Open, High, Low, Close) Stacks On
Pre/Post Market & (Daily, Weekly,
Monthly, Yearly) Sessions With
Meticulous Columns, Rows, Tooltips,
Colors, Custom Ideas, and Alerts.
Sessions Use Two Step Incremental Values
Default Value: (1) Shows Two Previous
(O, H, L, C); Increasing Value Swaps
Sessions With Next Two Stacks.
⬛️ KEY WORDS:
🟢 Crossover | 🔴 Crossunder
📗 High | 📕 Low
📔 Open | 📓 Close
🥇 First Idea | 🥈 Second Idea
🥉 Third Idea | 🎖️ Fourth Idea
🟥 ALERTS:
Default Option: (Per Bar)
Alerts Once Conditions Are Met
(Bar Close) Alerts When Bar Closes
Default Option: (Reg)
Alerts During Regular Market
Trading Hours, (0930-1600)
(Ext) Alerts During Extended
Market Hours, (1600-0930)
(24/7) Alerts All Day
Optional Preferences:
Regular Alerts - Stocks
Extended Alerts - Futures
24/7 Alerts - Crypto
🟧 STACKS:
Default Value: (1)
Incremental Stack Value, Increasing Value
Swaps Sessions With the Next Two Stacks
(✓) Swap Stacks?
Pre/Post Market High/Lows,
1-2 Day High/Lows, 1-2 Week High/Lows,
1-2 Month High/Lows, 1-2 Year High/Lows
( ) Swap Stacks?
Pre/Post Market Open/Close,
1-2 Day Open/Close, 1-2 Week Open/Close,
1-2 Month Open/Close, 1-2 Year Open/Close
🟨 EXAMPLES:
Default Stack:
🟢 | 📗 Pre Market High (PRE) | 4600.00
🔴 | 📕 Post Market Low (POST) | 420.00
Optional: (Open)
🟢 | 📔 Post Market Open (POST) | 4400.00
Optional: (Close)
🔴 | 📓 Pre Market Close (PRE) | 430.00
Default Stack Value: (1)
🔴 | 📗 1 Day High (1DH) | 460.00
Next Stack Value: (3)
🟢 | 📕 4 Day Low (4DL) | 420.00
Optional: (Open)
🔴 | 📔 2 Day Open (2DO) | 440.00
Optional: (Close)
🟢 | 📓 3 Day Close (3DC) | 430.00
Default Stack Value: (5)
🟢 | 📗 5 Week High (5WH) | 460.00
Next Stack Value: (7)
🔴 | 📕 8 Week Low (8WL) | 420.00
Optional: (Open)
🔴 | 📔 7 Week Open (7WO) | 4400.00
Optional: (Close)
🟢 | 📓 6 Week Close (6WC) | 430.00
Default Stack Value: (9)
🔴 | 📗 9 Month High (9MH) | 460.00
Next Stack Value: (11)
🟢 | 📕 12 Month Low (12ML) | 420.00
Optional: (Open)
🟢 | 📔 11 Month Open (11MO) | 4400.00
Optional: (Close)
🔴 | 📓 10 Month Close (10MC) | 430.00
Default Stack Value: (13)
🟢 | 📗 13 Year High (13YH) | 460.00
Next Stack Value: (15)
🟢 | 📕 16 Year Low (16YL) | 420.00
Optional: (Open)
🔴 | 📔 15 Year Open (15YO) | 4400.00
Optional: (Close)
🔴 | 📓 14 Year Close (14YC) | 430.00
🟩 TABLES:
Default Value: (1)
Moves Table Up, Down, Left, or Right
Based on Second Default Value
First Default Value: (Top Right)
Sets Table Placement, Middle Center
Allows Table To Move In All Directions
Second Default Value: (Default)
Fixed Table Position, Switching Values
Moves Direction of the Table
🟦 IDEAS:
(✓) Show Ideas?
Shows Four Ideas With Custom Texts
and Values; Ideas Are Based Around
Post-It Note Reminders with Alerts
Suggestions For Text Ideas:
Take Profit, Stop Loss, Trim, Hold,
Long, Short, Bounce Spot, Retest,
Chop, Support, Resistance, Buy, Sell
🟪 EXAMPLES:
Default Value: (5)
Shows the Custom Table Value For
Sorted Table Positions and Alerts
Default Text: (🥇)
Shown On First Table Cell and
Message Appearing On Alerts
Alert Shows: 🟢 | 🥇 | 5.00
Default Value: (10)
Shows the Custom Table Value For
Sorted Table Positions and Alerts
Default Text: (🥈)
Shown On Second Table Cell and
Message Appearing On Alerts
Alert Shows: 🔴 | 🥈 | 10.00
Default Value: (50)
Shows the Custom Table Value For
Sorted Table Positions and Alerts
Default Text: (🥉)
Shown On Third Table Cell and
Message Appearing On Alerts
Alert Shows: 🟢 | 🥉 | 50.00
Default Value: (100)
Shows the Custom Table Value For
Sorted Table Positions and Alerts
Default Text: (🎖️)
Shown On Fourth Table Cell and
Message Appearing On Alerts
Alert Shows: 🔴 | 🎖️ | 100.00
⬛️ REFERENCES:
Pre-market Highs & Lows on regular
trading hours (RTH) chart
By Twingall
Previous Day Week Highs & Lows
By Sbtnc
Screener for 40+ instruments
By QuantNomad
Daily Weekly Monthly Yearly Opens
By Meliksah55

Ribbit RangesBounce Around Multiple
(Open, High, Low, Close) Ranges
On Pre/Post Market & (Daily, Weekly,
Monthly, Yearly) Sessions With
Meticulous Lines, Labels, Tooltips,
Colors, Custom Ideas, and Alerts.
Sessions Use Two Step Incremental Values
Default Value: (1) Shows Two Previous
(O, H, L, C); Increasing Value Swaps
Sessions With Next Two Ranges.
⬛️ KEY WORDS:
🟢 Crossover | 🔴 Crossunder
📗 High | 📕 Low
📔 Open | 📓 Close
🥇 First Idea | 🥈 Second Idea
🥉 Third Idea | 🎖️ Fourth Idea
🟥 ALERTS:
Default Option: (Per Bar)
Alerts Once Conditions Are Met
(Bar Close) Alerts When Bar Closes
Default Option: (Reg)
Alerts During Regular Market
Trading Hours, (0930-1600)
(Ext) Alerts During Extended
Market Hours, (1600-0930)
(24/7) Alerts All Day
Optional Preferences:
Regular Alerts - Stocks
Extended Alerts - Futures
24/7 Alerts - Crypto
🟧 RANGES:
Default Value: (1)
Incremental Range Value, Increasing Value
Swaps Sessions With the Next Two Ranges
(✓) Swap Ranges?
Pre/Post Market High/Lows,
1-2 Day High/Lows, 1-2 Week High/Lows,
1-2 Month High/Lows, 1-2 Year High/Lows
( ) Swap Ranges?
Pre/Post Market Open/Close,
1-2 Day Open/Close, 1-2 Week Open/Close,
1-2 Month Open/Close, 1-2 Year Open/Close
🟨 EXAMPLES:
Default Range:
🟢 | 📗 Pre Market High (PRE) | 4600.00
🔴 | 📕 Post Market Low (POST) | 420.00
Optional: (Open)
🟢 | 📔 Post Market Open (POST) | 4400.00
Optional: (Close)
🔴 | 📓 Pre Market Close (PRE) | 430.00
Default Range Value: (1)
🔴 | 📗 1 Day High (1DH) | 460.00
Next Range Value: (3)
🟢 | 📕 4 Day Low (4DL) | 420.00
Optional: (Open)
🔴 | 📔 2 Day Open (2DO) | 440.00
Optional: (Close)
🟢 | 📓 3 Day Close (3DC) | 430.00
Default Range Value: (5)
🟢 | 📗 5 Week High (5WH) | 460.00
Next Range Value: (7)
🔴 | 📕 8 Week Low (8WL) | 420.00
Optional: (Open)
🔴 | 📔 7 Week Open (7WO) | 4400.00
Optional: (Close)
🟢 | 📓 6 Week Close (6WC) | 430.00
Default Range Value: (9)
🔴 | 📗 9 Month High (9MH) | 460.00
Next Range Value: (11)
🟢 | 📕 12 Month Low (12ML) | 420.00
Optional: (Open)
🟢 | 📔 11 Month Open (11MO) | 4400.00
Optional: (Close)
🔴 | 📓 10 Month Close (10MC) | 430.00
Default Range Value: (13)
🟢 | 📗 13 Year High (13YH) | 460.00
Next Range Value: (15)
🟢 | 📕 16 Year Low (16YL) | 420.00
Optional: (Open)
🔴 | 📔 15 Year Open (15YO) | 4400.00
Optional: (Close)
🔴 | 📓 14 Year Close (14YC) | 430.00
🟩 COLORS:
(✓) Swap Colors?
Text Color Is Shown Using
Background Color
( ) Swap Colors?
Background Color Is Shown
Using Text Color
🟦 IDEAS:
(✓) Show Ideas?
Plots Four Ideas With Custom Lines
and Labels; Ideas Are Based Around
Post-It Note Reminders with Alerts
Suggestions For Text Ideas:
Take Profit, Stop Loss, Trim, Hold,
Long, Short, Bounce Spot, Retest,
Chop, Support, Resistance, Buy, Sell
🟪 EXAMPLES:
Default Value: (5)
Shows the Custom Value For
Lines, Labels, and Alerts
Default Text: (🥇)
Shown On First Label and
Message Appearing On Alerts
Alert Shows: 🟢 | 🥇 | 5.00
Default Value: (10)
Shows the Custom Value For
Lines, Labels, and Alerts
Default Text: (🥈)
Shown On Second Label and
Message Appearing On Alerts
Alert Shows: 🔴 | 🥈 | 10.00
Default Value: (50)
Shows the Custom Value For
Lines, Labels, and Alerts
Default Text: (🥉)
Shown On Third Label and
Message Appearing On Alerts
Alert Shows: 🟢 | 🥉 | 50.00
Default Value: (100)
Shows the Custom Value For
Lines, Labels, and Alerts
Default Text: (🎖️)
Shown On Fourth Label and
Message Appearing On Alerts
Alert Shows: 🔴 | 🎖️ | 100.00
⬛️ REFERENCES:
Pre-market Highs & Lows on regular
trading hours (RTH) chart
By Twingall
Previous Day Week Highs & Lows
By Sbtnc
Screener for 40+ instruments
By QuantNomad
Daily Weekly Monthly Yearly Opens
By Meliksah55

Percentile Based Trend StrengthThe "Percentile Based Trend Strength" (PBTS) calculates trend strength based on percentile values of high and low prices for various length periods and then identifies the current trend as either Bullish, Bearish, or N/A (No Trend). Here's a step-by-step explanation of the code:
Percentile Calculations:
For each specified length period (13, 21, 34, 55, 89, and 144 - Fibonacci numbers), the code calculates the 75th percentile of high prices (e.g., percentile_13H) and the 25th percentile of low prices (e.g., percentile_13L). These percentiles represent levels that prices need to exceed or fall below to indicate a strong trend.
Calculate Highest High and Lowest Low:
The highest high (75th percentile high price of longest length) and lowest low (25th percentile low price of longest length) for the longest length period (144) are calculated as highest_high and lowest_low. These values represent threshold price levels .
Trend Strength Conditions:
The code calculates various conditions to determine trend strength. For each percentile value and each length period, it checks if the percentile value is greater than the highest high (trendBull) or less than the lowest low (trendBear). These conditions are used to assess the strength of the bullish and bearish trends.
Count Bull and Count Bear:
The countBull and countBear variables count the number of bullish and bearish conditions met, respectively. These counts help evaluate trend strength.
Weak Bull and Weak Bear Count:
The code calculates the number of weak bullish and bearish conditions. Weak conditions occur when a percentile value falls within the range defined by the highest high and lowest low but doesn't meet the strong trend criteria.
Bull Strength and Bear Strength:
bullStrength and bearStrength are calculated based on the counts of bullish, bearish, weak bullish, and weak bearish conditions. These values represent the overall strength of the bullish and bearish trends.
Strong Bull and Bear Conditions:
These conditions occur when the 75th percentile of high prices (for bull conditions) or the 25th percentile of low prices (for bear conditions) exceeds or falls below the highest high or lowest low, respectively, for the specified length period.
Strong bull conditions indicate a strong upward trend, while strong bear conditions indicate a strong downward trend.
Strong conditions are indicative of more significant price movements and are considered as primary signals of trend strength.
Weak Bull and Bear Conditions:
Weak bull and bear conditions are more nuanced. They occur when the 75th percentile of high prices (for weak bull conditions) or the 25th percentile of low prices (for weak bear conditions) falls within the range defined by the highest high and lowest low for the specified length period.
In other words, prices are not strong enough to reach the extreme levels represented by the highest high or lowest low, but they still exhibit some bullish or bearish tendencies within that range.
Weak conditions suggest a less robust trend. They may indicate that while there is some bias toward a bullish or bearish trend, it is not as strong or decisive as in the case of strong conditions.
Current Trend Identification:
The current trend is determined by comparing bullStrength and bearStrength. If bullStrength is greater, it's considered a Bull trend; if bearStrength is greater, it's a Bear trend. If they are equal, the trend is identified as N/A (No Trend).
Displaying Trend Information:
The code creates a table to display the current trend, reversal probability (strength), count of bullish and bearish conditions, weak bullish and weak bearish counts, and colors the text accordingly.
Plotting Percentiles:
Finally, the code plots the percentile lines for visualization, with 20% transparency. It also plots the highest high and lowest low lines (75th and 25th percentile of the longest length 144) using their original colors.
In summary, this indicator calculates trend strength based on percentile levels of high and low prices for different length periods. It then counts the number of bullish and bearish conditions, factors in weak conditions, and compares the strengths to identify the current trend as Bullish, Bearish, or No Trend. It provides a table with trend information and visualizes percentile lines on the chart.

Z-Score Based Momentum Zones with Advanced Volatility ChannelsThe indicator "Z-Score Based Momentum Zones with Advanced Volatility Channels" combines various technical analysis components, including volatility, price changes, and volume correction, to calculate Z-Scores and determine momentum zones and provide a visual representation of price movements and volatility based on multi timeframe highest high and lowest low values.
Note: THIS IS A IMPROVEMNT OF "Multi Time Frame Composite Bands" INDICATOR OF MINE WITH MORE EMPHASIS ON MOMENTUM ZONES CALULATED BASED ON Z-SCORES
Input Options
look_back_length: This input specifies the look-back period for calculating intraday volatility. correction It is set to a default value of 5.
lookback_period: This input sets the look-back period for calculating relative price change. The default value is 5.
zscore_period: This input determines the look-back period for calculating the Z-Score. The default value is 500.
avgZscore_length: This input defines the length of the momentum block used in calculations, with a default value of 14.
include_vc: This is a boolean input that, if set to true, enables volume correction in the calculations. By default, it is set to false.
1. Volatility Bands (Composite High and Low):
Composite High and Low: These are calculated by combining different moving averages of the high prices (high) and low prices (low). Specifically:
a_high and a_low are calculated as the average of the highest (ta.highest) and lowest (ta.lowest) high and low prices over various look-back periods (5, 8, 13, 21, 34) to capture short and long-term trends.
b_high and b_low are calculated as the simple moving average (SMA) of the high and low prices over different look-back periods (5, 8, 13) to smooth out the trends.
high_c and low_c are obtained by averaging a_high with b_high and a_low with b_low respectively.
IDV Correction Calulation : In this script the Intraday Volatility (IDV) is calculated as the simple moving average (SMA) of the daily high-low price range divided by the closing price. This measures how much the price fluctuates in a given period.
Composite High and Low with Volatility: The final c_high and c_low values are obtained by adjusting high_c and low_c with the calculated intraday volatility (IDV). These values are used to create the "Composite High" and "Composite Low" plots.
Composite High and Low with Volatility Correction: The final c_high and c_low values are obtained by adjusting high_c and low_c with the calculated intraday volatility (IDV). These values are used to create the "Composite High" and "Composite Low" plots.
2. Momentum Blocks Based on Z-Score:
Relative Price Change (RPC):
The Relative Price Change (rpdev) is calculated as the difference between the current high-low-close average (hlc3) and the previous simple moving average (psma_hlc3) of the same quantity. This measures the change in price over time.
Additionally, std_hlc3 is calculated as the standard deviation of the hlc3 values over a specified look-back period. The standard deviation quantifies the dispersion or volatility in the price data.
The rpdev is then divided by the std_hlc3 to normalize the price change by the volatility. This normalization ensures that the price change is expressed in terms of standard deviations, which is a common practice in quantitative analysis.
Essentially, the rpdev represents how many standard deviations the current price is away from the previous moving average.
Volume Correction (VC): If the include_vc input is set to true, volume correction is applied by dividing the trading volume by the previous simple moving average of the volume (psma_volume). This accounts for changes in trading activity.
Volume Corrected Relative Price Change (VCRPD): The vcrpd is calculated by multiplying the rpdev by the volume correction factor (vc). This incorporates both price changes and volume data.
Z-Scores: The Z-scores are calculated by taking the difference between the vcrpd and the mean (mean_vcrpd) and then dividing it by the standard deviation (stddev_vcrpd). Z-scores measure how many standard deviations a value is away from the mean. They help identify whether a value is unusually high or low compared to its historical distribution.
Momentum Blocks: The "Momentum Blocks" are essentially derived from the Z-scores (avgZScore). The script assigns different colors to the "Fill Area" based on predefined Z-score ranges. These colored areas represent different momentum zones:
Positive Z-scores indicate bullish momentum, and different shades of green are used to fill the area.
Negative Z-scores indicate bearish momentum, and different shades of red are used.
Z-scores near zero (between -0.25 and 0.25) suggest neutrality, and a yellow color is used.

Moving Average - TREND POWER v1.1- (AS)0)NOTE:
This is first version of this indicator. It's way more complicated than it should be. Check out Moving Average-TREND POWER v2.1-(AS), its waaaaay less complicated and might be better.Enjoy...
1)INTRODUCTION/MAIN IDEA:
In simpliest form this script is a trend indicator that rises if Moving average if below price or falling if above and going back to zero if there is a crossover with a price. To use this indicator you will have to adjust settings of MAs and choose conditions for calculation.
While using the indicator we might have to define CROSS types or which MAs to use. List of what cross types are defined in the script and Conditiones to choose from.The list will be below.
2) COMPOSITION:
-MA1 can be defined by user in settings, possible types: SMA, EMA, RMA, HMA, TEMA, DEMA, LSMA, WMA.
-MA2 is always ALMA
3) OVERLAY:
Default is false but if you want to see MA1/2 on chart you can change code to true and then turn on overlay in settings. Most plot settings are avalible only in OV=false.
if OV=true possible plots ->MA1/2, plotshape when choosen cross type
if OV=false -> main indicator,TSHs,Cross counter
4)PRESETS :
Indicator has three modes that can be selected in settings. First two are presets and do not require selecting conditions as they set be default.
-SIMPLE - most basic
-ABSOLUTE - shows only positive values when market is trending or zero when in range
-CUSTOM - main and the most advanced form that will require setting conditions to use in calculating trend
4.1)SIMPLE – this is the most basic form of conditions that uses only First MA. If MA1 is below selected source (High/Low(High for Uptrend and Low for DNtrend or OHLC4) on every bar value rises by 0.02. if it above Low or OHLC4 it falls by 0.02 with every bar. If there is a cross of MA with price value is zero. This preset uses CROSS_1_ULT(list of all cross types below)
4.2) ABSOLUTE – does not show direction of the trend unlike others and uses both MA1 and MA2. Uses CROSS type 123_ULT
4.3) CUSTOM – here we define conditions manually. This mode is defined in parts (5-8 of description)
5)SETTINGS:
SOURCE/OVERLAY(line1) – select source of calculation form MA1/MA2, select for overlay true (look point 3)
TRESHOLDS(line2). – set upper and lower THS, turn TSHs on/off
MA1(line3) – Length/type of MA/Offset(only if MA type is LSM)
MA2(line4) – length/offset/sigma -(remember to set ma in the way that in Uptrend MA2MA1 in DNtrend)
Use faster MA types for short term trends and slower types / bigger periods for longer term trends, defval MA1/2 settings
are pretty much random so using them is not recomended.
CROSSshape(line5) – choose which cross type you want to plot on chart(only in OV=true) or what type you want to use in counting via for loops,
CROSScount(line6) – set lookback for type of cross choosen above
BOOLs in lines 5 and 6 - plotshape if OV=true/plot CROSScount histogram (if OV=false)
Lines 7 and 8 – PRESET we want to use /SRC for calculation of indicator/are conditions described below/which MAs to use/Condition for
reducing value t 0 - (if PRESET is ABSOLUTE or SIMPLE only SRC should be set(Line 8 does not matter if not CUSTOM))
5)SOURCE for CONDS:
Here you can choose between H/L and OHLC. If H/L value grow when MAlow. If OHLC MAOHLC. H/L is set by default and recommended. This can be selected for all presets not only CUSTOM
6)CROSS types LIST:
“1 means MA1, 2 is MA2 and 3 I cross of MA1/MA2. L stands for low and H for high so for example 2H means cross of MA2 and high”
NAME -DEFINITION Number of possible crosses
1L - cross of MA1 and low 1
1H - cross of MA1 and high 1
1HL - cross of MA1 and low or MA1 and high 2 -1L/1H
2L - cross of MA2 and low 1
2H - cross of MA2 and high 1
2HL - cross of MA2 and low or MA1 and high 2 -2L/2H
12L - cross of MA1 and low or MA2 and low 2 -1L/2L
12H - cross of MA1 and high or MA2 and high 2 -1H/2H
12HL - MA1/2 and high/low 4 -1H/1L/2H/2L
3 -cross of MA1 and MA2 1
123HL -crosses from 12HL or 3 5 -12HL/3
1_ULT - cross of MA1 with any of price sources(close,low,high,ohlc4 etc…)
2_ULT - cross of MA2 with any of price sources(close,low,high,ohlc4 etc…)
123_ULT – all crosses possible of MA1/2 (all of the above so a lot)
7)CRS CONDS:
“conditions to reduce value back to zero”
>/< - 0 if indicator shows Uptrend and there’s a cross with high of selected MA or 0 if in DNtrend and cross with low. Better for UP/DN trend detection
ALL – 0 if cross of MA with high or low no matter the trend, better for detecting consolidation
ULT – if any cross of selected MA, most crosses so goes to 0 most often
8)MA selection and CONDS:
-MA1: only MA1 is used,if MA1 below price value grows and the other way around
MA1price =-0.02
-MA2 – only MA2 is used, same conditions as MA1 but using MA2
MA2price =-0.02
-BOTH – MA1 and MA2 used, grows when MA1 if below, grows faster if MA1 and MA2 are below and fastest when MA1 and MA2 are below and MA2price=-0.02
-MA1 and MA2 >price=-0.03
-MA1 and MA2 ?price and MA2>MA1=-0.04
9)CONDITIONS SELECTION SUMMARRY:
So when CUSTOM we choose :
1)SOURCE – H/L or OHLC
2)MAs – MA1/MA2/BOTH
3)CRS CONDS (>/<,ALL,ULT)
So for example...
if we take MA1 and ALL value will go to zero if 1HL
if MA1 and >/< - 0 if 1L or 1H (depending if value is positive or negative).(1L or 1H)
If ALL and BOTH zero when 12HL
If BOTH and ULT value goes back to zero if Theres any cross of MA1/MA2 with price or cross of MA1 and MA2.(123_ULT)
If >/< and BOTH – 0 if 12L in DNtrend or 12H if UPtrend
10) OTHERS
-script was created on EURUSD 5M and wasn't tested on different markets
-default values of MA1/MA2 aren't optimalized so do not
-There might be a logical error in the script so let me know if you find it (most probably in 'BOTH')
-thanks to @AlifeToMake for help
-if you have any ideas to improve let me know
-there are also tooltips to help

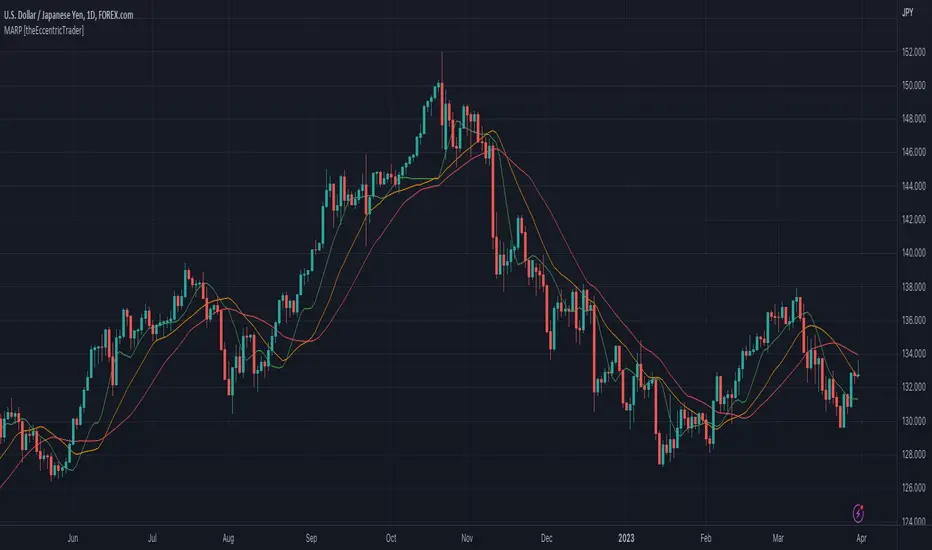
Moving Average Resting Point [theEccentricTrader]█ OVERVIEW
This indicator uses peak and trough prices to calculate the moving average resting point and plots it as a line on the chart. The lookback length is variable and the indicator can plot up to three lines with different lookback lengths and colors.
█ CONCEPTS
Green and Red Candles
• A green candle is one that closes with a high price equal to or above the price it opened.
• A red candle is one that closes with a low price that is lower than the price it opened.
Swing Highs and Swing Lows
• A swing high is a green candle or series of consecutive green candles followed by a single red candle to complete the swing and form the peak.
• A swing low is a red candle or series of consecutive red candles followed by a single green candle to complete the swing and form the trough.
Peak and Trough Prices (Basic)
• The peak price of a complete swing high is the high price of either the red candle that completes the swing high or the high price of the preceding green candle, depending on which is higher.
• The trough price of a complete swing low is the low price of either the green candle that completes the swing low or the low price of the preceding red candle, depending on which is lower.
Historic Peaks and Troughs
The current, or most recent, peak and trough occurrences are referred to as occurrence zero. Previous peak and trough occurrences are referred to as historic and ordered numerically from right to left, with the most recent historic peak and trough occurrences being occurrence one.
Support and Resistance
• Support refers to a price level where the demand for an asset is strong enough to prevent the price from falling further.
• Resistance refers to a price level where the supply of an asset is strong enough to prevent the price from rising further.
Support and resistance levels are important because they can help traders identify where the price of an asset might pause or reverse its direction, offering potential entry and exit points. For example, a trader might look to buy an asset when it approaches a support level , with the expectation that the price will bounce back up. Alternatively, a trader might look to sell an asset when it approaches a resistance level , with the expectation that the price will drop back down.
It's important to note that support and resistance levels are not always relevant, and the price of an asset can also break through these levels and continue moving in the same direction.
Wave Cycles
A wave cycle is here defined as a complete two-part move between a swing high and a swing low, or a swing low and a swing high. As can be seen in the example above, the first swing high or swing low will set the course for the sequence of wave cycles that follow; a chart that begins with a swing low will form its first complete wave cycle upon the formation of the first complete swing high and vice versa.
Wave Length
Wave length is here measured in terms of bar distance between the start and end of a wave cycle. For example, if the current wave cycle ends on a swing low the wave length will be the difference in bars between the current swing low and current swing high. In such a case, if the current swing low completes on candle 100 and the current swing high completed on candle 95, we would simply subtract 95 from 100 to give us a wave length of 5 bars.
Average wave length is here measured in terms of total bars as a proportion as total waves. The average wavelength is calculated by dividing the total candles by the total wave cycles.
Wave Height
Wave height is here measured in terms of current range. For example, if the current peak price is 100 and the current trough price is 80, the wave height will be 20.
Amplitude
Amplitude is here measured in terms of current range divided by two. For example if the current peak price is 100 and the current trough price is 80, the amplitude would be calculated by subtracting 80 from 100 and dividing the answer by 2 to give us an amplitude of 10.
Resting Point
The resting point is here calculated by subtracting the current trough price from the current peak price and adding the difference to the current trough price to output the price in the middle of the two prices. Essentially it is the current trough price plus the amplitude. For example, if the current peak price is 100 and the current trough price is 80, the resting point 90.
The moving average resting point is here calculated by subtracting the moving average trough price from the moving average peak price, dividing the answer by two and adding the difference to the moving average trough price.
Frequency
Frequency is here measured in terms of wave cycles per second (Hertz). For example, if the total wave cycle count is 10 and the amount of time it has taken to complete these 10 cycles is 1-year (31,536,000 seconds), the frequency would be calculated by dividing 10 by 31,536,000 to give us a frequency of 0.00000032 Hz.
Range
The range is simply the difference between the current peak and current trough prices, generally expressed in terms of points or pips.
█ FEATURES
Inputs
Show MARP 1
Show MARP 2
Show MARP 3
MARP 1 Length
MARP 2 Length
MARP 3 Length
MARP 1 Color
MARP 2 Color
MARP 3 Color
█ HOW TO USE
This indicator can be used like any other moving average indicator to analyse trend direction and momentum, identify potential support and resistance levels, or for filtering trading strategies and developing new ones.
Candle Counter [theEccentricTrader]█ OVERVIEW
This indicator counts the number of confirmed candle scenarios on any given candlestick chart and displays the statistics in a table, which can be repositioned and resized at the user's discretion.
█ CONCEPTS
Green and Red Candles
A green candle is one that closes with a high price equal to or above the price it opened.
A red candle is one that closes with a low price that is lower than the price it opened.
Upper Candle Trends
A higher high candle is one that closes with a higher high price than the high price of the preceding candle.
A lower high candle is one that closes with a lower high price than the high price of the preceding candle.
A double-top candle is one that closes with a high price that is equal to the high price of the preceding candle.
Lower Candle Trends
A higher low candle is one that closes with a higher low price than the low price of the preceding candle.
A lower low candle is one that closes with a lower low price than the low price of the preceding candle.
A double-bottom candle is one that closes with a low price that is equal to the low price of the preceding candle.
█ FEATURES
Inputs
Start Date
End Date
Position
Text Size
Show Sample Period
Show Plots
Table
The table is colour coded, consists of three columns and twenty-two rows. Blue cells denote all candle scenarios, green cells denote green candle scenarios and red cells denote red candle scenarios.
The candle scenarios are listed in the first column with their corresponding total counts to the right, in the second column. The last row in column one, row twenty-two, displays the sample period which can be adjusted or hidden via indicator settings.
Rows two and three in the third column of the table display the total green and red candles as percentages of total candles. Rows four to nine in column three, coloured blue, display the corresponding candle scenarios as percentages of total candles. Rows ten to fifteen in column three, coloured green, display the corresponding candle scenarios as percentages of total green candles. And lastly, rows sixteen to twenty-one in column three, coloured red, display the corresponding candle scenarios as percentages of total red candles.
Plots
I have added plots as a visual aid to the various candle scenarios listed in the table. Green up-arrows denote higher high candles when above bar and higher low candles when below bar. Red down-arrows denote lower high candles when above bar and lower low candles when below bar. Similarly, blue diamonds when above bar denote double-top candles and when below bar denote double-bottom candles. These plots can also be hidden via indicator settings.
█ HOW TO USE
This indicator is intended for research purposes and strategy development. I hope it will be useful in helping to gain a better understanding of the underlying dynamics at play on any given market and timeframe. It can, for example, give you an idea of any inherent biases such as a greater proportion of green candles to red. Or a greater proportion of higher low green candles to lower low green candles. Such information can be very useful when conducting top down analysis across multiple timeframes, or considering trailing stop loss methods.
What you do with these statistics and how far you decide to take your research is entirely up to you, the possibilities are endless.
This is just the first and most basic in a series of indicators that can be used to study objective price action scenarios and develop a systematic approach to trading.
█ LIMITATIONS
Some higher timeframe candles on tickers with larger lookbacks such as the DXY, do not actually contain all the open, high, low and close (OHLC) data at the beginning of the chart. Instead, they use the close price for open, high and low prices. So, while we can determine whether the close price is higher or lower than the preceding close price, there is no way of knowing what actually happened intra-bar for these candles. And by default candles that close at the same price as the open price, will be counted as green. You can avoid this problem by utilising the sample period filter.
The green and red candle calculations are based solely on differences between open and close prices, as such I have made no attempt to account for green candles that gap lower and close below the close price of the preceding candle, or red candles that gap higher and close above the close price of the preceding candle. I can only recommend using 24-hour markets, if and where possible, as there are far fewer gaps and, generally, more data to work with. Alternatively, you can replace the scenarios with your own logic to account for the gap anomalies, if you are feeling up to the challenge.
It is also worth noting that the sample size will be limited to your Trading View subscription plan. Premium users get 20,000 candles worth of data, pro+ and pro users get 10,000, and basic users get 5,000. If upgrading is currently not an option, you can always keep a rolling tally of the statistics in an excel spreadsheet or something of the like.

MomentumIndicatorsLibrary "MomentumIndicators"
This is a library of 'Momentum Indicators', also denominated as oscillators.
The purpose of this library is to organize momentum indicators in just one place, making it easy to access.
In addition, it aims to allow customized versions, not being restricted to just the price value.
An example of this use case is the popular Stochastic RSI.
# Indicators:
1. Relative Strength Index (RSI):
Measures the relative strength of recent price gains to recent price losses of an asset.
2. Rate of Change (ROC):
Measures the percentage change in price of an asset over a specified time period.
3. Stochastic Oscillator (Stoch):
Compares the current price of an asset to its price range over a specified time period.
4. True Strength Index (TSI):
Measures the price change, calculating the ratio of the price change (positive or negative) in relation to the
absolute price change.
The values of both are smoothed twice to reduce noise, and the final result is normalized
in a range between 100 and -100.
5. Stochastic Momentum Index (SMI):
Combination of the True Strength Index with a signal line to help identify turning points in the market.
6. Williams Percent Range (Williams %R):
Compares the current price of an asset to its highest high and lowest low over a specified time period.
7. Commodity Channel Index (CCI):
Measures the relationship between an asset's current price and its moving average.
8. Ultimate Oscillator (UO):
Combines three different time periods to help identify possible reversal points.
9. Moving Average Convergence/Divergence (MACD):
Shows the difference between short-term and long-term exponential moving averages.
10. Fisher Transform (FT):
Normalize prices into a Gaussian normal distribution.
11. Inverse Fisher Transform (IFT):
Transform the values of the Fisher Transform into a smaller and more easily interpretable scale is through the
application of an inverse transformation to the hyperbolic tangent function.
This transformation takes the values of the FT, which range from -infinity to +infinity, to a scale limited
between -1 and +1, allowing them to be more easily visualized and compared.
12. Premier Stochastic Oscillator (PSO):
Normalizes the standard stochastic oscillator by applying a five-period double exponential smoothing average of
the %K value, resulting in a symmetric scale of 1 to -1
# Indicators of indicators:
## Stochastic:
1. Stochastic of RSI (Relative Strengh Index)
2. Stochastic of ROC (Rate of Change)
3. Stochastic of UO (Ultimate Oscillator)
4. Stochastic of TSI (True Strengh Index)
5. Stochastic of Williams R%
6. Stochastic of CCI (Commodity Channel Index).
7. Stochastic of MACD (Moving Average Convergence/Divergence)
8. Stochastic of FT (Fisher Transform)
9. Stochastic of Volume
10. Stochastic of MFI (Money Flow Index)
11. Stochastic of On OBV (Balance Volume)
12. Stochastic of PVI (Positive Volume Index)
13. Stochastic of NVI (Negative Volume Index)
14. Stochastic of PVT (Price-Volume Trend)
15. Stochastic of VO (Volume Oscillator)
16. Stochastic of VROC (Volume Rate of Change)
## Inverse Fisher Transform:
1.Inverse Fisher Transform on RSI (Relative Strengh Index)
2.Inverse Fisher Transform on ROC (Rate of Change)
3.Inverse Fisher Transform on UO (Ultimate Oscillator)
4.Inverse Fisher Transform on Stochastic
5.Inverse Fisher Transform on TSI (True Strength Index)
6.Inverse Fisher Transform on CCI (Commodity Channel Index)
7.Inverse Fisher Transform on Fisher Transform (FT)
8.Inverse Fisher Transform on MACD (Moving Average Convergence/Divergence)
9.Inverse Fisher Transfor on Williams R% (Williams Percent Range)
10.Inverse Fisher Transfor on CMF (Chaikin Money Flow)
11.Inverse Fisher Transform on VO (Volume Oscillator)
12.Inverse Fisher Transform on VROC (Volume Rate of Change)
## Stochastic Momentum Index:
1.Stochastic Momentum Index of RSI (Relative Strength Index)
2.Stochastic Momentum Index of ROC (Rate of Change)
3.Stochastic Momentum Index of VROC (Volume Rate of Change)
4.Stochastic Momentum Index of Williams R% (Williams Percent Range)
5.Stochastic Momentum Index of FT (Fisher Transform)
6.Stochastic Momentum Index of CCI (Commodity Channel Index)
7.Stochastic Momentum Index of UO (Ultimate Oscillator)
8.Stochastic Momentum Index of MACD (Moving Average Convergence/Divergence)
9.Stochastic Momentum Index of Volume
10.Stochastic Momentum Index of MFI (Money Flow Index)
11.Stochastic Momentum Index of CMF (Chaikin Money Flow)
12.Stochastic Momentum Index of On Balance Volume (OBV)
13.Stochastic Momentum Index of Price-Volume Trend (PVT)
14.Stochastic Momentum Index of Volume Oscillator (VO)
15.Stochastic Momentum Index of Positive Volume Index (PVI)
16.Stochastic Momentum Index of Negative Volume Index (NVI)
## Relative Strength Index:
1. RSI for Volume
2. RSI for Moving Average
rsi(source, length)
RSI (Relative Strengh Index). Measures the relative strength of recent price gains to recent price losses of an asset.
Parameters:
source : (float) Source of series (close, high, low, etc.)
length : (int) Period of loopback
Returns: (float) Series of RSI
roc(source, length)
ROC (Rate of Change). Measures the percentage change in price of an asset over a specified time period.
Parameters:
source : (float) Source of series (close, high, low, etc.)
length : (int) Period of loopback
Returns: (float) Series of ROC
stoch(kLength, kSmoothing, dSmoothing, maTypeK, maTypeD, almaOffsetKD, almaSigmaKD, lsmaOffSetKD)
Stochastic Oscillator. Compares the current price of an asset to its price range over a specified time period.
Parameters:
kLength
kSmoothing : (int) Period for smoothig stochastic
dSmoothing : (int) Period for signal (moving average of stochastic)
maTypeK : (int) Type of Moving Average for Stochastic Oscillator
maTypeD : (int) Type of Moving Average for Stochastic Oscillator Signal
almaOffsetKD : (float) Offset for Arnaud Legoux Moving Average for Oscillator and Signal
almaSigmaKD : (float) Sigma for Arnaud Legoux Moving Average for Oscillator and Signal
lsmaOffSetKD : (int) Offset for Least Squares Moving Average for Oscillator and Signal
Returns: A tuple of Stochastic Oscillator and Moving Average of Stochastic Oscillator
stoch(source, kLength, kSmoothing, dSmoothing, maTypeK, maTypeD, almaOffsetKD, almaSigmaKD, lsmaOffSetKD)
Stochastic Oscillator. Customized source. Compares the current price of an asset to its price range over a specified time period.
Parameters:
source : (float) Source of series (close, high, low, etc.)
kLength : (int) Period of loopback to calculate the stochastic
kSmoothing : (int) Period for smoothig stochastic
dSmoothing : (int) Period for signal (moving average of stochastic)
maTypeK : (int) Type of Moving Average for Stochastic Oscillator
maTypeD : (int) Type of Moving Average for Stochastic Oscillator Signal
almaOffsetKD : (float) Offset for Arnaud Legoux Moving Average for Stoch and Signal
almaSigmaKD : (float) Sigma for Arnaud Legoux Moving Average for Stoch and Signal
lsmaOffSetKD : (int) Offset for Least Squares Moving Average for Stoch and Signal
Returns: A tuple of Stochastic Oscillator and Moving Average of Stochastic Oscillator
tsi(source, shortLength, longLength, maType, almaOffset, almaSigma, lsmaOffSet)
TSI (True Strengh Index). Measures the price change, calculating the ratio of the price change (positive or negative) in relation to the absolute price change.
The values of both are smoothed twice to reduce noise, and the final result is normalized in a range between 100 and -100.
Parameters:
source : (float) Source of series (close, high, low, etc.)
shortLength : (int) Short length
longLength : (int) Long length
maType : (int) Type of Moving Average for TSI
almaOffset : (float) Offset for Arnaud Legoux Moving Average
almaSigma : (float) Sigma for Arnaud Legoux Moving Average
lsmaOffSet : (int) Offset for Least Squares Moving Average
Returns: (float) TSI
smi(sourceTSI, shortLengthTSI, longLengthTSI, maTypeTSI, almaOffsetTSI, almaSigmaTSI, lsmaOffSetTSI, maTypeSignal, smoothingLengthSignal, almaOffsetSignal, almaSigmaSignal, lsmaOffSetSignal)
SMI (Stochastic Momentum Index). A TSI (True Strengh Index) plus a signal line.
Parameters:
sourceTSI : (float) Source of series for TSI (close, high, low, etc.)
shortLengthTSI : (int) Short length for TSI
longLengthTSI : (int) Long length for TSI
maTypeTSI : (int) Type of Moving Average for Signal of TSI
almaOffsetTSI : (float) Offset for Arnaud Legoux Moving Average
almaSigmaTSI : (float) Sigma for Arnaud Legoux Moving Average
lsmaOffSetTSI : (int) Offset for Least Squares Moving Average
maTypeSignal
smoothingLengthSignal
almaOffsetSignal
almaSigmaSignal
lsmaOffSetSignal
Returns: A tuple with TSI, signal of TSI and histogram of difference
wpr(source, length)
Williams R% (Williams Percent Range). Compares the current price of an asset to its highest high and lowest low over a specified time period.
Parameters:
source : (float) Source of series (close, high, low, etc.)
length : (int) Period of loopback
Returns: (float) Series of Williams R%
cci(source, length, maType, almaOffset, almaSigma, lsmaOffSet)
CCI (Commodity Channel Index). Measures the relationship between an asset's current price and its moving average.
Parameters:
source : (float) Source of series (close, high, low, etc.)
length : (int) Period of loopback
maType : (int) Type of Moving Average
almaOffset : (float) Offset for Arnaud Legoux Moving Average
almaSigma : (float) Sigma for Arnaud Legoux Moving Average
lsmaOffSet : (int) Offset for Least Squares Moving Average
Returns: (float) Series of CCI
ultimateOscillator(fastLength, middleLength, slowLength)
UO (Ultimate Oscilator). Combines three different time periods to help identify possible reversal points.
Parameters:
fastLength : (int) Fast period of loopback
middleLength : (int) Middle period of loopback
slowLength : (int) Slow period of loopback
Returns: (float) Series of Ultimate Oscilator
ultimateOscillator(source, fastLength, middleLength, slowLength)
UO (Ultimate Oscilator). Customized source. Combines three different time periods to help identify possible reversal points.
Parameters:
source : (float) Source of series (close, high, low, etc.)
fastLength : (int) Fast period of loopback
middleLength : (int) Middle period of loopback
slowLength : (int) Slow period of loopback
Returns: (float) Series of Ultimate Oscilator
macd(source, fastLength, slowLength, signalLength, maTypeFast, maTypeSlow, maTypeMACD, almaOffset, almaSigma, lsmaOffSet)
MACD (Moving Average Convergence/Divergence). Shows the difference between short-term and long-term exponential moving averages.
Parameters:
source : (float) Source of series (close, high, low, etc.)
fastLength : (int) Period for fast moving average
slowLength : (int) Period for slow moving average
signalLength : (int) Signal length
maTypeFast : (int) Type of fast moving average
maTypeSlow : (int) Type of slow moving average
maTypeMACD : (int) Type of MACD moving average
almaOffset : (float) Offset for Arnaud Legoux Moving Average
almaSigma : (float) Sigma for Arnaud Legoux Moving Average
lsmaOffSet : (int) Offset for Least Squares Moving Average
Returns: A tuple with MACD, Signal, and Histgram
fisher(length)
Fisher Transform. Normalize prices into a Gaussian normal distribution.
Parameters:
length
Returns: A tuple with Fisher Transform and signal
fisher(source, length)
Fisher Transform. Customized source. Normalize prices into a Gaussian normal distribution.
Parameters:
source : (float) Source of series (close, high, low, etc.)
length
Returns: A tuple with Fisher Transform and signal
inverseFisher(source, length, subtrahend, denominator)
Inverse Fisher Transform.
Transform the values of the Fisher Transform into a smaller and more easily interpretable scale is
through the application of an inverse transformation to the hyperbolic tangent function.
This transformation takes the values of the FT, which range from -infinity to +infinity,
to a scale limited between -1 and +1, allowing them to be more easily visualized and compared.
Parameters:
source : (float) Source of series (close, high, low, etc.)
length : (int) Period for loopback
subtrahend : (int) Denominator. Useful in unbounded indicators. For example, in CCI.
denominator
Returns: (float) Series of Inverse Fisher Transform
premierStoch(length, smoothlen)
Premier Stochastic Oscillator (PSO).
Normalizes the standard stochastic oscillator by applying a five-period double exponential smoothing
average of the %K value, resulting in a symmetric scale of 1 to -1.
Parameters:
length : (int) Period for loopback
smoothlen : (int) Period for smoothing
Returns: (float) Series of PSO
premierStoch(source, smoothlen, subtrahend, denominator)
Premier Stochastic Oscillator (PSO) of custom source.
Normalizes the source by applying a five-period double exponential smoothing average.
Parameters:
source : (float) Source of series (close, high, low, etc.)
smoothlen : (int) Period for smoothing
subtrahend : (int) Denominator. Useful in unbounded indicators. For example, in CCI.
denominator
Returns: (float) Series of PSO
stochRsi(sourceRSI, lengthRSI, kLength, kSmoothing, dSmoothing, maTypeK, maTypeD, almaOffsetKD, almaSigmaKD, lsmaOffSetKD)
Parameters:
sourceRSI
lengthRSI
kLength
kSmoothing
dSmoothing
maTypeK
maTypeD
almaOffsetKD
almaSigmaKD
lsmaOffSetKD
stochRoc(sourceROC, lengthROC, kLength, kSmoothing, dSmoothing, maTypeK, maTypeD, almaOffsetKD, almaSigmaKD, lsmaOffSetKD)
Parameters:
sourceROC
lengthROC
kLength
kSmoothing
dSmoothing
maTypeK
maTypeD
almaOffsetKD
almaSigmaKD
lsmaOffSetKD
stochUO(fastLength, middleLength, slowLength, kLength, kSmoothing, dSmoothing, maTypeK, maTypeD, almaOffsetKD, almaSigmaKD, lsmaOffSetKD)
Parameters:
fastLength
middleLength
slowLength
kLength
kSmoothing
dSmoothing
maTypeK
maTypeD
almaOffsetKD
almaSigmaKD
lsmaOffSetKD
stochTSI(source, shortLength, longLength, maType, almaOffset, almaSigma, lsmaOffSet, kLength, kSmoothing, dSmoothing, maTypeK, maTypeD, almaOffsetKD, almaSigmaKD, lsmaOffSetKD)
Parameters:
source
shortLength
longLength
maType
almaOffset
almaSigma
lsmaOffSet
kLength
kSmoothing
dSmoothing
maTypeK
maTypeD
almaOffsetKD
almaSigmaKD
lsmaOffSetKD
stochWPR(source, length, kLength, kSmoothing, dSmoothing, maTypeK, maTypeD, almaOffsetKD, almaSigmaKD, lsmaOffSetKD)
Parameters:
source
length
kLength
kSmoothing
dSmoothing
maTypeK
maTypeD
almaOffsetKD
almaSigmaKD
lsmaOffSetKD
stochCCI(source, length, maType, almaOffset, almaSigma, lsmaOffSet, kLength, kSmoothing, dSmoothing, maTypeK, maTypeD, almaOffsetKD, almaSigmaKD, lsmaOffSetKD)
Parameters:
source
length
maType
almaOffset
almaSigma
lsmaOffSet
kLength
kSmoothing
dSmoothing
maTypeK
maTypeD
almaOffsetKD
almaSigmaKD
lsmaOffSetKD
stochMACD(source, fastLength, slowLength, signalLength, maTypeFast, maTypeSlow, maTypeMACD, almaOffset, almaSigma, lsmaOffSet, kLength, kSmoothing, dSmoothing, maTypeK, maTypeD, almaOffsetKD, almaSigmaKD, lsmaOffSetKD)
Parameters:
source
fastLength
slowLength
signalLength
maTypeFast
maTypeSlow
maTypeMACD
almaOffset
almaSigma
lsmaOffSet
kLength
kSmoothing
dSmoothing
maTypeK
maTypeD
almaOffsetKD
almaSigmaKD
lsmaOffSetKD
stochFT(length, kLength, kSmoothing, dSmoothing, maTypeK, maTypeD, almaOffsetKD, almaSigmaKD, lsmaOffSetKD)
Parameters:
length
kLength
kSmoothing
dSmoothing
maTypeK
maTypeD
almaOffsetKD
almaSigmaKD
lsmaOffSetKD
stochVolume(kLength, kSmoothing, dSmoothing, maTypeK, maTypeD, almaOffsetKD, almaSigmaKD, lsmaOffSetKD)
Parameters:
kLength
kSmoothing
dSmoothing
maTypeK
maTypeD
almaOffsetKD
almaSigmaKD
lsmaOffSetKD
stochMFI(source, length, kLength, kSmoothing, dSmoothing, maTypeK, maTypeD, almaOffsetKD, almaSigmaKD, lsmaOffSetKD)
Parameters:
source
length
kLength
kSmoothing
dSmoothing
maTypeK
maTypeD
almaOffsetKD
almaSigmaKD
lsmaOffSetKD
stochOBV(source, kLength, kSmoothing, dSmoothing, maTypeK, maTypeD, almaOffsetKD, almaSigmaKD, lsmaOffSetKD)
Parameters:
source
kLength
kSmoothing
dSmoothing
maTypeK
maTypeD
almaOffsetKD
almaSigmaKD
lsmaOffSetKD
stochPVI(source, kLength, kSmoothing, dSmoothing, maTypeK, maTypeD, almaOffsetKD, almaSigmaKD, lsmaOffSetKD)
Parameters:
source
kLength
kSmoothing
dSmoothing
maTypeK
maTypeD
almaOffsetKD
almaSigmaKD
lsmaOffSetKD
stochNVI(source, kLength, kSmoothing, dSmoothing, maTypeK, maTypeD, almaOffsetKD, almaSigmaKD, lsmaOffSetKD)
Parameters:
source
kLength
kSmoothing
dSmoothing
maTypeK
maTypeD
almaOffsetKD
almaSigmaKD
lsmaOffSetKD
stochPVT(source, kLength, kSmoothing, dSmoothing, maTypeK, maTypeD, almaOffsetKD, almaSigmaKD, lsmaOffSetKD)
Parameters:
source
kLength
kSmoothing
dSmoothing
maTypeK
maTypeD
almaOffsetKD
almaSigmaKD
lsmaOffSetKD
stochVO(shortLen, longLen, maType, almaOffset, almaSigma, lsmaOffSet, kLength, kSmoothing, dSmoothing, maTypeK, maTypeD, almaOffsetKD, almaSigmaKD, lsmaOffSetKD)
Parameters:
shortLen
longLen
maType
almaOffset
almaSigma
lsmaOffSet
kLength
kSmoothing
dSmoothing
maTypeK
maTypeD
almaOffsetKD
almaSigmaKD
lsmaOffSetKD
stochVROC(length, kLength, kSmoothing, dSmoothing, maTypeK, maTypeD, almaOffsetKD, almaSigmaKD, lsmaOffSetKD)
Parameters:
length
kLength
kSmoothing
dSmoothing
maTypeK
maTypeD
almaOffsetKD
almaSigmaKD
lsmaOffSetKD
iftRSI(sourceRSI, lengthRSI, lengthIFT)
Parameters:
sourceRSI
lengthRSI
lengthIFT
iftROC(sourceROC, lengthROC, lengthIFT)
Parameters:
sourceROC
lengthROC
lengthIFT
iftUO(fastLength, middleLength, slowLength, lengthIFT)
Parameters:
fastLength
middleLength
slowLength
lengthIFT
iftStoch(kLength, kSmoothing, dSmoothing, maTypeK, maTypeD, almaOffsetKD, almaSigmaKD, lsmaOffSetKD, lengthIFT)
Parameters:
kLength
kSmoothing
dSmoothing
maTypeK
maTypeD
almaOffsetKD
almaSigmaKD
lsmaOffSetKD
lengthIFT
iftTSI(source, shortLength, longLength, maType, almaOffset, almaSigma, lsmaOffSet, lengthIFT)
Parameters:
source
shortLength
longLength
maType
almaOffset
almaSigma
lsmaOffSet
lengthIFT
iftCCI(source, length, maType, almaOffset, almaSigma, lsmaOffSet, lengthIFT)
Parameters:
source
length
maType
almaOffset
almaSigma
lsmaOffSet
lengthIFT
iftFisher(length, lengthIFT)
Parameters:
length
lengthIFT
iftMACD(source, fastLength, slowLength, signalLength, maTypeFast, maTypeSlow, maTypeMACD, almaOffset, almaSigma, lsmaOffSet, lengthIFT)
Parameters:
source
fastLength
slowLength
signalLength
maTypeFast
maTypeSlow
maTypeMACD
almaOffset
almaSigma
lsmaOffSet
lengthIFT
iftWPR(source, length, lengthIFT)
Parameters:
source
length
lengthIFT
iftMFI(source, length, lengthIFT)
Parameters:
source
length
lengthIFT
iftCMF(length, lengthIFT)
Parameters:
length
lengthIFT
iftVO(shortLen, longLen, maType, almaOffset, almaSigma, lsmaOffSet, lengthIFT)
Parameters:
shortLen
longLen
maType
almaOffset
almaSigma
lsmaOffSet
lengthIFT
iftVROC(length, lengthIFT)
Parameters:
length
lengthIFT
smiRSI(source, length, shortLengthTSI, longLengthTSI, maTypeTSI, almaOffsetTSI, almaSigmaTSI, lsmaOffSetTSI, maTypeSignal, smoothingLengthSignal, almaOffsetSignal, almaSigmaSignal, lsmaOffSetSignal)
Parameters:
source
length
shortLengthTSI
longLengthTSI
maTypeTSI
almaOffsetTSI
almaSigmaTSI
lsmaOffSetTSI
maTypeSignal
smoothingLengthSignal
almaOffsetSignal
almaSigmaSignal
lsmaOffSetSignal
smiROC(source, length, shortLengthTSI, longLengthTSI, maTypeTSI, almaOffsetTSI, almaSigmaTSI, lsmaOffSetTSI, maTypeSignal, smoothingLengthSignal, almaOffsetSignal, almaSigmaSignal, lsmaOffSetSignal)
Parameters:
source
length
shortLengthTSI
longLengthTSI
maTypeTSI
almaOffsetTSI
almaSigmaTSI
lsmaOffSetTSI
maTypeSignal
smoothingLengthSignal
almaOffsetSignal
almaSigmaSignal
lsmaOffSetSignal
smiVROC(length, shortLengthTSI, longLengthTSI, maTypeTSI, almaOffsetTSI, almaSigmaTSI, lsmaOffSetTSI, maTypeSignal, smoothingLengthSignal, almaOffsetSignal, almaSigmaSignal, lsmaOffSetSignal)
Parameters:
length
shortLengthTSI
longLengthTSI
maTypeTSI
almaOffsetTSI
almaSigmaTSI
lsmaOffSetTSI
maTypeSignal
smoothingLengthSignal
almaOffsetSignal
almaSigmaSignal
lsmaOffSetSignal
smiWPR(source, length, shortLengthTSI, longLengthTSI, maTypeTSI, almaOffsetTSI, almaSigmaTSI, lsmaOffSetTSI, maTypeSignal, smoothingLengthSignal, almaOffsetSignal, almaSigmaSignal, lsmaOffSetSignal)
Parameters:
source
length
shortLengthTSI
longLengthTSI
maTypeTSI
almaOffsetTSI
almaSigmaTSI
lsmaOffSetTSI
maTypeSignal
smoothingLengthSignal
almaOffsetSignal
almaSigmaSignal
lsmaOffSetSignal
smiFT(length, shortLengthTSI, longLengthTSI, maTypeTSI, almaOffsetTSI, almaSigmaTSI, lsmaOffSetTSI, maTypeSignal, smoothingLengthSignal, almaOffsetSignal, almaSigmaSignal, lsmaOffSetSignal)
Parameters:
length
shortLengthTSI
longLengthTSI
maTypeTSI
almaOffsetTSI
almaSigmaTSI
lsmaOffSetTSI
maTypeSignal
smoothingLengthSignal
almaOffsetSignal
almaSigmaSignal
lsmaOffSetSignal
smiFT(source, length, shortLengthTSI, longLengthTSI, maTypeTSI, almaOffsetTSI, almaSigmaTSI, lsmaOffSetTSI, maTypeSignal, smoothingLengthSignal, almaOffsetSignal, almaSigmaSignal, lsmaOffSetSignal)
Parameters:
source
length
shortLengthTSI
longLengthTSI
maTypeTSI
almaOffsetTSI
almaSigmaTSI
lsmaOffSetTSI
maTypeSignal
smoothingLengthSignal
almaOffsetSignal
almaSigmaSignal
lsmaOffSetSignal
smiCCI(source, length, maTypeCCI, almaOffsetCCI, almaSigmaCCI, lsmaOffSetCCI, shortLengthTSI, longLengthTSI, maTypeTSI, almaOffsetTSI, almaSigmaTSI, lsmaOffSetTSI, maTypeSignal, smoothingLengthSignal, almaOffsetSignal, almaSigmaSignal, lsmaOffSetSignal)
Parameters:
source
length
maTypeCCI
almaOffsetCCI
almaSigmaCCI
lsmaOffSetCCI
shortLengthTSI
longLengthTSI
maTypeTSI
almaOffsetTSI
almaSigmaTSI
lsmaOffSetTSI
maTypeSignal
smoothingLengthSignal
almaOffsetSignal
almaSigmaSignal
lsmaOffSetSignal
smiUO(fastLength, middleLength, slowLength, shortLengthTSI, longLengthTSI, maTypeTSI, almaOffsetTSI, almaSigmaTSI, lsmaOffSetTSI, maTypeSignal, smoothingLengthSignal, almaOffsetSignal, almaSigmaSignal, lsmaOffSetSignal)
Parameters:
fastLength
middleLength
slowLength
shortLengthTSI
longLengthTSI
maTypeTSI
almaOffsetTSI
almaSigmaTSI
lsmaOffSetTSI
maTypeSignal
smoothingLengthSignal
almaOffsetSignal
almaSigmaSignal
lsmaOffSetSignal
smiMACD(source, fastLength, slowLength, signalLength, maTypeFast, maTypeSlow, maTypeMACD, almaOffset, almaSigma, lsmaOffSet, shortLengthTSI, longLengthTSI, maTypeTSI, almaOffsetTSI, almaSigmaTSI, lsmaOffSetTSI, maTypeSignal, smoothingLengthSignal, almaOffsetSignal, almaSigmaSignal, lsmaOffSetSignal)
Parameters:
source
fastLength
slowLength
signalLength
maTypeFast
maTypeSlow
maTypeMACD
almaOffset
almaSigma
lsmaOffSet
shortLengthTSI
longLengthTSI
maTypeTSI
almaOffsetTSI
almaSigmaTSI
lsmaOffSetTSI
maTypeSignal
smoothingLengthSignal
almaOffsetSignal
almaSigmaSignal
lsmaOffSetSignal
smiVol(shortLengthTSI, longLengthTSI, maTypeTSI, almaOffsetTSI, almaSigmaTSI, lsmaOffSetTSI, maTypeSignal, smoothingLengthSignal, almaOffsetSignal, almaSigmaSignal, lsmaOffSetSignal)
Parameters:
shortLengthTSI
longLengthTSI
maTypeTSI
almaOffsetTSI
almaSigmaTSI
lsmaOffSetTSI
maTypeSignal
smoothingLengthSignal
almaOffsetSignal
almaSigmaSignal
lsmaOffSetSignal
smiMFI(source, length, shortLengthTSI, longLengthTSI, maTypeTSI, almaOffsetTSI, almaSigmaTSI, lsmaOffSetTSI, maTypeSignal, smoothingLengthSignal, almaOffsetSignal, almaSigmaSignal, lsmaOffSetSignal)
Parameters:
source
length
shortLengthTSI
longLengthTSI
maTypeTSI
almaOffsetTSI
almaSigmaTSI
lsmaOffSetTSI
maTypeSignal
smoothingLengthSignal
almaOffsetSignal
almaSigmaSignal
lsmaOffSetSignal
smiCMF(length, shortLengthTSI, longLengthTSI, maTypeTSI, almaOffsetTSI, almaSigmaTSI, lsmaOffSetTSI, maTypeSignal, smoothingLengthSignal, almaOffsetSignal, almaSigmaSignal, lsmaOffSetSignal)
Parameters:
length
shortLengthTSI
longLengthTSI
maTypeTSI
almaOffsetTSI
almaSigmaTSI
lsmaOffSetTSI
maTypeSignal
smoothingLengthSignal
almaOffsetSignal
almaSigmaSignal
lsmaOffSetSignal
smiOBV(source, shortLengthTSI, longLengthTSI, maTypeTSI, almaOffsetTSI, almaSigmaTSI, lsmaOffSetTSI, maTypeSignal, smoothingLengthSignal, almaOffsetSignal, almaSigmaSignal, lsmaOffSetSignal)
Parameters:
source
shortLengthTSI
longLengthTSI
maTypeTSI
almaOffsetTSI
almaSigmaTSI
lsmaOffSetTSI
maTypeSignal
smoothingLengthSignal
almaOffsetSignal
almaSigmaSignal
lsmaOffSetSignal
smiPVT(source, shortLengthTSI, longLengthTSI, maTypeTSI, almaOffsetTSI, almaSigmaTSI, lsmaOffSetTSI, maTypeSignal, smoothingLengthSignal, almaOffsetSignal, almaSigmaSignal, lsmaOffSetSignal)
Parameters:
source
shortLengthTSI
longLengthTSI
maTypeTSI
almaOffsetTSI
almaSigmaTSI
lsmaOffSetTSI
maTypeSignal
smoothingLengthSignal
almaOffsetSignal
almaSigmaSignal
lsmaOffSetSignal
smiVO(shortLen, longLen, maType, almaOffset, almaSigma, lsmaOffSet, shortLengthTSI, longLengthTSI, maTypeTSI, almaOffsetTSI, almaSigmaTSI, lsmaOffSetTSI, maTypeSignal, smoothingLengthSignal, almaOffsetSignal, almaSigmaSignal, lsmaOffSetSignal)
Parameters:
shortLen
longLen
maType
almaOffset
almaSigma
lsmaOffSet
shortLengthTSI
longLengthTSI
maTypeTSI
almaOffsetTSI
almaSigmaTSI
lsmaOffSetTSI
maTypeSignal
smoothingLengthSignal
almaOffsetSignal
almaSigmaSignal
lsmaOffSetSignal
smiPVI(source, shortLengthTSI, longLengthTSI, maTypeTSI, almaOffsetTSI, almaSigmaTSI, lsmaOffSetTSI, maTypeSignal, smoothingLengthSignal, almaOffsetSignal, almaSigmaSignal, lsmaOffSetSignal)
Parameters:
source
shortLengthTSI
longLengthTSI
maTypeTSI
almaOffsetTSI
almaSigmaTSI
lsmaOffSetTSI
maTypeSignal
smoothingLengthSignal
almaOffsetSignal
almaSigmaSignal
lsmaOffSetSignal
smiNVI(source, shortLengthTSI, longLengthTSI, maTypeTSI, almaOffsetTSI, almaSigmaTSI, lsmaOffSetTSI, maTypeSignal, smoothingLengthSignal, almaOffsetSignal, almaSigmaSignal, lsmaOffSetSignal)
Parameters:
source
shortLengthTSI
longLengthTSI
maTypeTSI
almaOffsetTSI
almaSigmaTSI
lsmaOffSetTSI
maTypeSignal
smoothingLengthSignal
almaOffsetSignal
almaSigmaSignal
lsmaOffSetSignal
rsiVolume(length)
Parameters:
length
rsiMA(sourceMA, lengthMA, maType, almaOffset, almaSigma, lsmaOffSet, lengthRSI)
Parameters:
sourceMA
lengthMA
maType
almaOffset
almaSigma
lsmaOffSet
lengthRSI

TRADING MADE SIMPLEThis indicator shows market structure. The standard method of using Williams Highs and Lows as pivots, is something of an approximation.
What's original here is that we follow rules to confirm Local Highs and Local Lows, and strictly enforce that a Low can only follow a confirmed High and vice-versa.
-- Highs and Lows
To confirm a candle as a Local High, you need a later candle to Close below its Low. To confirm a Local Low, you need a Close above its High.
A Low can only follow a High (after it's been confirmed). You can't go e.g High, High, Low, Low, only High, Low, High, Low.
When price makes Higher Highs and Higher Lows, market structure is said to be bullish. When price makes Lower Lows and Lower Highs, it's bearish.
I've defined the in-between Highs and Lows as "Ranging", meaning, neutral. They could be trend continuation or reversal.
-- Bullish/Bearish Breaks
A Bullish break in market structure is when the Close of the current candle goes higher than the previous confirmed Local High.
A Bearish Break is when the Close of the current candle goes lower than the most recent confirmed Local Low.
I chose to use Close rather than High to reduce edge case weirdness. The breaking candle often ends up being a big one, thus the close of that candle can be a poor entry.
You can get live warnings by setting the alert to Options: Only Once, because during a candle, the current price is taken as the Close.
Breaks are like early warnings of a change in market bias, because you're not waiting for a High or Low to be formed and confirmed.
Buy The Dip / Sell The Rally
Buy The Dip is a label I gave to the first Higher Low in a bullish market structure. Sell The Rally is the first Lower High in a bearish market structure.
These *might* be good buying/selling opportunities, but you still need to do your own analysis to confirm that.
== USAGE ==
The point of knowing market structure is so you don't make bullish bets in a bearish market and vice versa -
or if you do at least you're aware that that's what you're doing, and hopefully have some overwhelmingly good reason to do so.
These are not signals to be traded on their own. You still need a trade thesis. Use with support & resistance and your other favourite indicators.
Works on any market on any timeframe. Be aware that market structure will be different on different timeframes.
IMPORTANT: If you're not seeing what you expect, check your settings and re-read this entire description carefully. Confirming Highs and Lows can get deceptively complex.

Bollinger Band Width PercentileIntroducing the Bollinger Band Width Percentile
Definitions :
Bollinger Band Width Percentile is derived from the Bollinger Band Width indicator.
It shows the percentage of bars over a specified lookback period that the Bollinger Band Width was less than the current Bollinger Band Width.
Bollinger Band Width is derived from the Bollinger Bands® indicator.
It quantitatively measures the width between the Upper and Lower Bands of the Bollinger Bands.
Bollinger Bands® is a volatility-based indicator.
It consists of three lines which are plotted in relation to a security's price.
The Middle Line is typically a Simple Moving Average.
The Upper and Lower Bands are typically 2 standard deviations above, and below the SMA (Middle Line).
Volatility is a statistical measure of the dispersion of returns for a given security or market index, measured by the standard deviation of logarithmic returns.
The Broad Concept :
Quoting Tradingview specifically for commonly noted limitations of the BBW indicator which I have based this indicator on....
“ Bollinger Bands Width (BBW) outputs a Percentage Difference between the Upper Band and the Lower Band.
This value is used to define the narrowness of the bands.
What needs to be understood however is that a trader cannot simply look at the BBW value and determine if the Band is truly narrow or not.
The significance of an instruments relative narrowness changes depending on the instrument or security in question.
What is considered narrow for one security may not be for another.
What is considered narrow for one security may even change within the scope of the same security depending on the timeframe.
In order to accurately gauge the significance of a narrowing of the bands, a technical analyst will need to research past BBW fluctuations and price performance to increase trading accuracy. ”
Here I present the Bollinger Band Width Percentile as a refinement of the BBW to somewhat overcome the limitations cited above.
Much of the work researching past BBW fluctuations, and making relative comparisons is done naturally by calculating the Bollinger Band Width Percentile.
This calculation also means that it can be read in a similar fashion across assets, greatly simplifying the interpretation of it.
Plotted Components of the Bollinger Band Width Percentile indicator :
Scale High
Mid Line
Scale Low
BBWP plot
Moving Average 1
Moving Average 2
Extreme High Alert
Extreme Low Alert
Bollinger Band Width Percentile Properties:
BBWP Length
The time period to be used in calculating the Moving average which creates the Basis for the BBW component of the BBWP.
Basis Type
The type of moving average to be used as the Basis for the BBW component of the BBWP.
BBWP Lookback
The lookback period to be used in calculating the BBWP itself.
BBWP Plot settings
The BBWP plot settings give a choice between a user defined solid color, and a choice of "Blue Green Red", or "Blue Red" spectrum palettes.
Moving Averages
Has 2 Optional User definable and adjustable moving averages of the BBWP.
Visual Alerts
Optional User adjustable High and low Signal columns.
How to read the BBWP :
A BBWP read of 95 % ... means that the current BBW level is greater than 95% of the lookback period.
A BBWP read of 5 % .... means that the current BBW level is lower than 95% of the lookback period.
Proposed interpretations :
When the BBWP gets above 90 % and particularly when it hits 100% ... this can be a signal that volatility is reaching a maximum and that a macro High or Low is about to be set.
When the BBWP gets below 10 % and particularly when it hits 0% ...... this can be a signal that volatility is reaching a minimum and that there could be a violent range breakout into a trending move.
When the BBWP hits a low level < 5 % and then gets above its moving average ...... this can be an early signal that a consolidation phase is ending and a trending move is beginning.
When the BBWP hits a high level > 95 % and then falls below its moving average ... this can be an early signal that a trending move is ending and a consolidation phase is beginning.
Essential knowledge :
The BBWP was designed with the daily timeframe in mind, but technical analysists may find use for it on other time frames also.
High and Low BBWP readings do not entail any direction bias.
Deeper Concepts :
In finance, “mean reversion” is the assumption that a financial instrument's price will tend to move towards the average price over time.
If we apply that same logic to volatility as represented here by the Bollinger band width percentile, the assumption is that the Bollinger band width percentile will tend to contract from extreme highs, and expand from extreme lows over time corresponding to repeated phases of contraction and expansion of volatility.
It is clear that for most assets there are periods of directional trending behavior followed by periods of “consolidation” ( trading sideways in a range ).
This often ends with a tightening range under reducing volume and volatility ( popularly known as “the squeeze” ).
The squeeze typically ends with a “breakout” from the range characterized by a rapid increase in volume, and volatility when price action again trends directionally, and the cycle repeats.
Typical Use Cases :
The Bollinger Band Width Percentile may be especially useful for Options traders, as it can provide a bias for when Options are relatively expensive, or inexpensive from a Volatility (Vega) perspective.
When the Bollinger Band Width Percentile is relatively high ( 85 percentile or above ) it may be more advantageous to be a net seller of Vega.
When the Bollinger Band Width Percentile is relatively low ( 15 percentile or below ) it may be advantageous to be net long Vega.
Here we examine a number of actionable signals on BTCUSD daily timeframe using the BBWP and a momentum oscillator ( using the TSI here but can equally be used with Bollinger bands, moving averages, or the traders preferred momentum oscillator ).
In this first case we will examine how a spot trader and an options trader could each use a low BBWP read to alert them to a good potential trade setup.
note: using a period of 30 for both the Bollinger bands and the BBWP period ( approximately a month ) and a BBWP lookback of 350 ( approximately a year )
As we see the Bollinger Bands have gradually contracted while price action trended down and the BBWP also fell consistently while below its moving average ( denoting falling volatility ) down to an extremely low level <5% until it broke above its moving average along with a break of range to the upside ( signaling the end of the consolidation at a low level and the beginning of a new trending move to the upside with expanding volatility).
In this next case we will continue to follow the price action presuming that the traders have taken or locked in profit at reasonable take profit levels from the previous trade setup.
Here we see the contraction of the Bollinger bands, and the BBWP alongside price action breaking below the BB Basis giving a warning that the trending move to the upside is likely over.
We then see the BBWP rising and getting above its moving average while price action fails to get above the BB Basis, likewise the TSI fails to get above its signal line and actually crosses below its zeroline.
The trader would normally take this as a signal that the next trending move could be to the downside.
The next trending move turns out to be a dramatic downside move which causes the BBWP to hit 100% signaling that volatility is likely to hit a maximum giving good opportunities for profitable trades to the skilled trader as outlined.
Limitations :
Here we will look at 2 cases where blindly taking BBWP signals could cause the trader to take a failed trade.
In this first example we will look at blindly taking a low volatility options trade
Low Volatility and corresponding low BBWP levels do not automatically mean there has to be expansion immediately, these periods of extreme low volatility can go on for quite some time.
In this second example we will look at blindly taking a high volatility spot short trade
High volatility and corresponding high BBWP levels do not automatically mean there has to be a macro high and contraction of volatility immediately, these periods of extreme high volatility can also go on for quite some time, hence the famous saying "The trend is your friend until the end of the trend" and lesser well known, but equally valid saying "never try to short the top of a parabolic blow off top"
Markets are variable and past performance is no guarantee of future results, this is not financial advice, I am not a financial advisor.
Final thoughts
The BBWP is an improvement over the BBW in my opinion, and is a novel, and useful addition to a Technical Analysts toolkit.
It is not a standalone indicator and is meant to be used in conjunction with other tools for direction bias, and Good Risk Management to base sound trades off.
John Bollinger has suggested using Bolliger bands, and its related indicators with two or three other non-correlated indicators that provide more direct market signals.
He believes it is crucial to use indicators based on different types of data.
Some of his favored technical techniques are moving average divergence/convergence (MACD), on-balance volume and relative strength index (RSI).
Thanks
Massive respect to John Bollinger, long-time technician of the markets, and legendary creator of both the Bollinger Bands® in the 1980´s, and the Bollinger band Width indicator in 2010 which this indicator is based on.
His work continues to inspire, decades after he brought the original Bollinger Bands to the market.
Much respect also to Eric Crown who gave me the fundamental knowledge of Technical Analysis, and Options trading.

Ichimoku Kinkō HyōThe Ichimoku Kinko Hyo is an trading system developed by the late Goichi Hosoda (pen name "Ichimokusanjin") when he was the general manager of the business conditions department of Miyako Shinbun, the predecessor of the Tokyo Shimbun. Currently, it is a registered trademark of Economic Fluctuation Research Institute Co., Ltd., which is run by the bereaved family of Hosoda as a private research institute.
The Ichimoku Kinko Hyo is composed of time theory, price range theory (target price theory) and wave movement theory. Ichimoku means "At One Glace". The equilibrium table is famous for its span, but the first in the equilibrium table is the time relationship.
In the theory of time, the change date is the day after the number of periods classified into the basic numerical value such as 9, 17, 26, etc., the equal numerical value that takes the number of periods of the past wave motion, and the habit numerical value that appears for each issue is there. The market is based on the idea that the buying and selling equilibrium will move in the wrong direction. Another feature is that time is emphasized in order to estimate when changes will occur.
In the price range theory, there are E・V・N・NT calculated values and multiple values of 4 to 8E as target values. In addition, in order to determine the momentum and direction of the market, we will consider other price ranges and ying and yang numbers.
If the calculated value is realized on the change date calculated by each numerical value, the market price is likely to reverse.
転換線 (Tenkansen) (Conversion Line) = (highest price in the past 9 periods + lowest price) ÷ 2
基準線 (Kijunsen) (Base Line) = (highest price in the past 26 periods + lowest price) ÷ 2
It represents Support/Resistance for 16 bars. It is a 50% Fibonacci Retracement. The Kijun sen is knows as the "container" of the trend. It is prefect to use as an initial stop and/or trailing stop.
先行スパン1 (Senkou span 1) (Lagging Span 1) = {(conversion value + reference value) ÷ 2} 25 periods ahead (26 periods ahead including the current day, that is)
先行スパン2 (Senkou span 2) (Lagging Span 2) = {(highest price in the past 52 periods + lowest price) ÷ 2} 25 periods ahead (26 periods ahead including the current day, that is)
遅行スパン (Chikou span) (Lagging Span) = (current candle closing price) plotted 26 periods before (that is, including the current day) 25 periods ago
It is the only Ichimoku indicator that uses the closing price. It is used for momentum of the trend.
The area surrounded by the two lagging span lines is called a cloud. This is the foundation of the system. It determines the sentiment (Bull/Bear) for the insrument. If price is above the cloud, the instrument is bullish. If price is below the cloud, the instrument is bearish.
-
The wave theory of the Ichimoku Kinko Hyo has the following waves.
All about the rising market. If it is the falling market, the opposite is true.
I wave rise one market price.
V wave the market price that raises and lowers.
N wave the market price for raising, lowering, and raising.
P wave the high price depreciates and the low price rises with the passage of time. Leave either.
Y wave the high price rises and the low price falls with the passage of time. Leave either.
S wave A market in which the lowered market rebounds and rises at the previous high level.
There are the above 6 types but the basis of the Ichimoku Kinko Hyo is the N wave of 3 waves.
In Elliott wave theory and similar theories, basically there are 5 waves but 5 waves are a series of 2 and 3 waves N, 3 for 7 waves, 4 for 9 waves and so on.
Even if it keep continuing, it will be based on N wave. In addition, since the P wave and the Y wave are separated from each other, they can be seen as N waves from a large perspective.
-
There are basic E・V・N・NT calculated values and several other calculation methods for the Ichimoku Kinko Hyo. It is the only calculated value that gives a concrete value in the Ichimoku Kinko Hyo, which is difficult to understand, but since we focus only on the price difference and do not consider the supply and demand, it is forbidden to stick to the calculated value alone.
(The calculation method of the following five calculated values is based on the rising market price, which is raised from the low price A to the high price B and lowered from the high price B to the low price C. Therefore, the low price C is higher than the low price A)
E calculated value The amount of increase from the low price A to the high price B is added to the high price B. = B + (BA)
V calculated value Adds the amount of decline from the high price B to the low price C to the high price B. = B + (BC)
N calculated value The amount of increase from the low price A to the high price B is added to the low price C. = C + (BA)
NT calculated value Adds the amount of increase from the low price A to the low price C to the low price C. = C + (CA)
4E calculated value (four-layer double / quadruple value) Adds three times the amount of increase from the low price A to the high price B to the high price B. = B + 3 × (BA)
Calculated value of P wave The upper price is devalued and the lower price is rounded up, and the price range of both is the same.
Calculated value of Y wave The upper price is rounded up and the lower price is rounded down, and the price range of both is the same.

supertrendLibrary "supertrend"
supertrend : Library dedicated to different variations of supertrend
supertrend_atr(length, multiplier, atrMaType, source, highSource, lowSource, waitForClose, delayed)
supertrend_atr: Simple supertrend based on atr but also takes into consideration of custom MA Type, sources
Parameters:
length (simple int) : : ATR Length
multiplier (simple float) : : ATR Multiplier
atrMaType (simple string) : : Moving Average type for ATR calculation. This can be sma, ema, hma, rma, wma, vwma, swma
source (float) : : Default is close. Can Chose custom source
highSource (float) : : Default is high. Can also use close price for both high and low source
lowSource (float) : : Default is low. Can also use close price for both high and low source
waitForClose (simple bool) : : Considers source for direction change crossover if checked. Else, uses highSource and lowSource.
delayed (simple bool) : : if set to true lags supertrend atr stop based on target levels.
Returns: dir : Supertrend direction
supertrend : BuyStop if direction is 1 else SellStop
supertrend_bands(bandType, maType, length, multiplier, source, highSource, lowSource, waitForClose, useTrueRange, useAlternateSource, alternateSource, sticky)
supertrend_bands: Simple supertrend based on atr but also takes into consideration of custom MA Type, sources
Parameters:
bandType (simple string) : : Type of band used - can be bb, kc or dc
maType (simple string) : : Moving Average type for Bands. This can be sma, ema, hma, rma, wma, vwma, swma
length (simple int) : : Band Length
multiplier (float) : : Std deviation or ATR multiplier for Bollinger Bands and Keltner Channel
source (float) : : Default is close. Can Chose custom source
highSource (float) : : Default is high. Can also use close price for both high and low source
lowSource (float) : : Default is low. Can also use close price for both high and low source
waitForClose (simple bool) : : Considers source for direction change crossover if checked. Else, uses highSource and lowSource.
useTrueRange (simple bool) : : Used for Keltner channel. If set to false, then high-low is used as range instead of true range
useAlternateSource (simple bool) : - Custom source is used for Donchian Chanbel only if useAlternateSource is set to true
alternateSource (float) : - Custom source for Donchian channel
sticky (simple bool) : : if set to true borders change only when price is beyond borders.
Returns: dir : Supertrend direction
supertrend : BuyStop if direction is 1 else SellStop
supertrend_zigzag(length, history, useAlternativeSource, alternativeSource, source, highSource, lowSource, waitForClose, atrlength, multiplier, atrMaType)
supertrend_zigzag: Zigzag pivot based supertrend
Parameters:
length (simple int) : : Zigzag Length
history (simple int) : : number of historical pivots to consider
useAlternativeSource (simple bool)
alternativeSource (float)
source (float) : : Default is close. Can Chose custom source
highSource (float) : : Default is high. Can also use close price for both high and low source
lowSource (float) : : Default is low. Can also use close price for both high and low source
waitForClose (simple bool) : : Considers source for direction change crossover if checked. Else, uses highSource and lowSource.
atrlength (simple int) : : ATR Length
multiplier (simple float) : : ATR Multiplier
atrMaType (simple string) : : Moving Average type for ATR calculation. This can be sma, ema, hma, rma, wma, vwma, swma
Returns: dir : Supertrend direction
supertrend : BuyStop if direction is 1 else SellStop
zupertrend(length, history, useAlternativeSource, alternativeSource, source, highSource, lowSource, waitForClose, atrlength, multiplier, atrMaType)
zupertrend: Zigzag pivot based supertrend
Parameters:
length (simple int) : : Zigzag Length
history (simple int) : : number of historical pivots to consider
useAlternativeSource (simple bool)
alternativeSource (float)
source (float) : : Default is close. Can Chose custom source
highSource (float) : : Default is high. Can also use close price for both high and low source
lowSource (float) : : Default is low. Can also use close price for both high and low source
waitForClose (simple bool) : : Considers source for direction change crossover if checked. Else, uses highSource and lowSource.
atrlength (simple int) : : ATR Length
multiplier (simple float) : : ATR Multiplier
atrMaType (simple string) : : Moving Average type for ATR calculation. This can be sma, ema, hma, rma, wma, vwma, swma
Returns: dir : Supertrend direction
supertrend : BuyStop if direction is 1 else SellStop
zsupertrend(zigzagpivots, history, source, highSource, lowSource, waitForClose, atrMaType, atrlength, multiplier)
zsupertrend: Same as zigzag supertrend. But, works on already calculated array rather than Calculating fresh zigzag
Parameters:
zigzagpivots (array) : : Precalculated zigzag pivots
history (simple int) : : number of historical pivots to consider
source (float) : : Default is close. Can Chose custom source
highSource (float) : : Default is high. Can also use close price for both high and low source
lowSource (float) : : Default is low. Can also use close price for both high and low source
waitForClose (simple bool) : : Considers source for direction change crossover if checked. Else, uses highSource and lowSource.
atrMaType (simple string) : : Moving Average type for ATR calculation. This can be sma, ema, hma, rma, wma, vwma, swma
atrlength (simple int) : : ATR Length
multiplier (simple float) : : ATR Multiplier
Returns: dir : Supertrend direction
supertrend : BuyStop if direction is 1 else SellStop
msupertrend(bandType, source, maType, length, useTrueRange, highSource, lowSource, waitForClose, numberOfBands, multiplierStart, multiplierStep, trailingDistance, trailStates)
msupertrend : Dynamic trailing supertrend based on multiple bands - either bollinger bands or keltener channel
Parameters:
bandType (simple string) : : Band type - can be either bb or kc
source (float) : : custom source if required
maType (simple string) : : Moving Average Type : Can be sma, ema, hma, rma, wma, vwma, swma, highlow, linreg, median
length (simple int) : : Oscillator length - not used for TSI
useTrueRange (simple bool) : : if set to false, uses high-low.
highSource (float) : : Default is high. Can also use close price for both high and low source
lowSource (float) : : Default is low. Can also use close price for both high and low source
waitForClose (simple bool) : : Considers source for direction change crossover if checked. Else, uses highSource and lowSource.
numberOfBands (simple int) : : Number of bands to generate
multiplierStart (simple float) : : Starting ATR or Standard deviation multiplier for first band
multiplierStep (simple float) : : Incremental value for multiplier for each band
trailingDistance (simple int) : : Number of band states to trail for trailing stop.
trailStates (simple bool) : : If selected trails the band states along with trailing price. If unselected only price is trailed.
Returns: dir : Supertrend direction
supertrend : BuyStop if direction is 1 else SellStop

Bullish Breakaway Dual Session-Publish-Consolidated FVG
Inspired by the FVG Concept:
This indicator is built on the Fair Value Gap (FVG) concept, with a focus on Consolidated FVG. Unlike traditional FVGs, this version only works within a defined session (e.g., ETH 18:00–17:00 or RTH 09:30–16:00).
Bullish consolidated FVG & Bullish breakaway candle
Begins when a new intraday low is printed. After that, the indicator searches for the 1st bullish breakaway candle, which must have its low above the high of the intraday low candle. Any candles in between are part of the consolidated FVG zone. Once the 1st breakaway forms, the indicator will shades the candle’s range (high to low). Then it will use this candle as an anchor to search for the 2nd, 3rd, etc. breakaways until the session ends.
Session Reset: Occurs at session close.
Repaint Behavior:
If a new intraday (or intra-session) low forms, earlier breakaway patterns are wiped, and the system restarts from the new low.
Counter:
A session-based counter at the top of the chart displays how many bullish consolidated FVGs have formed.
Settings
• Session Setup:
Choose ETH, RTH, or custom session. The indicator is designed for CME futures in New York timezone, but can be adjusted for other markets.
If nothing appears on your chart, check if you loaded it during an inactive session (e.g., weekend/Friday night).
• Max Zones to Show:
Default = 3 (recommended). You can increase, but 3 zones are usually most useful.
• Timeframe:
Best on 1m, 5m, or 15m. (If session range is big, try higher time frame)
Usage
1. Avoid Trading in Wrong Direction
• No bullish breakaway = No long trade.
• Prevents the temptation to countertrade in strong downtrends.
2. Catch the Trend Reversal
• When a bullish breakaway appears after an intraday low, it signals a potential reversal.
• You will need adjust position sizing, watch out liquidity hunt, and place stop loss.
• Best entries of your preferred choices: (this is your own trading edge)
Retest
Breakout
Engulf
MA cross over
Whatever your favorite approach
• Reversal signal is the strongest when price stays within/above the breakaway candle’s
range. Weak if it breaks below.
3. Higher Timeframe Confirmation
• 1m can give false reversals if new lows keep forming.
• 5m often provides cleaner signals and avoids premature reversals.
Failed Trade Example:
This indicator will repaint if a new intraday session low is updated. So it is possible to have a failed trade. Here is an example from the same session in 1m chart. However, if you enter the trade later at another bullish breakaway candle signal. The loss can be mitigated by the profit.
Therefore you should use smaller position size for your 1st trade. You should also considering using 5m chart to avoid 1m bull trap. In this example, if you use 5m chart, you can totally avoid this failed trade.
If you enter the trade, you will see the intraday low is stop loss hunted. You can also see the 1st bullish breakaway candle is super weak. There are a lot of candles below the breakaway candle low, so it is very possible to fail.
In the next chart, you can see the failed traded get stop loss hunted. However you can enter another trade with huge profit to win back the loss from the 1st trade if you follow the rule.
Summary
This indicator offers 3 main advantages:
1. Prevents wrong-direction trades.
2. Confirms trend entry after reversal signals.
3. Filters false positives using higher timeframes.
How to sharp your edge:
1. ⏳Extreme patience⏳: Do not guess the bottom during a downtrend before a confirmed bullish breakaway candle. If you get caught, have the courage to cut loss. This is literally the most important usage of this indicator. Again, this is the most important rule of this indicator and actually the hardest rule to follow.
2. 🛎Better Entry🛎: After a confirmed bullish breakaway, you will always have a good opportunity to enter the trade using established trading technique. Your edge will come from the position size, draw down, stop loss placement, risk/reward ratio.
3. ✂Cut loss fast✂: If you enter a trade according to the rule, but you are still not making profit for a period of time, and the price is below the low of the breakaway candle. It is very likely you may hit stop loss soon (intraday session low). It won't be a bad idea to cut loss before stop loss hit.
4. 🔂Reentry with confidence after stop loss🔂: a stop loss will not invalidate the indicator. If you see a second chance to reenter, you should still follow the trade guide and rule.
5. 🕔Time frame matter🕔: try 1m, 3m, 5m, 10m, 15m time frame. Over time, you should know what time frame work best for you and the market. Higher time frame will reduce the noise of false positive trade, but it comes with a higher stop loss placement and less max profit, however it may come with a lower draw down. Time frame will matter depending on the range of the session. If the session range is small (<0.5%), lower time frame is good. If session range is big (>1%), 5m time frame is better. Remember to wait for candle to close, if you use higher time frame.
Last Mention:
The indicator is only used for bullish side trading.

Trend Gauge [BullByte]Trend Gauge
Summary
A multi-factor trend detection indicator that aggregates EMA alignment, VWMA momentum scaling, volume spikes, ATR breakout strength, higher-timeframe confirmation, ADX-based regime filtering, and RSI pivot-divergence penalty into one normalized trend score. It also provides a confidence meter, a Δ Score momentum histogram, divergence highlights, and a compact, scalable dashboard for at-a-glance status.
________________________________________
## 1. Purpose of the Indicator
Why this was built
Traders often monitor several indicators in parallel - EMAs, volume signals, volatility breakouts, higher-timeframe trends, ADX readings, divergence alerts, etc., which can be cumbersome and sometimes contradictory. The “Trend Gauge” indicator was created to consolidate these complementary checks into a single, normalized score that reflects the prevailing market bias (bullish, bearish, or neutral) and its strength. By combining multiple inputs with an adaptive regime filter, scaling contributions by magnitude, and penalizing weakening signals (divergence), this tool aims to reduce noise, highlight genuine trend opportunities, and warn when momentum fades.
Key Design Goals
Signal Aggregation
Merged trend-following signals (EMA crossover, ATR breakout, higher-timeframe confirmation) and momentum signals (VWMA thrust, volume spikes) into a unified score that reflects directional bias more holistically.
Market Regime Awareness
Implemented an ADX-style filter to distinguish between trending and ranging markets, reducing the influence of trend signals during sideways phases to avoid false breakouts.
Magnitude-Based Scaling
Replaced binary contributions with scaled inputs: VWMA thrust and ATR breakout are weighted relative to recent averages, allowing for more nuanced score adjustments based on signal strength.
Momentum Divergence Penalty
Integrated pivot-based RSI divergence detection to slightly reduce the overall score when early signs of momentum weakening are detected, improving risk-awareness in entries.
Confidence Transparency
Added a live confidence metric that shows what percentage of enabled sub-indicators currently agree with the overall bias, making the scoring system more interpretable.
Momentum Acceleration Visualization
Plotted the change in score (Δ Score) as a histogram bar-to-bar, highlighting whether momentum is increasing, flattening, or reversing, aiding in more timely decision-making.
Compact Informational Dashboard
Presented a clean, scalable dashboard that displays each component’s status, the final score, confidence %, detected regime (Trending/Ranging), and a labeled strength gauge for quick visual assessment.
________________________________________
## 2. Why a Trader Should Use It
Main benefits and use cases
1. Unified View: Rather than juggling multiple windows or panels, this indicator delivers a single score synthesizing diverse signals.
2. Regime Filtering: In ranging markets, trend signals often generate false entries. The ADX-based regime filter automatically down-weights trend-following components, helping you avoid chasing false breakouts.
3. Nuanced Momentum & Volatility: VWMA and ATR breakout contributions are normalized by recent averages, so strong moves register strongly while smaller fluctuations are de-emphasized.
4. Early Warning of Weakening: Pivot-based RSI divergence is detected and used to slightly reduce the score when price/momentum diverges, giving a cautionary signal before a full reversal.
5. Confidence Meter: See at a glance how many sub-indicators align with the aggregated bias (e.g., “80% confidence” means 4 out of 5 components agree ). This transparency avoids black-box decisions.
6. Trend Acceleration/Deceleration View: The Δ Score histogram visualizes whether the aggregated score is rising (accelerating trend) or falling (momentum fading), supplementing the main oscillator.
7. Compact Dashboard: A corner table lists each check’s status (“Bull”, “Bear”, “Flat” or “Disabled”), plus overall Score, Confidence %, Regime, Trend Strength label, and a gauge bar. Users can scale text size (Normal, Small, Tiny) without removing elements, so the full picture remains visible even in compact layouts.
8. Customizable & Transparent: All components can be enabled/disabled and parameterized (lengths, thresholds, weights). The full Pine code is open and well-commented, letting users inspect or adapt the logic.
9. Alert-ready: Built-in alert conditions fire when the score crosses weak thresholds to bullish/bearish or returns to neutral, enabling timely notifications.
________________________________________
## 3. Component Rationale (“Why These Specific Indicators?”)
Each sub-component was chosen because it adds complementary information about trend or momentum:
1. EMA Cross
o Basic trend measure: compares a faster EMA vs. a slower EMA. Quickly reflects trend shifts but by itself can whipsaw in sideways markets.
2. VWMA Momentum
o Volume-weighted moving average change indicates momentum with volume context. By normalizing (dividing by a recent average absolute change), we capture the strength of momentum relative to recent history. This scaling prevents tiny moves from dominating and highlights genuinely strong momentum.
3. Volume Spikes
o Sudden jumps in volume combined with price movement often accompany stronger moves or reversals. A binary detection (+1 for bullish spike, -1 for bearish spike) flags high-conviction bars.
4. ATR Breakout
o Detects price breaking beyond recent highs/lows by a multiple of ATR. Measures breakout strength by how far beyond the threshold price moves relative to ATR, capped to avoid extreme outliers. This gives a volatility-contextual trend signal.
5. Higher-Timeframe EMA Alignment
o Confirms whether the shorter-term trend aligns with a higher timeframe trend. Uses request.security with lookahead_off to avoid future data. When multiple timeframes agree, confidence in direction increases.
6. ADX Regime Filter (Manual Calculation)
o Computes directional movement (+DM/–DM), smoothes via RMA, computes DI+ and DI–, then a DX and ADX-like value. If ADX ≥ threshold, market is “Trending” and trend components carry full weight; if ADX < threshold, “Ranging” mode applies a configurable weight multiplier (e.g., 0.5) to trend-based contributions, reducing false signals in sideways conditions. Volume spikes remain binary (optional behavior; can be adjusted if desired).
7. RSI Pivot-Divergence Penalty
o Uses ta.pivothigh / ta.pivotlow with a lookback to detect pivot highs/lows on price and corresponding RSI values. When price makes a higher high but RSI makes a lower high (bearish divergence), or price makes a lower low but RSI makes a higher low (bullish divergence), a divergence signal is set. Rather than flipping the trend outright, the indicator subtracts (or adds) a small penalty (configurable) from the aggregated score if it would weaken the current bias. This subtle adjustment warns of weakening momentum without overreacting to noise.
8. Confidence Meter
o Counts how many enabled components currently agree in direction with the aggregated score (i.e., component sign × score sign > 0). Displays this as a percentage. A high percentage indicates strong corroboration; a low percentage warns of mixed signals.
9. Δ Score Momentum View
o Plots the bar-to-bar change in the aggregated score (delta_score = score - score ) as a histogram. When positive, bars are drawn in green above zero; when negative, bars are drawn in red below zero. This reveals acceleration (rising Δ) or deceleration (falling Δ), supplementing the main oscillator.
10. Dashboard
• A table in the indicator pane’s top-right with 11 rows:
1. EMA Cross status
2. VWMA Momentum status
3. Volume Spike status
4. ATR Breakout status
5. Higher-Timeframe Trend status
6. Score (numeric)
7. Confidence %
8. Regime (“Trending” or “Ranging”)
9. Trend Strength label (e.g., “Weak Bullish Trend”, “Strong Bearish Trend”)
10. Gauge bar visually representing score magnitude
• All rows always present; size_opt (Normal, Small, Tiny) only changes text size via text_size, not which elements appear. This ensures full transparency.
________________________________________
## 4. What Makes This Indicator Stand Out
• Regime-Weighted Multi-Factor Score: Trend and momentum signals are adaptively weighted by market regime (trending vs. ranging) , reducing false signals.
• Magnitude Scaling: VWMA and ATR breakout contributions are normalized by recent average momentum or ATR, giving finer gradation compared to simple ±1.
• Integrated Divergence Penalty: Divergence directly adjusts the aggregated score rather than appearing as a separate subplot; this influences alerts and trend labeling in real time.
• Confidence Meter: Shows the percentage of sub-signals in agreement, providing transparency and preventing blind trust in a single metric.
• Δ Score Histogram Momentum View: A histogram highlights acceleration or deceleration of the aggregated trend score, helping detect shifts early.
• Flexible Dashboard: Always-visible component statuses and summary metrics in one place; text size scaling keeps the full picture available in cramped layouts.
• Lookahead-Safe HTF Confirmation: Uses lookahead_off so no future data is accessed from higher timeframes, avoiding repaint bias.
• Repaint Transparency: Divergence detection uses pivot functions that inherently confirm only after lookback bars; description documents this lag so users understand how and when divergence labels appear.
• Open-Source & Educational: Full, well-commented Pine v6 code is provided; users can learn from its structure: manual ADX computation, conditional plotting with series = show ? value : na, efficient use of table.new in barstate.islast, and grouped inputs with tooltips.
• Compliance-Conscious: All plots have descriptive titles; inputs use clear names; no unnamed generic “Plot” entries; manual ADX uses RMA; all request.security calls use lookahead_off. Code comments mention repaint behavior and limitations.
________________________________________
## 5. Recommended Timeframes & Tuning
• Any Timeframe: The indicator works on small (e.g., 1m) to large (daily, weekly) timeframes. However:
o On very low timeframes (<1m or tick charts), noise may produce frequent whipsaws. Consider increasing smoothing lengths, disabling certain components (e.g., volume spike if volume data noisy), or using a larger pivot lookback for divergence.
o On higher timeframes (daily, weekly), consider longer lookbacks for ATR breakout or divergence, and set Higher-Timeframe trend appropriately (e.g., 4H HTF when on 5 Min chart).
• Defaults & Experimentation: Default input values are chosen to be balanced for many liquid markets. Users should test with replay or historical analysis on their symbol/timeframe and adjust:
o ADX threshold (e.g., 20–30) based on instrument volatility.
o VWMA and ATR scaling lengths to match average volatility cycles.
o Pivot lookback for divergence: shorter for faster markets, longer for slower ones.
• Combining with Other Analysis: Use in conjunction with price action, support/resistance, candlestick patterns, order flow, or other tools as desired. The aggregated score and alerts can guide attention but should not be the sole decision-factor.
________________________________________
## 6. How Scoring and Logic Works (Step-by-Step)
1. Compute Sub-Scores
o EMA Cross: Evaluate fast EMA > slow EMA ? +1 : fast EMA < slow EMA ? -1 : 0.
o VWMA Momentum: Calculate vwma = ta.vwma(close, length), then vwma_mom = vwma - vwma . Normalize: divide by recent average absolute momentum (e.g., ta.sma(abs(vwma_mom), lookback)), clip to .
o Volume Spike: Compute vol_SMA = ta.sma(volume, len). If volume > vol_SMA * multiplier AND price moved up ≥ threshold%, assign +1; if moved down ≥ threshold%, assign -1; else 0.
o ATR Breakout: Determine recent high/low over lookback. If close > high + ATR*mult, compute distance = close - (high + ATR*mult), normalize by ATR, cap at a configured maximum. Assign positive contribution. Similarly for bearish breakout below low.
o Higher-Timeframe Trend: Use request.security(..., lookahead=barmerge.lookahead_off) to fetch HTF EMAs; assign +1 or -1 based on alignment.
2. ADX Regime Weighting
o Compute manual ADX: directional movements (+DM, –DM), smoothed via RMA, DI+ and DI–, then DX and ADX via RMA. If ADX ≥ threshold, market is considered “Trending”; otherwise “Ranging.”
o If trending, trend-based contributions (EMA, VWMA, ATR, HTF) use full weight = 1.0. If ranging, use weight = ranging_weight (e.g., 0.5) to down-weight them. Volume spike stays binary ±1 (optional to change if desired).
3. Aggregate Raw Score
o Sum weighted contributions of all enabled components. Count the number of enabled components; if zero, default count = 1 to avoid division by zero.
4. Divergence Penalty
o Detect pivot highs/lows on price and corresponding RSI values, using a lookback. When price and RSI diverge (bearish or bullish divergence), check if current raw score is in the opposing direction:
If bearish divergence (price higher high, RSI lower high) and raw score currently positive, subtract a penalty (e.g., 0.5).
If bullish divergence (price lower low, RSI higher low) and raw score currently negative, add a penalty.
o This reduces score magnitude to reflect weakening momentum, without flipping the trend outright.
5. Normalize and Smooth
o Normalized score = (raw_score / number_of_enabled_components) * 100. This yields a roughly range.
o Optional EMA smoothing of this normalized score to reduce noise.
6. Interpretation
o Sign: >0 = net bullish bias; <0 = net bearish bias; near zero = neutral.
o Magnitude Zones: Compare |score| to thresholds (Weak, Medium, Strong) to label trend strength (e.g., “Weak Bullish Trend”, “Medium Bearish Trend”, “Strong Bullish Trend”).
o Δ Score Histogram: The histogram bars from zero show change from previous bar’s score; positive bars indicate acceleration, negative bars indicate deceleration.
o Confidence: Percentage of sub-indicators aligned with the score’s sign.
o Regime: Indicates whether trend-based signals are fully weighted or down-weighted.
________________________________________
## 7. Oscillator Plot & Visualization: How to Read It
Main Score Line & Area
The oscillator plots the aggregated score as a line, with colored fill: green above zero for bullish area, red below zero for bearish area. Horizontal reference lines at ±Weak, ±Medium, and ±Strong thresholds mark zones: crossing above +Weak suggests beginning of bullish bias, above +Medium for moderate strength, above +Strong for strong trend; similarly for bearish below negative thresholds.
Δ Score Histogram
If enabled, a histogram shows score - score . When positive, bars appear in green above zero, indicating accelerating bullish momentum; when negative, bars appear in red below zero, indicating decelerating or reversing momentum. The height of each bar reflects the magnitude of change in the aggregated score from the prior bar.
Divergence Highlight Fill
If enabled, when a pivot-based divergence is confirmed:
• Bullish Divergence : fill the area below zero down to –Weak threshold in green, signaling potential reversal from bearish to bullish.
• Bearish Divergence : fill the area above zero up to +Weak threshold in red, signaling potential reversal from bullish to bearish.
These fills appear with a lag equal to pivot lookback (the number of bars needed to confirm the pivot). They do not repaint after confirmation, but users must understand this lag.
Trend Direction Label
When score crosses above or below the Weak threshold, a small label appears near the score line reading “Bullish” or “Bearish.” If the score returns within ±Weak, the label “Neutral” appears. This helps quickly identify shifts at the moment they occur.
Dashboard Panel
In the indicator pane’s top-right, a table shows:
1. EMA Cross status: “Bull”, “Bear”, “Flat”, or “Disabled”
2. VWMA Momentum status: similarly
3. Volume Spike status: “Bull”, “Bear”, “No”, or “Disabled”
4. ATR Breakout status: “Bull”, “Bear”, “No”, or “Disabled”
5. Higher-Timeframe Trend status: “Bull”, “Bear”, “Flat”, or “Disabled”
6. Score: numeric value (rounded)
7. Confidence: e.g., “80%” (colored: green for high, amber for medium, red for low)
8. Regime: “Trending” or “Ranging” (colored accordingly)
9. Trend Strength: textual label based on magnitude (e.g., “Medium Bullish Trend”)
10. Gauge: a bar of blocks representing |score|/100
All rows remain visible at all times; changing Dashboard Size only scales text size (Normal, Small, Tiny).
________________________________________
## 8. Example Usage (Illustrative Scenario)
Example: BTCUSD 5 Min
1. Setup: Add “Trend Gauge ” to your BTCUSD 5 Min chart. Defaults: EMAs (8/21), VWMA 14 with lookback 3, volume spike settings, ATR breakout 14/5, HTF = 5m (or adjust to 4H if preferred), ADX threshold 25, ranging weight 0.5, divergence RSI length 14 pivot lookback 5, penalty 0.5, smoothing length 3, thresholds Weak=20, Medium=50, Strong=80. Dashboard Size = Small.
2. Trend Onset: At some point, price breaks above recent high by ATR multiple, volume spikes upward, faster EMA crosses above slower EMA, HTF EMA also bullish, and ADX (manual) ≥ threshold → aggregated score rises above +20 (Weak threshold) into +Medium zone. Dashboard shows “Bull” for EMA, VWMA, Vol Spike, ATR, HTF; Score ~+60–+70; Confidence ~100%; Regime “Trending”; Trend Strength “Medium Bullish Trend”; Gauge ~6–7 blocks. Δ Score histogram bars are green and rising, indicating accelerating bullish momentum. Trader notes the alignment.
3. Divergence Warning: Later, price makes a slightly higher high but RSI fails to confirm (lower RSI high). Pivot lookback completes; the indicator highlights a bearish divergence fill above zero and subtracts a small penalty from the score, causing score to stall or retrace slightly. Dashboard still bullish but score dips toward +Weak. This warns the trader to tighten stops or take partial profits.
4. Trend Weakens: Score eventually crosses below +Weak back into neutral; a “Neutral” label appears, and a “Neutral Trend” alert fires if enabled. Trader exits or avoids new long entries. If score subsequently crosses below –Weak, a “Bearish” label and alert occur.
5. Customization: If the trader finds VWMA noise too frequent on this instrument, they may disable VWMA or increase lookback. If ATR breakouts are too rare, adjust ATR length or multiplier. If ADX threshold seems off, tune threshold. All these adjustments are explained in Inputs section.
6. Visualization: The screenshot shows the main score oscillator with colored areas, reference lines at ±20/50/80, Δ Score histogram bars below/above zero, divergence fill highlighting potential reversal, and the dashboard table in the top-right.
________________________________________
## 9. Inputs Explanation
A concise yet clear summary of inputs helps users understand and adjust:
1. General Settings
• Theme (Dark/Light): Choose background-appropriate colors for the indicator pane.
• Dashboard Size (Normal/Small/Tiny): Scales text size only; all dashboard elements remain visible.
2. Indicator Settings
• Enable EMA Cross: Toggle on/off basic EMA alignment check.
o Fast EMA Length and Slow EMA Length: Periods for EMAs.
• Enable VWMA Momentum: Toggle VWMA momentum check.
o VWMA Length: Period for VWMA.
o VWMA Momentum Lookback: Bars to compare VWMA to measure momentum.
• Enable Volume Spike: Toggle volume spike detection.
o Volume SMA Length: Period to compute average volume.
o Volume Spike Multiplier: How many times above average volume qualifies as spike.
o Min Price Move (%): Minimum percent change in price during spike to qualify as bullish or bearish.
• Enable ATR Breakout: Toggle ATR breakout detection.
o ATR Length: Period for ATR.
o Breakout Lookback: Bars to look back for recent highs/lows.
o ATR Multiplier: Multiplier for breakout threshold.
• Enable Higher Timeframe Trend: Toggle HTF EMA alignment.
o Higher Timeframe: E.g., “5” for 5-minute when on 1-minute chart, or “60” for 5 Min when on 15m, etc. Uses lookahead_off.
• Enable ADX Regime Filter: Toggles regime-based weighting.
o ADX Length: Period for manual ADX calculation.
o ADX Threshold: Value above which market considered trending.
o Ranging Weight Multiplier: Weight applied to trend components when ADX < threshold (e.g., 0.5).
• Scale VWMA Momentum: Toggle normalization of VWMA momentum magnitude.
o VWMA Mom Scale Lookback: Period for average absolute VWMA momentum.
• Scale ATR Breakout Strength: Toggle normalization of breakout distance by ATR.
o ATR Scale Cap: Maximum multiple of ATR used for breakout strength.
• Enable Price-RSI Divergence: Toggle divergence detection.
o RSI Length for Divergence: Period for RSI.
o Pivot Lookback for Divergence: Bars on each side to identify pivot high/low.
o Divergence Penalty: Amount to subtract/add to score when divergence detected (e.g., 0.5).
3. Score Settings
• Smooth Score: Toggle EMA smoothing of normalized score.
• Score Smoothing Length: Period for smoothing EMA.
• Weak Threshold: Absolute score value under which trend is considered weak or neutral.
• Medium Threshold: Score above Weak but below Medium is moderate.
• Strong Threshold: Score above this indicates strong trend.
4. Visualization Settings
• Show Δ Score Histogram: Toggle display of the bar-to-bar change in score as a histogram. Default true.
• Show Divergence Fill: Toggle background fill highlighting confirmed divergences. Default true.
Each input has a tooltip in the code.
________________________________________
## 10. Limitations, Repaint Notes, and Disclaimers
10.1. Repaint & Lag Considerations
• Pivot-Based Divergence Lag: The divergence detection uses ta.pivothigh / ta.pivotlow with a specified lookback. By design, a pivot is only confirmed after the lookback number of bars. As a result:
o Divergence labels or fills appear with a delay equal to the pivot lookback.
o Once the pivot is confirmed and the divergence is detected, the fill/label does not repaint thereafter, but you must understand and accept this lag.
o Users should not treat divergence highlights as predictive signals without additional confirmation, because they appear after the pivot has fully formed.
• Higher-Timeframe EMA Alignment: Uses request.security(..., lookahead=barmerge.lookahead_off), so no future data from the higher timeframe is used. This avoids lookahead bias and ensures signals are based only on completed higher-timeframe bars.
• No Future Data: All calculations are designed to avoid using future information. For example, manual ADX uses RMA on past data; security calls use lookahead_off.
10.2. Market & Noise Considerations
• In very choppy or low-liquidity markets, some components (e.g., volume spikes or VWMA momentum) may be noisy. Users can disable or adjust those components’ parameters.
• On extremely low timeframes, noise may dominate; consider smoothing lengths or disabling certain features.
• On very high timeframes, pivots and breakouts occur less frequently; adjust lookbacks accordingly to avoid sparse signals.
10.3. Not a Standalone Trading System
• This is an indicator, not a complete trading strategy. It provides signals and context but does not manage entries, exits, position sizing, or risk management.
• Users must combine it with their own analysis, money management, and confirmations (e.g., price patterns, support/resistance, fundamental context).
• No guarantees: past behavior does not guarantee future performance.
10.4. Disclaimers
• Educational Purposes Only: The script is provided as-is for educational and informational purposes. It does not constitute financial, investment, or trading advice.
• Use at Your Own Risk: Trading involves risk of loss. Users should thoroughly test and use proper risk management.
• No Guarantees: The author is not responsible for trading outcomes based on this indicator.
• License: Published under Mozilla Public License 2.0; code is open for viewing and modification under MPL terms.
________________________________________
## 11. Alerts
• The indicator defines three alert conditions:
1. Bullish Trend: when the aggregated score crosses above the Weak threshold.
2. Bearish Trend: when the score crosses below the negative Weak threshold.
3. Neutral Trend: when the score returns within ±Weak after being outside.
Good luck
– BullByte

Timeframe Resistance Evaluation And Detection - CoffeeKillerTREAD - Timeframe Resistance Evaluation And Detection Guide
🔔 Important Technical Limitation 🔔
**This indicator does NOT fetch true higher timeframe data.** Instead, it simulates higher timeframe levels by aggregating data from your current chart timeframe. This means:
- Results will vary depending on what chart timeframe you're viewing
- Levels may not match actual higher timeframe candle highs/lows
- You might miss important wicks or gaps that occurred between chart timeframe bars
- **Always verify levels against actual higher timeframe charts before trading**
Welcome traders! This guide will walk you through the TREAD (Timeframe Resistance Evaluation And Detection) indicator, a multi-timeframe analysis tool developed by CoffeeKiller that identifies support and resistance confluence across different time periods.(I am 50+ year old trader and always thought I was bad a teaching and explaining so you get a AI guide. I personally use this on the 5 minute chart with the default settings, but to each there own and if you can improve the trend detection methods please DM me. I would like to see the code. Thanks)
Core Components
1. Dual Timeframe Level Tracking
- Short Timeframe Levels: Tracks opening price extremes within shorter periods
- Long Timeframe Levels: Tracks actual high/low extremes within longer periods
- Dynamic Reset Mechanism: Levels reset at the start of each new timeframe period
- Momentum Detection: Identifies when levels change mid-period, indicating active price movement
2. Visual Zone System
- High Zones: Areas between long timeframe highs and short timeframe highs
- Low Zones: Areas between long timeframe lows and short timeframe lows
- Fill Coloring: Dynamic colors based on whether levels are static or actively changing
- Momentum Highlighting: Special colors when levels break during active periods
3. Customizable Display Options
- Multiple Plot Styles: Line, circles, or cross markers
- Flexible Timeframe Selection: Wide range of short and long timeframe combinations
- Color Customization: Separate colors for each level type and momentum state
- Toggle Controls: Show/hide different elements based on trading preference
Main Features
Timeframe Settings
- Short Timeframe Options: 15m, 30m, 1h, 2h, 4h
- Long Timeframe Options: 1h, 2h, 4h, 8h, 12h, 1D, 1W
- Recommended Combinations:
- Scalping: 15m/1h or 30m/2h
- Day Trading: 30m/4h or 1h/4h
- Swing Trading: 4h/1D or 1D/1W
Display Configuration
- Level Visibility: Toggle short/long timeframe levels independently
- Fill Zone Control: Enable/disable colored zones between levels
- Momentum Fills: Special highlighting for actively changing levels
- Line Customization: Width, style, and color options for all elements
Color System
- Short TF High: Default red for resistance levels
- Short TF Low: Default green for support levels
- Long TF High: Transparent red for broader resistance context
- Long TF Low: Transparent green for broader support context
- Momentum Colors: Brighter colors when levels are actively changing
Technical Implementation Details
How Level Tracking Works
The indicator uses a custom tracking function that:
1. Detects Timeframe Periods: Uses `time()` function to identify when new periods begin
2. Tracks Extremes: Monitors highest/lowest values within each period
3. Resets on New Periods: Clears tracking when timeframe periods change
4. Updates Mid-Period: Continues tracking if new extremes are reached
The Timeframe Limitation Explained
`pinescript
// What the indicator does:
short_tf_start = ta.change(time(short_timeframe)) != 0 // Detects 30m period start
= track_highest(open, short_tf_start) // BUT uses chart TF opens!
// What true multi-timeframe would be:
// short_tf_high = request.security(syminfo.tickerid, short_timeframe, high)
`
This means:
- On a 5m chart with 30m/4h settings: Tracks 5m bar opens during 30m and 4h windows
- On a 1m chart with same settings: Tracks 1m bar opens during 30m and 4h windows
- Results will be different between chart timeframes
- May miss important price action that occurred between your chart's bars
Visual Elements
1. Level Lines
- Short TF High: Upper resistance line from shorter timeframe analysis
- Short TF Low: Lower support line from shorter timeframe analysis
- Long TF High: Broader resistance context from longer timeframe
- Long TF Low: Broader support context from longer timeframe
2. Zone Fills
- High Zone: Area between long TF high and short TF high (potential resistance cluster)
- Low Zone: Area between long TF low and short TF low (potential support cluster)
- Regular Fill: Standard transparency when levels are static
- Momentum Fill: Enhanced visibility when levels are actively changing
3. Dynamic Coloring
- Static Periods: Normal colors when levels haven't changed recently
- Active Periods: Momentum colors when levels are being tested/broken
- Confluence Zones: Different intensities based on timeframe alignment
Trading Applications
1. Support/Resistance Trading
- Entry Points: Trade bounces from zone boundaries
- Confluence Areas: Focus on areas where short and long TF levels cluster
- Zone Breaks: Enter on confirmed breaks through entire zones
- Multiple Timeframe Confirmation: Stronger signals when both timeframes align
2. Range Trading
- Zone Boundaries: Use fill zones as range extremes
- Mean Reversion: Trade back toward opposite zone when price reaches extremes
- Breakout Preparation: Watch for momentum color changes indicating potential breakouts
- Risk Management: Place stops outside the opposite zone
3. Trend Following
- Direction Bias: Trade in direction of zone breaks
- Pullback Entries: Enter on pullbacks to broken zones (now support/resistance)
- Momentum Confirmation: Use momentum coloring to confirm trend strength
- Multiple Timeframe Alignment: Strongest trends when both timeframes agree
4. Scalping Applications
- Quick Bounces: Trade rapid moves between zone boundaries
- Momentum Signals: Enter when momentum colors appear
- Short-Term Targets: Use opposite zone as profit target
- Tight Stops: Place stops just outside current zone
Optimization Guide
1. Timeframe Selection
For Different Trading Styles:
- Scalping: 15m/1h - Quick levels, frequent updates
- Day Trading: 30m/4h - Balanced view, good for intraday moves
- Swing Trading: 4h/1D - Longer-term perspective, fewer false signals
- Position Trading: 1D/1W - Major structural levels
2. Chart Timeframe Considerations
**Important**: Your chart timeframe affects results
- Lower Chart TF: More granular level tracking, but may be noisy
- Higher Chart TF: Smoother levels, but may miss important price action
- Recommended: Use chart timeframe 2-4x smaller than short indicator timeframe
3. Display Settings
- Busy Charts: Disable fills, show only key levels
- Clean Analysis: Enable all fills and momentum coloring
- Multi-Monitor Setup: Use different color schemes for easy identification
- Mobile Trading: Increase line width for visibility
Best Practices
1. Level Verification
- Always Cross-Check: Verify levels against actual higher timeframe charts
- Multiple Timeframes: Check 2-3 different chart timeframes for consistency
- Price Action Confirmation: Wait for candlestick confirmation at levels
- Volume Analysis: Combine with volume for stronger confirmation
2. Risk Management
- Stop Placement: Use zones rather than exact prices for stops
- Position Sizing: Reduce size when zones are narrow (higher risk)
- Multiple Targets: Scale out at different zone boundaries
- False Break Protection: Allow for minor zone penetrations
3. Signal Quality Assessment
- Momentum Colors: Higher probability when momentum coloring appears
- Zone Width: Wider zones often provide stronger support/resistance
- Historical Testing: Backtest on your preferred timeframe combinations
- Market Conditions: Adjust sensitivity based on volatility
Advanced Features
1. Momentum Detection System
The indicator tracks when levels change mid-period:
`pinescript
short_high_changed = short_high != short_high and not short_tf_start
`
This identifies:
- Active level testing
- Potential breakout situations
- Increased market volatility
- Trend acceleration points
2. Dynamic Color System
Complex conditional logic determines fill colors:
- Static Zones: Regular transparency for stable levels
- Active Zones: Enhanced colors for changing levels
- Mixed States: Different combinations based on user preferences
- Custom Overrides: User can prioritize certain color schemes
3. Zone Interaction Analysis
- Convergence: When short and long TF levels approach each other
- Divergence: When timeframes show conflicting levels
- Alignment: When both timeframes agree on direction
- Transition: When one timeframe changes while other remains static
Common Issues and Solutions
1. Inconsistent Levels
Problem: Levels look different on various chart timeframes
Solution: Always verify against actual higher timeframe charts
2. Missing Price Action
Problem: Important wicks or gaps not reflected in levels
Solution: Use chart timeframe closer to indicator's short timeframe setting
3. Too Many Signals
Problem: Excessive level changes and momentum alerts
Solution: Increase timeframe settings or reduce chart timeframe granularity
4. Lagging Signals
Problem: Levels seem to update too slowly
Solution: Decrease chart timeframe or use more sensitive timeframe combinations
Recommended Setups
Conservative Approach
- Timeframes: 4h/1D
- Chart: 1h
- Display: Show fills only, no momentum coloring
- Use: Swing trading, position management
Aggressive Approach
- Timeframes: 15m/1h
- Chart: 5m
- Display: All features enabled, momentum highlighting
- Use: Scalping, quick reversal trades
Balanced Approach
- Timeframes: 30m/4h
- Chart: 15m
- Display: Selective fills, momentum on key levels
- Use: Day trading, multi-session analysis
Final Notes
**Remember**: This indicator provides a synthetic view of multi-timeframe levels, not true higher timeframe data. While useful for identifying potential confluence areas, always verify important levels by checking actual higher timeframe charts.
**Best Results When**:
- Combined with actual multi-timeframe analysis
- Used for confluence confirmation rather than primary signals
- Applied with proper risk management
- Verified against price action and volume
**DISCLAIMER**: This indicator and its signals are intended solely for educational and informational purposes. The timeframe limitation means results may not reflect true higher timeframe levels. Always conduct your own analysis and verify levels independently before making trading decisions. Trading involves significant risk of loss.

DrawZigZag🟩 OVERVIEW
This library draws zigzag lines for existing pivots. It is designed to be simple to use. If your script creates pivots and you want to join them up while handling edge cases, this library does that quickly and efficiently. If you want your pivots created for you, choose one of the many other zigzag libraries that do that.
🟩 HOW TO USE
Pine Script libraries contain reusable code for importing into indicators. You do not need to copy any code out of here. Just import the library and call the function you want.
For example, for version 1 of this library, import it like this:
import SimpleCryptoLife/DrawZigZag/1
See the EXAMPLE USAGE sections within the library for examples of calling the functions.
For more information on libraries and incorporating them into your scripts, see the Libraries section of the Pine Script User Manual.
🟩 WHAT IT DOES
I looked at every zigzag library on TradingView, after finishing this one. They all seemed to fall into two groups in terms of functionality:
• Create the pivots themselves, using a combination of Williams-style pivots and sometimes price distance.
• Require an array of pivot information, often in a format that uses user-defined types.
My library takes a completely different approach.
Firstly, it only does the drawing. It doesn't calculate the pivots for you. This isn't laziness. There are so many ways to define pivots and that should be up to you. If you've followed my work on market structure you know what I think of Williams pivots.
Secondly, when you pass information about your pivots to the library function, you only need the minimum of pivot information -- whether it's a High or Low pivot, the price, and the bar index. Pass these as normal variables -- bools, ints, and floats -- on the fly as your pivots confirm. It is completely agnostic as to how you derive your pivots. If they are confirmed an arbitrary number of bars after they happen, that's fine.
So why even bother using it if all it does it draw some lines?
Turns out there is quite some logic needed in order to connect highs and lows in the right way, and to handle edge cases. This is the kind of thing one can happily outsource.
🟩 THE RULES
• Zigs and zags must alternate between Highs and Lows. We never connect a High to a High or a Low to a Low.
• If a candle has both a High and Low pivot confirmed on it, the first line is drawn to the end of the candle that is the opposite to the previous pivot. Then the next line goes vertically through the candle to the other end, and then after that continues normally.
• If we draw a line up from a Low to a High pivot, and another High pivot comes in higher, we *extend* the line up, and the same for lines down. Yes this is a form of repainting. It is in my opinion the only way to end up with a correct structure.
• We ignore lower highs on the way up and higher lows on the way down.
🟩 WHAT'S COOL ABOUT THIS LIBRARY
• It's simple and lightweight: no exported user-defined types, no helper methods, no matrices.
• It's really fast. In my profiling it runs at about ~50ms, and changing the options (e.g., trimming the array) doesn't make very much difference.
• You only need to call one function, which does all the calculations and draws all lines.
• There are two variations of this function though -- one simple function that just draws lines, and one slightly more advanced method that modifies an array containing the lines. If you don't know which one you want, use the simpler one.
🟩 GEEK STUFF
• There are no dependencies on other libraries.
• I tried to make the logic as clear as I could and comment it appropriately.
• In the `f_drawZigZags` function, the line variable is declared using the `var` keyword *inside* the function, for simplicity. For this reason, it persists between function calls *only* if the function is called from the global scope or a local if block. In general, if a function is called from inside a loop , or multiple times from different contexts, persistent variables inside that function are re-initialised on each call. In this case, this re-initialisation would mean that the function loses track of the previous line, resulting in incorrect drawings. This is why you cannot call the `f_drawZigZags` function from a loop (not that there's any reason to). The `m_drawZigZagsArray` does not use any internal `var` variables.
• The function itself takes a Boolean parameter `_showZigZag`, which turns the drawings on and off, so there is no need to call the function conditionally. In the examples, we do call the functions from an if block, purely as an illustration of how to increase performance by restricting the amount of code that needs to be run.
🟩 BRING ON THE FUNCTIONS
f_drawZigZags(_showZigZag, _isHighPivot, _isLowPivot, _highPivotPrice, _lowPivotPrice, _pivotIndex, _zigzagWidth, _lineStyle, _upZigColour, _downZagColour)
This function creates or extends the latest zigzag line. Takes real-time information about pivots and draws lines. It does not calculate the pivots. It must be called once per script and cannot be called from a loop.
Parameters:
_showZigZag (bool) : Whether to show the zigzag lines.
_isHighPivot (bool) : Whether the current bar confirms a high pivot. Note that pivots are confirmed after the bar in which they occur.
_isLowPivot (bool) : Whether the current bar confirms a low pivot.
_highPivotPrice (float) : The price of the high pivot that was confirmed this bar. It is NOT the high price of the current bar.
_lowPivotPrice (float) : The price of the low pivot that was confirmed this bar. It is NOT the low price of the current bar.
_pivotIndex (int) : The bar index of the pivot that was confirmed this bar. This is not an offset. It's the `bar_index` value of the pivot.
_zigzagWidth (int) : The width of the zigzag lines.
_lineStyle (string) : The style of the zigzag lines.
_upZigColour (color) : The colour of the up zigzag lines.
_downZagColour (color) : The colour of the down zigzag lines.
Returns: The function has no explicit returns. As a side effect, it draws or updates zigzag lines.
method m_drawZigZagsArray(_a_zigZagLines, _showZigZag, _isHighPivot, _isLowPivot, _highPivotPrice, _lowPivotPrice, _pivotIndex, _zigzagWidth, _lineStyle, _upZigColour, _downZagColour, _trimArray)
Namespace types: array
Parameters:
_a_zigZagLines (array)
_showZigZag (bool) : Whether to show the zigzag lines.
_isHighPivot (bool) : Whether the current bar confirms a high pivot. Note that pivots are usually confirmed after the bar in which they occur.
_isLowPivot (bool) : Whether the current bar confirms a low pivot.
_highPivotPrice (float) : The price of the high pivot that was confirmed this bar. It is NOT the high price of the current bar.
_lowPivotPrice (float) : The price of the low pivot that was confirmed this bar. It is NOT the low price of the current bar.
_pivotIndex (int) : The bar index of the pivot that was confirmed this bar. This is not an offset. It's the `bar_index` value of the pivot.
_zigzagWidth (int) : The width of the zigzag lines.
_lineStyle (string) : The style of the zigzag lines.
_upZigColour (color) : The colour of the up zigzag lines.
_downZagColour (color) : The colour of the down zigzag lines.
_trimArray (bool) : If true, the array of lines is kept to a maximum size of two lines (the line elements are not deleted). If false (the default), the array is kept to a maximum of 500 lines (the maximum number of line objects a single Pine script can display).
Returns: This function has no explicit returns but it modifies a global array of zigzag lines.
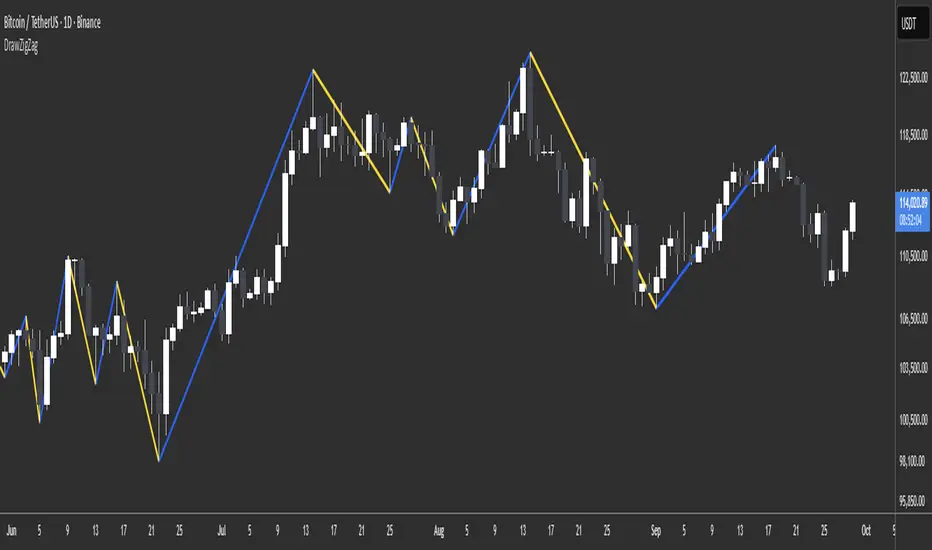
UTSConvenienceToolsLibrary "UTSConvenienceTools"
Convenience tool library containing helper functions for drawing and charting.
isDarkColor(color)
Determines on base of the luminance of the given color if the color can be considered a 'dark' color. Usefull for determining the readable font color for arbitrary colored backgrounds. Credits out to:
Parameters:
color (color) : (color): The actual color value.
Returns: (bool): A boolean value.
smallLabelLowerRight(txt, yPos, bgColor)
Displays the specified `txt` in a small label at the `yPos` of the current bar. The label points to the lower right.
Parameters:
txt (string)
yPos (float) : (float): The y-position value. To have it positioned above the candle pass 'high'.
bgColor (color) : (color): The background color value.
Returns: (bool): A boolean value.
smallLabelUpperRight(txt, yPos, bgColor)
Displays the specified `txt` in a small label at the `yPos` of the current bar. The label points to the upper right.
Parameters:
txt (string)
yPos (float) : (float): The y-position value. To have it positioned below the candle pass 'low'.
bgColor (color) : (color): The background color value.
Returns: (bool): A boolean value.
smallLabelCenter(txt, yPos, bgColor)
Displays the specified `txt` in a small label at the `yPos` of the current bar. The label points to the center.
Parameters:
txt (string)
yPos (float) : (float): The y-position value. To have it positioned above the candle pass 'high'. To have it positioned below the candle pass 'low'.
bgColor (color) : (color): The background color value.
Returns: (bool): A boolean value.
smallLabelDown(txt, yPos, bgColor)
Displays the specified `txt` in a small label at the `yPos` of the current bar. The label points down.
Parameters:
txt (string)
yPos (float) : (float): The y-position value. To have it positioned above the candle pass 'high'.
bgColor (color) : (color): The background color value.
Returns: (bool): A boolean value.
smallLabelUp(txt, yPos, bgColor)
Displays the specified `txt` in a small label at the `yPos` of the current bar. The label points down.
Parameters:
txt (string)
yPos (float) : (float): The y-position value. To have it positioned below the candle pass 'low'.
bgColor (color) : (color): The background color value.
Returns: (bool): A boolean value.
normalLabelLowerRight(txt, yPos, bgColor)
Displays the specified `txt` in a normal label at the `yPos` of the current bar. The label points to the lower right.
Parameters:
txt (string)
yPos (float) : (float): The y-position value. To have it positioned above the candle pass 'high'.
bgColor (color) : (color): The background color value.
Returns: (bool): A boolean value.
normalLabelUpperRight(txt, yPos, bgColor)
Displays the specified `txt` in a normal label at the `yPos` of the current bar. The label points to the upper right.
Parameters:
txt (string)
yPos (float) : (float): The y-position value. To have it positioned below the candle pass 'low'.
bgColor (color) : (color): The background color value.
Returns: (bool): A boolean value.
normalLabelCenter(txt, yPos, bgColor)
Displays the specified `txt` in a normal label at the `yPos` of the current bar. The label points to the center.
Parameters:
txt (string)
yPos (float) : (float): The y-position value. To have it positioned above the candle pass 'high'. To have it positioned below the candle pass 'low'.
bgColor (color) : (color): The background color value.
Returns: (bool): A boolean value.
normalLabelDown(txt, yPos, bgColor)
Displays the specified `txt` in a normal label at the `yPos` of the current bar. The label points down.
Parameters:
txt (string)
yPos (float) : (float): The y-position value. To have it positioned above the candle pass 'high'.
bgColor (color) : (color): The background color value.
Returns: (bool): A boolean value.
normalLabelUp(txt, yPos, bgColor)
Displays the specified `txt` in a normal label at the `yPos` of the current bar. The label points down.
Parameters:
txt (string)
yPos (float) : (float): The y-position value. To have it positioned below the candle pass 'low'.
bgColor (color) : (color): The background color value.
Returns: (bool): A boolean value.
largeLabelLowerRight(txt, yPos, bgColor)
Displays the specified `txt` in a large label at the `yPos` of the current bar. The label points to the lower right.
Parameters:
txt (string)
yPos (float) : (float): The y-position value. To have it positioned above the candle pass 'high'.
bgColor (color) : (color): The background color value.
Returns: (bool): A boolean value.
largeLabelUpperRight(txt, yPos, bgColor)
Displays the specified `txt` in a large label at the `yPos` of the current bar. The label points to the upper right.
Parameters:
txt (string)
yPos (float) : (float): The y-position value. To have it positioned below the candle pass 'low'.
bgColor (color) : (color): The background color value.
Returns: (bool): A boolean value.
largeLabelCenter(txt, yPos, bgColor)
Displays the specified `txt` in a large label at the `yPos` of the current bar. The label points to the center.
Parameters:
txt (string)
yPos (float) : (float): The y-position value. To have it positioned above the candle pass 'high'. To have it positioned below the candle pass 'low'.
bgColor (color) : (color): The background color value.
Returns: (bool): A boolean value.
largeLabelDown(txt, yPos, bgColor)
Displays the specified `txt` in a large label at the `yPos` of the current bar. The label points down.
Parameters:
txt (string)
yPos (float) : (float): The y-position value. To have it positioned above the candle pass 'high'.
bgColor (color) : (color): The background color value.
Returns: (bool): A boolean value.
largeLabelUp(txt, yPos, bgColor)
Displays the specified `txt` in a large label at the `yPos` of the current bar. The label points down.
Parameters:
txt (string)
yPos (float) : (float): The y-position value. To have it positioned below the candle pass 'low'.
bgColor (color) : (color): The background color value.
Returns: (bool): A boolean value.
autoLabelLowerRight(txt, yPos, bgColor)
Displays the specified `txt` in a auto label at the `yPos` of the current bar. The label points to the lower right.
Parameters:
txt (string)
yPos (float) : (float): The y-position value. To have it positioned above the candle pass 'high'.
bgColor (color) : (color): The background color value.
Returns: (bool): A boolean value.
autoLabelUpperRight(txt, yPos, bgColor)
Displays the specified `txt` in a auto label at the `yPos` of the current bar. The label points to the upper right.
Parameters:
txt (string)
yPos (float) : (float): The y-position value. To have it positioned below the candle pass 'low'.
bgColor (color) : (color): The background color value.
Returns: (bool): A boolean value.
autoLabelCenter(txt, yPos, bgColor)
Displays the specified `txt` in a auto label at the `yPos` of the current bar. The label points to the center.
Parameters:
txt (string)
yPos (float) : (float): The y-position value. To have it positioned above the candle pass 'high'. To have it positioned below the candle pass 'low'.
bgColor (color) : (color): The background color value.
Returns: (bool): A boolean value.
autoLabelDown(txt, yPos, bgColor)
Displays the specified `txt` in a auto label at the `yPos` of the current bar. The label points down.
Parameters:
txt (string)
yPos (float) : (float): The y-position value. To have it positioned above the candle pass 'high'.
bgColor (color) : (color): The background color value.
Returns: (bool): A boolean value.
autoLabelUp(txt, yPos, bgColor)
Displays the specified `txt` in a auto label at the `yPos` of the current bar. The label points down.
Parameters:
txt (string)
yPos (float) : (float): The y-position value. To have it positioned below the candle pass 'low'.
bgColor (color) : (color): The background color value.
Returns: (bool): A boolean value.

Fractal Breakout Trend Following System█ OVERVIEW
The Fractal Breakout Trend Following System is a custom technical analysis tool designed to pinpoint significant fractal pivot points and breakout levels. By analyzing price action through configurable pivot parameters, this indicator dynamically identifies key support and resistance zones. It not only marks crucial highs and lows on the chart but also signals potential trend reversals through real-time breakout detections, helping traders capture shifts in market momentum.
█ KEY FEATURES
Fractal Pivot Detection
Utilizes user-defined left and right pivot lengths to detect local highs (pivot highs) and lows (pivot lows). This fractal-based approach ensures that only meaningful price moves are considered, effectively filtering out minor market noise.
Dynamic Line Visualization
Upon confirmation of a pivot, the system draws a dynamic line representing resistance (from pivot highs) or support (from pivot lows). These lines extend across the chart until a breakout occurs, offering a continuous visual guide to key levels.
Trend Breakout Signals
Monitors for price crossovers relative to the drawn pivot lines. A crossover above a resistance line signals a bullish breakout, while a crossunder below a support line indicates a bearish move, thus updating the prevailing trend.
Pivot Labelling
Assigns labels such as "HH", "LH", "LL", or "HL" to detected pivots based on their relative values.
It uses the following designations:
HH (Higher High) : Indicates that the current pivot high is greater than the previous pivot high, suggesting continued upward momentum.
LH (Lower High) : Signals that the current pivot high is lower than the previous pivot high, which may hint at a potential reversal within an uptrend.
LL (Lower Low) : Shows that the current pivot low is lower than the previous pivot low, confirming sustained downward pressure.
HL (Higher Low) : Reveals that the current pivot low is higher than the previous pivot low, potentially indicating the beginning of an upward reversal in a downtrend.
These labels provide traders with immediate insight into the market structure and recent price behavior.
Customizable Visual Settings
Offers various customization options:
• Adjust pivot sensitivity via left/right pivot inputs.
• Toggle pivot labels on or off.
• Enable background color changes to reflect bullish or bearish trends.
• Choose preferred colors for bullish (e.g., green) and bearish (e.g., red) signals.
█ UNDERLYING METHODOLOGY & CALCULATIONS
Fractal Pivot Calculation
The script employs a sliding window technique using configurable left and right parameters to identify local highs and lows. Detected pivot values are sanitized to ensure consistency in subsequent calculations.
Dynamic Line Plotting
When a new pivot is detected, a corresponding line is drawn from the pivot point. This line extends until the price breaks the level, at which point it is reset. This method provides a continuous reference for support and resistance.
Trend Breakout Identification
By continuously monitoring price interactions with the pivot lines, the indicator identifies breakouts. A price crossover above a resistance line suggests a bullish breakout, while a crossunder below a support line indicates a bearish shift. The current trend is updated accordingly.
Pivot Label Assignment
The system compares the current pivot with the previous one to determine if the move represents a higher high, lower high, higher low, or lower low. This classification helps traders understand the underlying market momentum.
█ HOW TO USE THE INDICATOR
1 — Apply the Indicator
• Add the Fractal Breakout Trend Following System to your chart to begin visualizing dynamic pivot points and breakout signals.
2 — Adjust Settings for Your Market
• Pivot Detection – Configure the left and right pivot lengths for both highs and lows to suit your desired sensitivity:
- Use shorter lengths for more responsive signals in fast-moving markets.
- Use longer lengths to filter out minor fluctuations in volatile conditions.
• Visual Customization – Toggle the display of pivot labels and background color changes. Select your preferred colors for bullish and bearish trends.
3 — Interpret the Signals
• Support & Resistance Lines – Observe the dynamically drawn lines that represent key pivot levels.
• Pivot Labels – Look for labels like "HH", "LH", "LL", and "HL" to quickly assess market structure and trend behavior.
• Trend Signals – Watch for price crossovers and corresponding background color shifts to gauge bullish or bearish breakouts.
4 — Integrate with Your Trading Strategy
• Use the identified pivot points as potential support and resistance levels.
• Combine breakout signals with other technical indicators for comprehensive trade confirmation.
• Adjust the sensitivity settings to tailor the indicator to various instruments and market conditions.
█ CONCLUSION
The Fractal Breakout Trend Following System offers a robust framework for identifying critical fractal pivot points and potential breakout opportunities. With its dynamic line plotting, clear pivot labeling, and customizable visual settings, this indicator equips traders with actionable insights to enhance decision-making and optimize entry and exit strategies.

Market Structure HH, HL, LH and LLMarket Structure Indicator (HH, HL, LH, LL) – Explanation and Usage
Overview:
This indicator is designed to detect and visualize market structure shifts by identifying Higher Highs (HH), Higher Lows (HL), Lower Highs (LH), and Lower Lows (LL). It plots a ZigZag structure to mark trend changes, helping traders analyze price swings and market direction.
Indicator Logic:
The indicator operates based on ZigZag swing points to define trend shifts and structure changes.
Identifying Market Swings:
It finds local highs and lows using the ZigZag Length (zigzag_len), which defines how many bars back to check for a new swing high/low.
If the current high is the highest over zigzag_len periods, it marks it as a swing high.
If the current low is the lowest over zigzag_len periods, it marks it as a swing low.
Determining Market Structure:
Uptrend: Higher Highs (HH) & Higher Lows (HL)
Downtrend: Lower Lows (LL) & Lower Highs (LH)
The script continuously tracks the last two highs (h0, h1) and last two lows (l0, l1) to classify the current market structure.
Visual Elements:
ZigZag Line (Optional): Connects major swing highs and lows for trend visualization.
Labels (HH, HL, LH, LL):
HH (Higher High) – Price is making new highs → Uptrend Continuation.
HL (Higher Low) – Price forms a higher bottom → Uptrend Confirmation.
LL (Lower Low) – Price is making new lows → Downtrend Continuation.
LH (Lower High) – Price forms a lower top → Downtrend Confirmation.
Breakout Confirmation with Fibonacci Factor (Optional)
The indicator includes an option to confirm breakouts using the fib_factor, which ensures price moves beyond a certain retracement level.
How to Use This Indicator in Trading:
1. Identifying Trends & Trend Reversals
Uptrend: Look for a sequence of HH and HL.
Downtrend: Look for a sequence of LL and LH.
Trend Reversal: If price transitions from HH-HL to LH-LL, it signals a shift from an uptrend to a downtrend (and vice versa).
2. Confirming Entry & Exit Points
Buy Entry (Long Position)
Enter after a Higher Low (HL) is confirmed in an uptrend.
Combine with support zones or moving averages for confirmation.
Sell Entry (Short Position)
Enter after a Lower High (LH) is confirmed in a downtrend.
Combine with resistance zones or moving averages for confirmation.
Exit Strategy
Exit long trades when price fails to make a HH and forms an LH instead.
Exit short trades when price fails to make a LL and forms an HL instead.
3. Spotting Breakouts & Order Blocks
The Fib Factor setting allows traders to filter false breakouts by confirming price movement beyond a retracement threshold.
Potential Order Blocks can be identified by looking at the last major swing point before a breakout.
Benefits of This Indicator for Traders
✅ Trend Identification: Helps traders quickly determine if the market is in an uptrend or downtrend.
✅ Clear Market Structure Labels: Easily visualizes Higher Highs, Higher Lows, Lower Highs, and Lower Lows.
✅ Avoids Noise: The ZigZag algorithm removes small fluctuations and focuses on significant market movements.
✅ Assists with Entry & Exit Decisions: Provides objective signals for trend continuation or reversals.
✅ Works in All Markets: Useful for stocks, forex, crypto, and futures trading.
Would you like me to add additional features like Order Blocks, Breakout Confirmation, or Alerts to improve this indicator? 🚀

One Trading Setup for Life ICT [TradingFinder] Sweep Session FVG🔵 Introduction
ICT One Trading Setup for Life is a trading strategy based on liquidity and market structure shifts, utilizing the PM Session Sweep to determine price direction. In this strategy, the market first forms a price range during the PM Session (from 13:30 to 16:00 EST), which includes the highest high (PM Session High) and lowest low (PM Session Low).
In the next session, the price first touches one of these levels to trigger a Liquidity Hunt before confirming its trend by breaking the Change in State of Delivery (CISD) Level. After this confirmation, the price retraces toward a Fair Value Gap (FVG) or Order Block (OB), which serve as the best entry points in alignment with liquidity.
In financial markets, liquidity is the primary driver of price movement, and major market participants such as institutional investors and banks are constantly seeking liquidity at key levels. This process, known as Liquidity Hunt or Liquidity Sweep, occurs when the price reaches an area with a high concentration of orders, absorbs liquidity, and then reverses direction.
In this setup, the PM Session range acts as a trading framework, where its highs and lows function as key liquidity zones that influence the next session’s price movement. After the New York market opens at 9:30 EST, the price initially breaks one of these levels to capture liquidity.
However, for a trend shift to be confirmed, the CISD Level must be broken.
Once the CISD Level is breached, the price retraces toward an FVG or OB, which serve as optimal trade entry points.
Bullish Setup :
Bearish Setup :
🔵 How to Use
In this strategy, the PM Session range is first identified, which includes the highest high (PM Session High) and lowest low (PM Session Low) between 13:30 and 16:00 EST. In the following session, the price touches one of these levels for a Liquidity Hunt, followed by a break of the Change in State of Delivery (CISD) Level. The price then retraces toward a Fair Value Gap (FVG) or Order Block (OB), creating a trading opportunity.
This process can occur in two scenarios : bearish and bullish setups.
🟣 Bullish Setup
In a bullish scenario, the PM Session High and PM Session Low are identified. In the following session, the price first breaks the PM Session Low, absorbing liquidity. This process results in a Fake Breakout to the downside, misleading retail traders into taking short positions.
After the Liquidity Hunt, the CISD Level is broken, confirming a trend reversal. The price then retraces toward an FVG or OB, offering an optimal long entry opportunity.
The initial take-profit target is the PM Session High, but if higher timeframe liquidity levels exist, extended targets can be set.
The stop-loss should be placed below the Fake Breakout low or the first candle of the FVG.
🟣 Bearish Setup
In a bearish scenario, the market first defines its PM Session High and PM Session Low. In the next session, the price initially breaks the PM Session High, triggering a Liquidity Hunt. This movement often causes a Fake Breakout, misleading retail traders into taking incorrect positions.
After absorbing liquidity, the CISD Level breaks, indicating a shift in market structure. The price then retraces toward an FVG or OB, offering the best short entry opportunity.
The initial take-profit target is the PM Session Low, but if additional liquidity exists on higher timeframes, lower targets can be considered.
The stop-loss should be placed above the Fake Breakout high or the first candle of the FVG.
🔵 Setting
CISD Bar Back Check : The Bar Back Check option enables traders to specify the number of past candles checked for identifying the CISD Level, enhancing CISD Level accuracy on the chart.
Order Block Validity : The number of candles that determine the validity of an Order Block.
FVG Validity : The duration for which a Fair Value Gap remains valid.
CISD Level Validity : The duration for which a CISD Level remains valid after being broken.
New York PM Session : Defines the PM Session range from 13:30 to 16:00 EST.
New York AM Session : Defines the AM Session range from 9:30 to 16:00 EST.
Refine Order Block : Enables finer adjustments to Order Block levels for more accurate price responses.
Mitigation Level OB : Allows users to set specific reaction points within an Order Block, including: Proximal: Closest level to the current price. 50% OB: Midpoint of the Order Block. Distal: Farthest level from the current price.
FVG Filter : The Judas Swing indicator includes a filter for Fair Value Gap (FVG), allowing different filtering based on FVG width: FVG Filter Type: Can be set to "Very Aggressive," "Aggressive," "Defensive," or "Very Defensive." Higher defensiveness narrows the FVG width, focusing on narrower gaps.
Mitigation Level FVG : Like the Order Block, you can set price reaction levels for FVG with options such as Proximal, 50% OB, and Distal.
Demand Order Block : Enables or disables bullish Order Block.
Supply Order Block : Enables or disables bearish Order Blocks.
Demand FVG : Enables or disables bullish FVG.
Supply FVG : Enables or disables bearish FVGs.
Show All CISD : Enables or disables the display of all CISD Levels.
Show High CISD : Enables or disables high CISD levels.
Show Low CISD : Enables or disables low CISD levels.
🔵 Conclusion
The ICT One Trading Setup for Life is a liquidity-based strategy that leverages market structure shifts and precise entry points to identify high-probability trade opportunities. By focusing on PM Session High and PM Session Low, this setup first captures liquidity at these levels and then confirms trend shifts with a break of the Change in State of Delivery (CISD) Level.
Entering a trade after a retracement to an FVG or OB allows traders to position themselves at optimal liquidity levels, ensuring high reward-to-risk trades. When used in conjunction with higher timeframe bias, order flow, and liquidity analysis, this strategy can become one of the most effective trading methods within the ICT Concept framework.
Successful execution of this setup requires risk management, patience, and a deep understanding of liquidity dynamics. Traders can enhance their confidence in this strategy by conducting extensive backtesting and analyzing past market data to optimize their approach for different assets.

UVR Crypto TrendINDICATOR OVERVIEW: UVR CRYPTO TREND
The UVR Crypto Trend indicator is a custom-built tool designed specifically for cryptocurrency markets, utilizing advanced volatility, momentum, and trend-following techniques. It aims to identify trend reversals and provide buy and sell signals by analyzing multiple factors, such as price volatility(UVR), RSI (Relative Strength Index), CMF (Chaikin Money Flow), and EMA (Exponential Moving Average). The indicator is optimized for CRYPTO MARKETS only.
KEY FEATURES AND HOW IT WORKS
Volatility Analysis with UVR
The UVR (Ultimate Volatility Rate) is a proprietary calculation that measures market volatility by comparing significant price extremes and smoothing the data over time.
Purpose: UVR aims to reduce noise in low-volatility environments and highlight significant movements during higher-volatility periods. While it strives to improve filtering in low-volatility conditions, it does not guarantee perfect performance, making it a balanced and adaptable tool for dynamic markets like cryptocurrency.
HOW UVR (ULTIMATE VOLATILITY RATE) IS CALCULATED
UVR is calculated using a method that ensures precise measurement of market volatility by comparing price extremes across consecutive candles:
Volatility Components:
Two values are calculated to represent potential price fluctuations:
The absolute difference between the current candle's high and the previous candle's low:
Volatility Component 1=∣High−Low ∣
The absolute difference between the previous candle's high and the current candle's low:
Volatility Component 2=∣High −Low∣
Volatility Ratio:
The larger of the two components is selected as the Volatility Ratio, ensuring UVR captures the most significant movement:
Volatility Ratio=max(Volatility Component 1,Volatility Component 2)
Smoothing with SMMA:
To stabilize the volatility calculation, the Volatility Ratio is smoothed using a Smoothed Moving Average (SMMA) over a user-defined period (e.g., 14 candles):
UVR=(UVR(Previous)×(Period−1)+Volatility Ratio)/Period
This calculation ensures UVR adapts dynamically to market conditions, focusing on significant price movements while filtering out noise.
RSI FOR MOMENTUM DETECTION
RSI (Relative Strength Index) identifies overbought and oversold conditions.
Trend Confirmation at the 50 Level
RSI values crossing above 50 signal the potential start of an upward trend.
RSI values crossing below 50 indicate the potential start of a downward trend.
Key Reversals at Extreme Levels
RSI detects trend reversals at overbought (>70) and oversold (<30) levels.
For example:
Overbought Trend Reversal: RSI >70 followed by bearish price action signals a potential downtrend.
Oversold Trend Reversal: RSI <30 with bullish confirmation signals a potential uptrend.
Rare Extreme RSI Readings
Extreme levels, such as RSI <12 (oversold) or RSI >88 (overbought), are used to identify rare yet powerful reversals.
---HOW IT DIFFERS FROM OTHER INDICATORS---
Using UVR High and Low Values
The Ultimate Volatility Rate (UVR) focuses on analyzing the high and low price ranges of the market to measure volatility.
Unlike traditional trend indicators that rely primarily on momentum or moving average crossovers, UVR leverages price extremes to better identify trend reversals.
This approach ensures fewer false signals during low-volatility phases and more accurate trend detection during high-volatility conditions.
UVR as the Core Component
The indicator is fundamentally built around UVR as the primary filter, while supporting tools like RSI (momentum detection), CMF (volume confirmation), and EMA (trend validation) complement its functionality.
By integrating these additional components, the indicator provides a multidimensional analysis rather than relying solely on a single approach.
Dynamic Adaptation to Volatility
UVR dynamically adjusts to market conditions, striving to improve filtering in low-volatility phases. While not flawless, this approach minimizes false signals and adapts more effectively to varying levels of market activity.
Trend Clouds for Visual Guidance
UVR-based dynamic clouds visually mark high and low price areas, highlighting potential consolidation or retracement zones.
These clouds serve as guides for setting stop-loss or take-profit levels, offering clear risk management strategies.
BUY AND SELL SIGNAL LOGIC
BUY CONDITIONS
Momentum-Based Buy-Entry
RSI >50, CMF >0, and the close price is above EMA50.
The price difference between open and close exceeds a threshold based on UVR.
Oversold Reversal
RSI <30 and CMF >0 with a strong bullish candle (close > open and UVR-based sensitivity filter).
Breakout Confirmation
The price breaks above a previously identified resistance, with conditions for RSI and CMF supporting the breakout.
Reversal from Oversold RSI Extreme
RSI <12 on the previous candle with a strong rebound on the current candle with UVR confirmation filter.
SELL CONDITIONS
Momentum-Based Sell-Entry
RSI <50, CMF <0, and the close price is below EMA50.
The price difference between open and close exceeds the UVR threshold.
Overbought Reversal
RSI >70 with bearish price action (open > close and UVR-based sensitivity filter).
Breakdown Confirmation
The price breaks below a previously identified support, with RSI and CMF supporting the breakdown.
Reversal from Overbought RSI Extreme
RSI >88 on the previous candle with a bearish confirmation on the current candle with UVR confirmation filter.
BUY AND SELL SIGNALS VISUALIZATION
The UVR Crypto Trend Indicator visually represents buy and sell conditions using dynamic plots, making it easier for traders to interpret and act on the signals. Below is an explanation of the visual representation:
Buy Signals and Visualization
Signal Trigger:
A buy signal is generated when one of the defined Buy Conditions is met (e.g., RSI >50, CMF >0, price above EMA50).
Visual Representation:
A blue upward arrow appears at the candle where the buy condition is triggered.
A blue cloud forms above the price candles, representing the strength of the bullish trend. The cloud dynamically adapts to market volatility, using the UVR calculation to mark support zones or consolidation levels.
Purpose of the Blue Cloud:
It acts as a visual guide for price movements and stay horizontal when the trend is not moving up
Sell Signals and Visualization
Signal Trigger:
A sell signal is generated when one of the defined Sell Conditions is met (e.g., RSI <50, CMF <0, price below EMA50).
Visual Representation:
A red downward arrow appears at the candle where the sell condition is triggered.
A red cloud forms below the price candles, representing the strength of the bearish trend. Like the blue cloud, it uses the UVR calculation to dynamically mark resistance zones or potential retracement levels.
Purpose of the Red Cloud:
It acts as a visual guide for price movements and stay horizontal when the trend is not moving down.
CONCLUSION
The UVR Crypto Trend indicator provides a powerful tool for trend reversal detection by combining volatility analysis, momentum confirmation, and trend-following techniques. Its unique use of the Ultimate Volatility Rate (UVR) as a core element, supported by proven indicators like RSI, CMF, and EMA, ensures reliable and actionable signals tailored for the crypto market's dynamic nature. By leveraging UVR’s high and low price range analysis, it achieves a level of precision that traditional indicators lack, making it a high-performing system for cryptocurrency traders.
