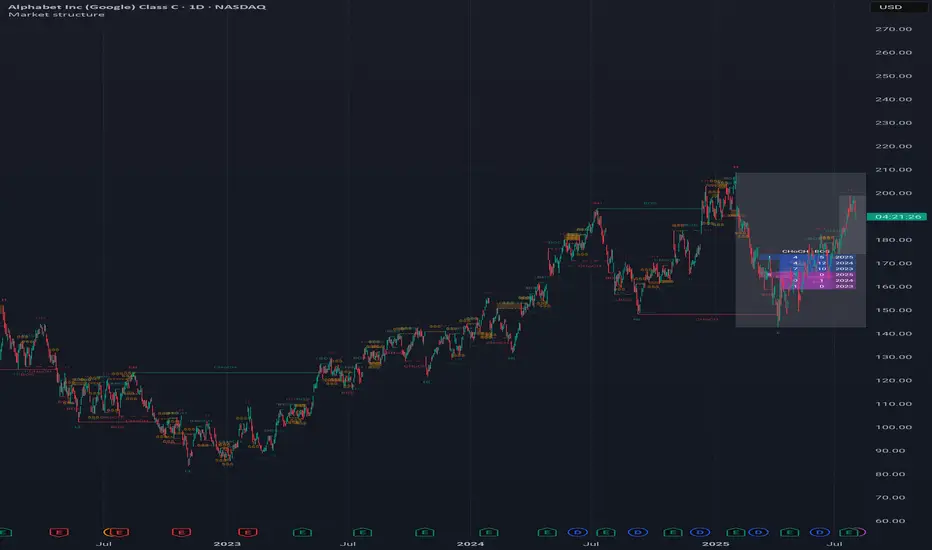
Strong Demands & Supplies + Liquidity | Zonas de Compra e VendaThis indicator is inspired on the Smart Money Concepts indicator (Credits to @LuxAlgo) and it was optimized to show only the most relevant demand and supply zones (premium) on every time frame - but on higher time frames (1H and above) the zones are more relevant and stronger, meaning these zones can handle the price for longer time.
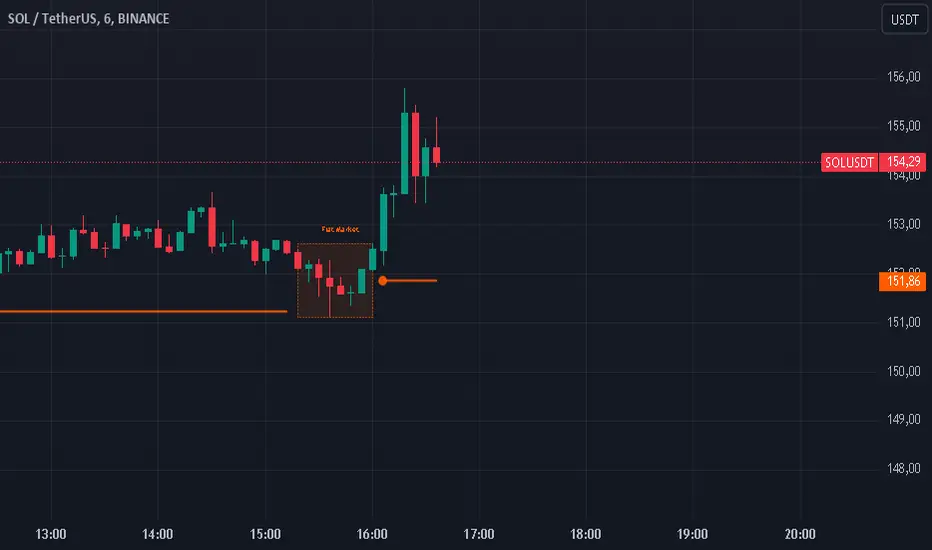
I've added a new feature that includes the Liquidity lines in order to add more confluence and importance to a demand or supply zone: when a demand or supply zone has strong liquidity (like weekly or monthly) next to it means that zone can be a strongest price target.
- Blue Line: Daily liquidity
- Yellow Line: Weekly Liquidity
- Purple Line: Monthly Liquidity
Main Features:
- Displays the most relevant demand and supply zones (green and red boxes) and which ones are strong and weak
- Displays the relevant change of character and break of structure
- Displays the previous day highest price and previous day lowest price
- Display imbalances between sell and buy orders (purple boxes)
- Displays the liquidity areas with lines on each point.
- It works for Forex and Cryptocurrency as well.
Portuguese:
Este indicador é inspirado no Smart Money Concepts (Créditos para @LuxAlgo) e foi otimizado para mostrar apenas as zonas de procura e oferta mais relevantes em cada time frame - mas em time frames maiores as zonas são mais relevantes e mais fortes.
Adicionei uma nova funcionalidade que inclui as linhas de Liquidez de forma a adicionar mais confluência e importância a uma zona de procura ou oferta: quando uma zona de procura ou oferta tem forte liquidez (como semanal/linha amarela ou mensal/linha roxa) junto a ela significa que aquela zona pode ser um alvo de preço mais forte.
- Linha Azul: Liquidez diária
- Linha Amarela: Liquidez Semanal
- Linha Roxa: Liquidez Mensal
Principais características:
- Exibe as zonas de procura e oferta mais relevantes (zonas a verde e zonas a vermelho) e quais delas são fortes e fracas
- Exibe a mudança relevante de caráter e quebra de estrutura
- Exibe o preço mais alto do dia anterior e o preço mais baixo do dia anterior
- Exibe as imbalances entre as ordens de venda e compra (zonas a roxo)
- Exibe as zonas de maior liquidez através de linhas no gráfico
- Funciona tanto para Forex como para Criptomoedas
Pine Script®指標